ALLORA +27.1% (Resonance Directional Strategy)

Ineffective market selling in a sideways range 📊 Formation of a local shortage, confirmed through cumulative delta and volume efficiency. +27% move and profit-taking on rising volatility.
Table of contents

Asset: ALLORA/USDT
Risk: medium
Level of understanding: beginner
Entry reasons
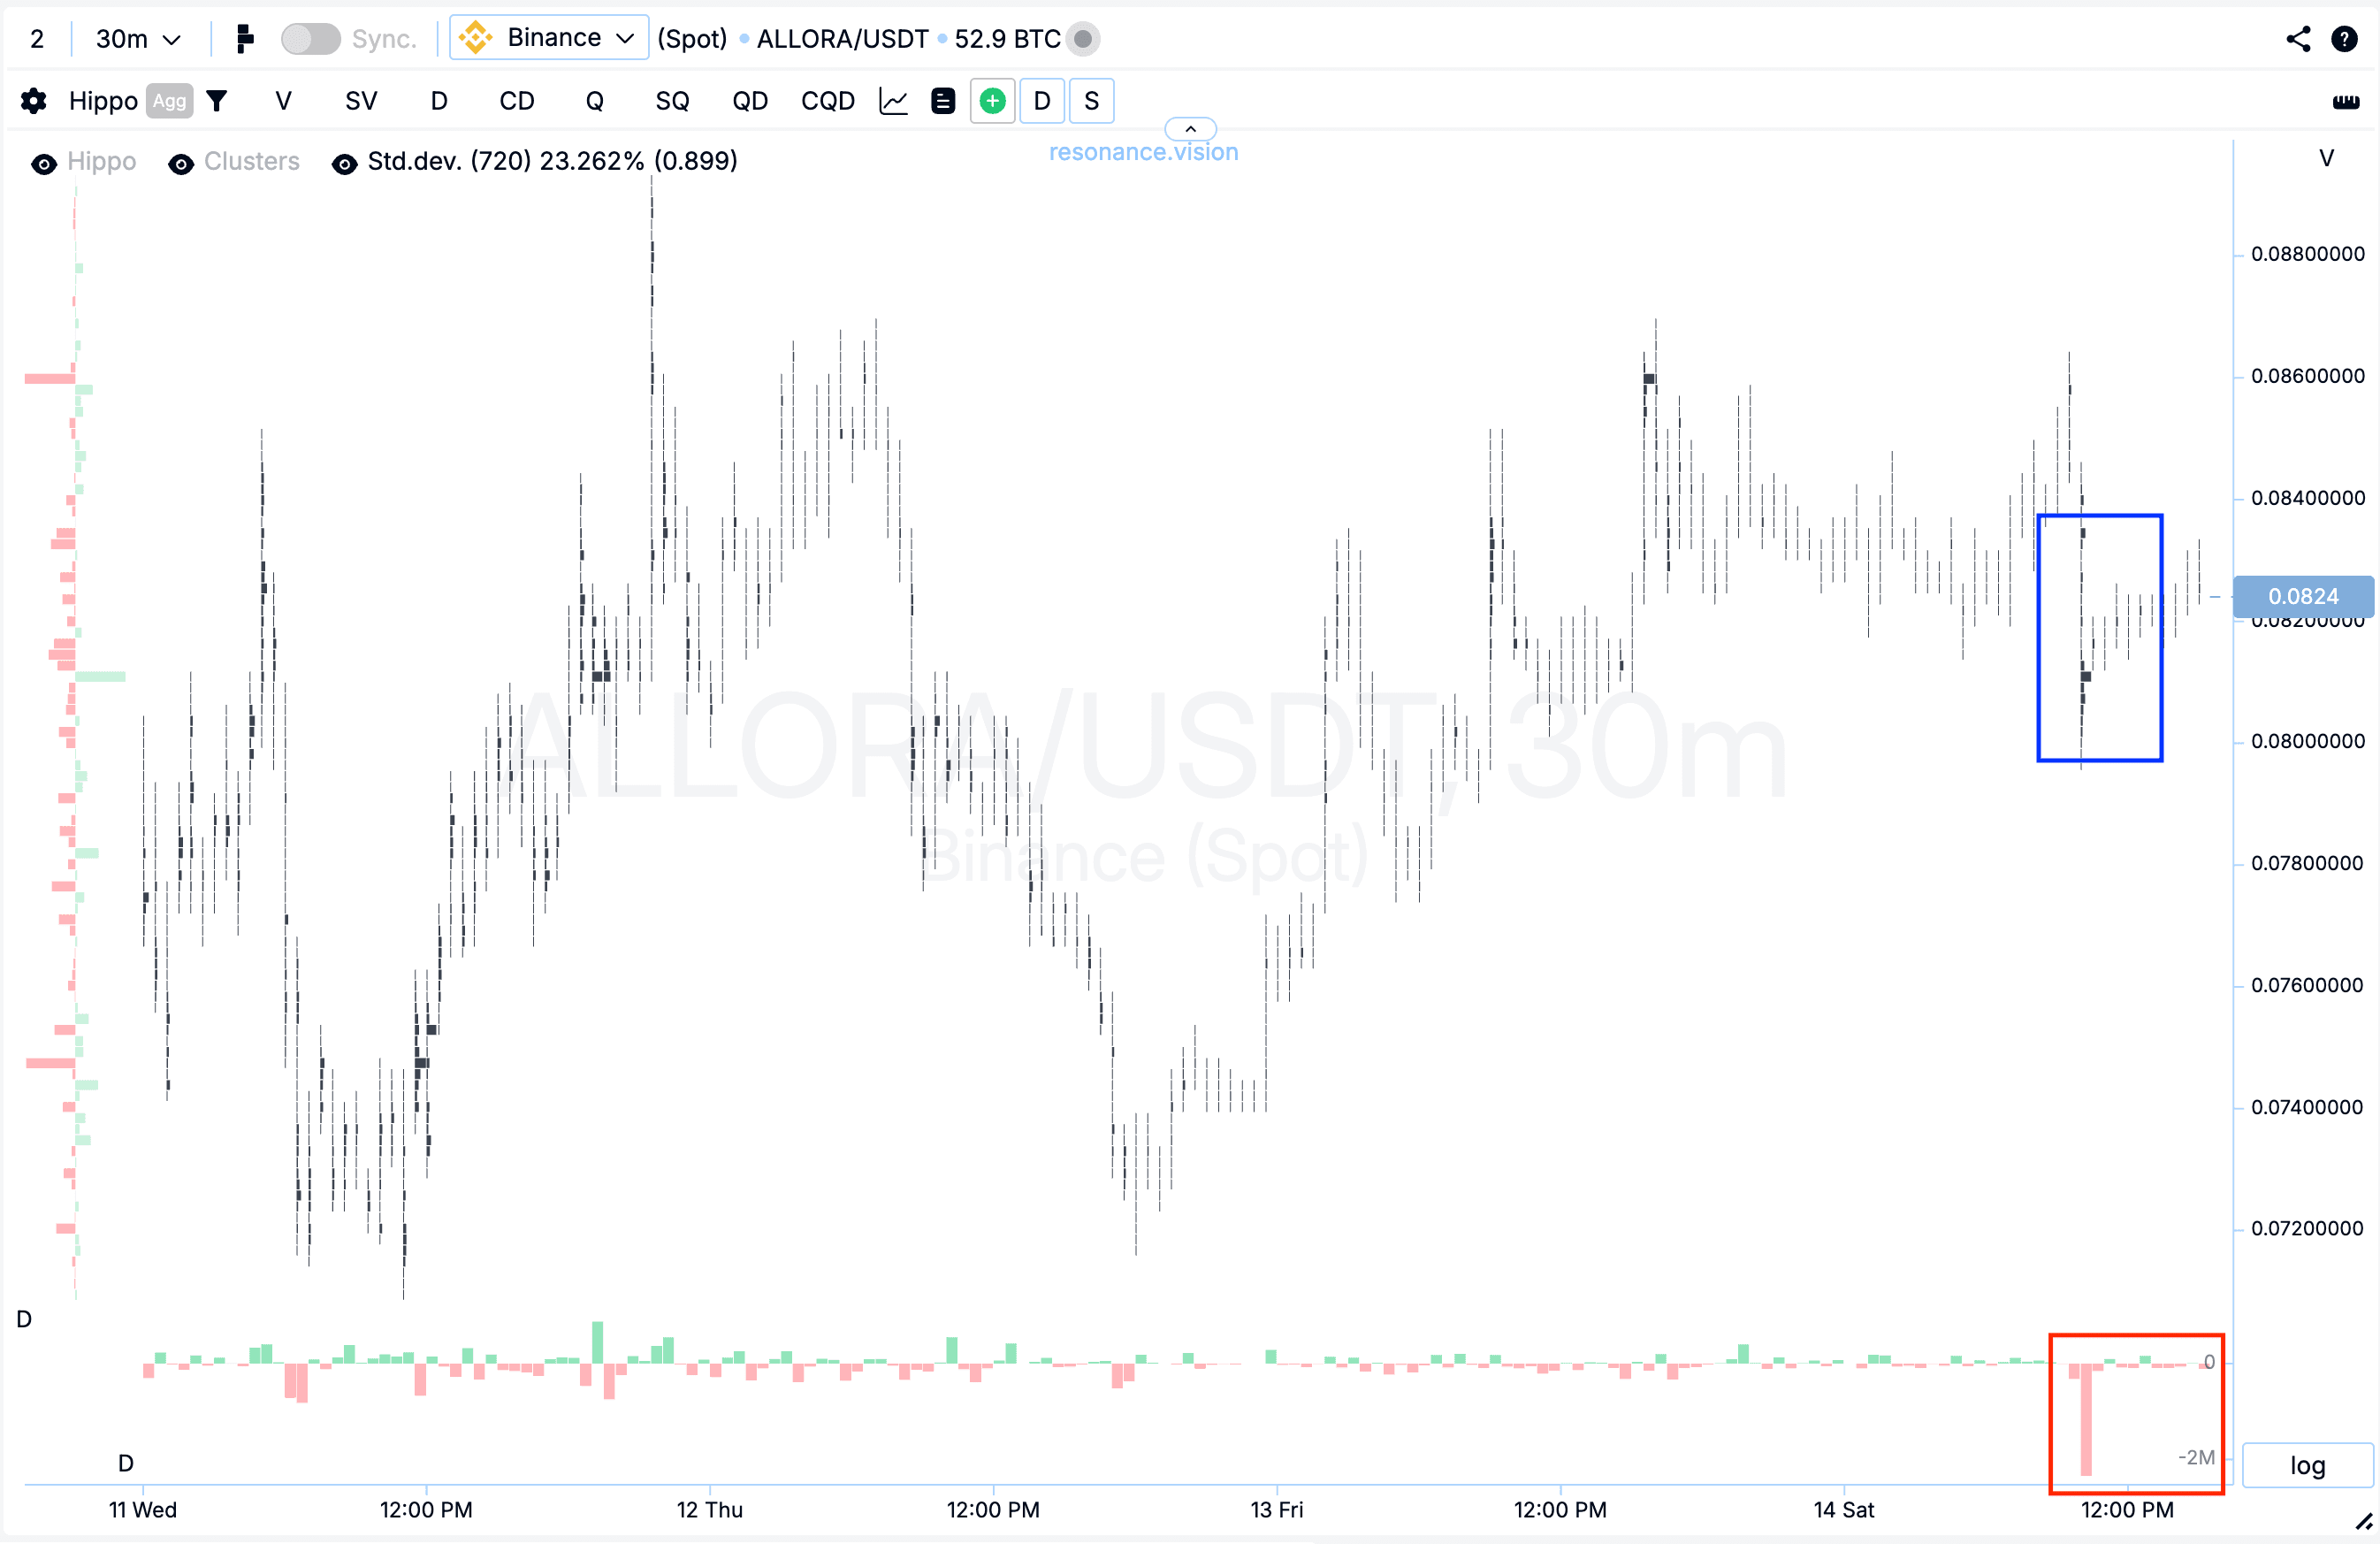
Cluster chart: locally, during a sideways consolidation phase, large volume clusters were formed (blue rectangle), within which a noticeable dominance of market sell orders was observed (red rectangle).
However, despite the increasing pressure from sellers, the price did not demonstrate a corresponding decline.
Such market behavior indicates growing demand and the formation of signs of a local deficit: sellers continue to actively expend volume, but their impact on price becomes ineffective.
In the Dashboard
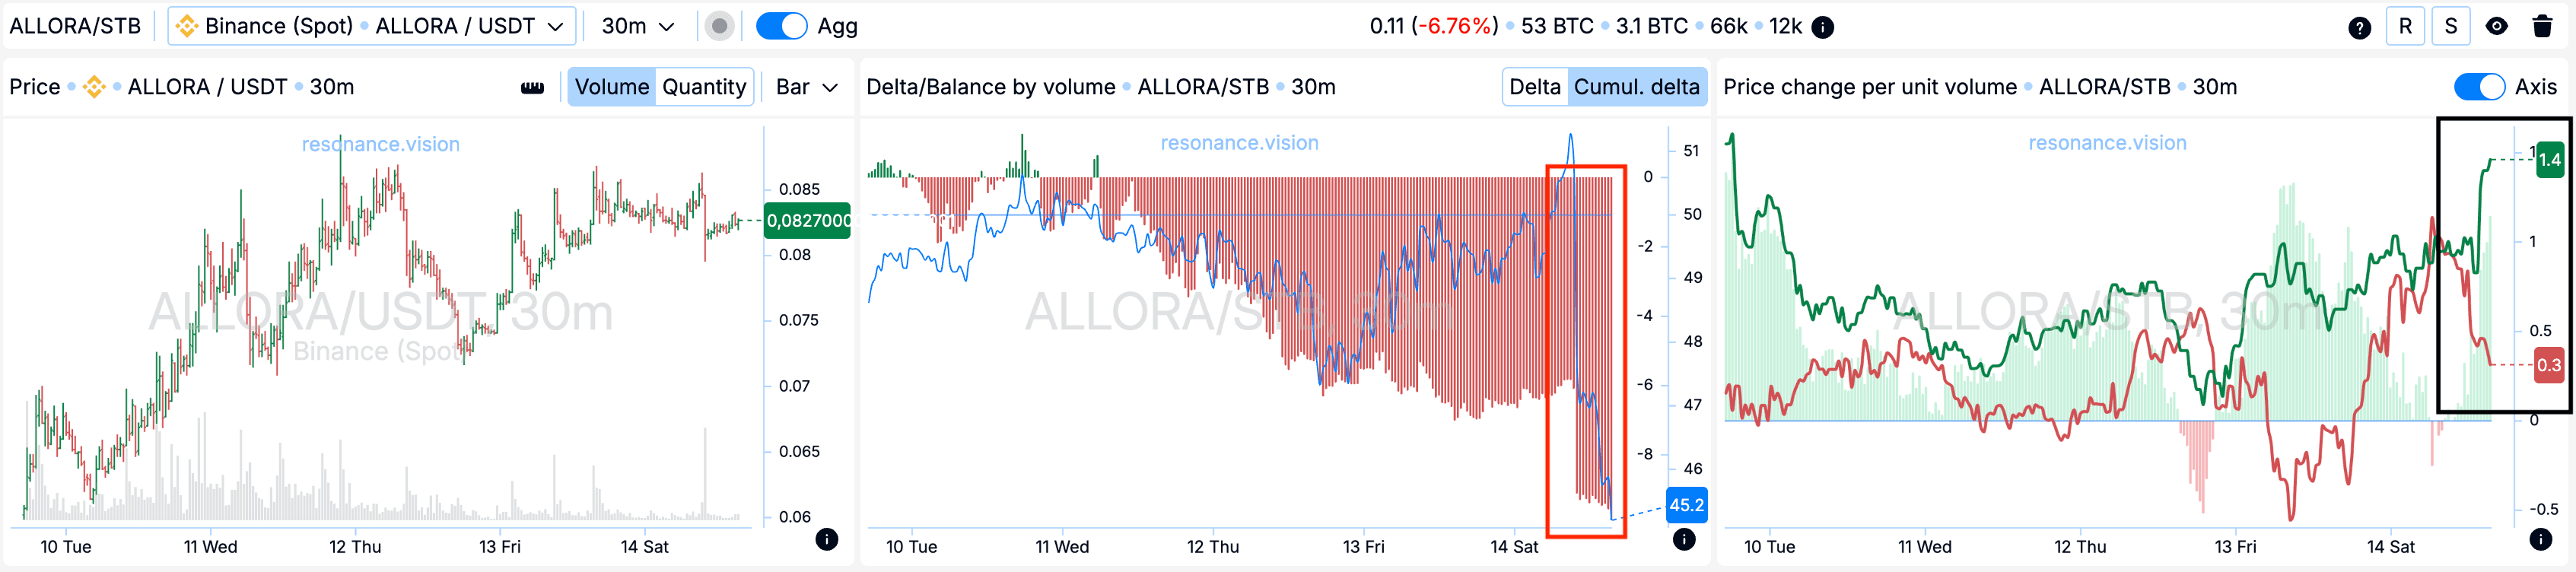
Delta / Volume balance: aggregated data across all pairs and exchanges confirms the picture observed on the cluster chart. During the analyzed period, the market was under pronounced cumulative pressure from market sell orders, which is clearly visible on the cumulative delta histogram (red arrow).
At the same time, the price did not demonstrate a comparable decline, indicating active absorption of incoming market volume by limit buyers. As a result, local support is formed within the current price range, further confirming signs of supply deficit.
Price change per unit of volume: additionally, a shift in the effectiveness of market orders in favor of buyers is recorded (black rectangle).
Less volume is required to push the price upward than to move it downward, which indicates increasing buying efficiency and a gradual weakening of pressure from sellers.
Exit reasons
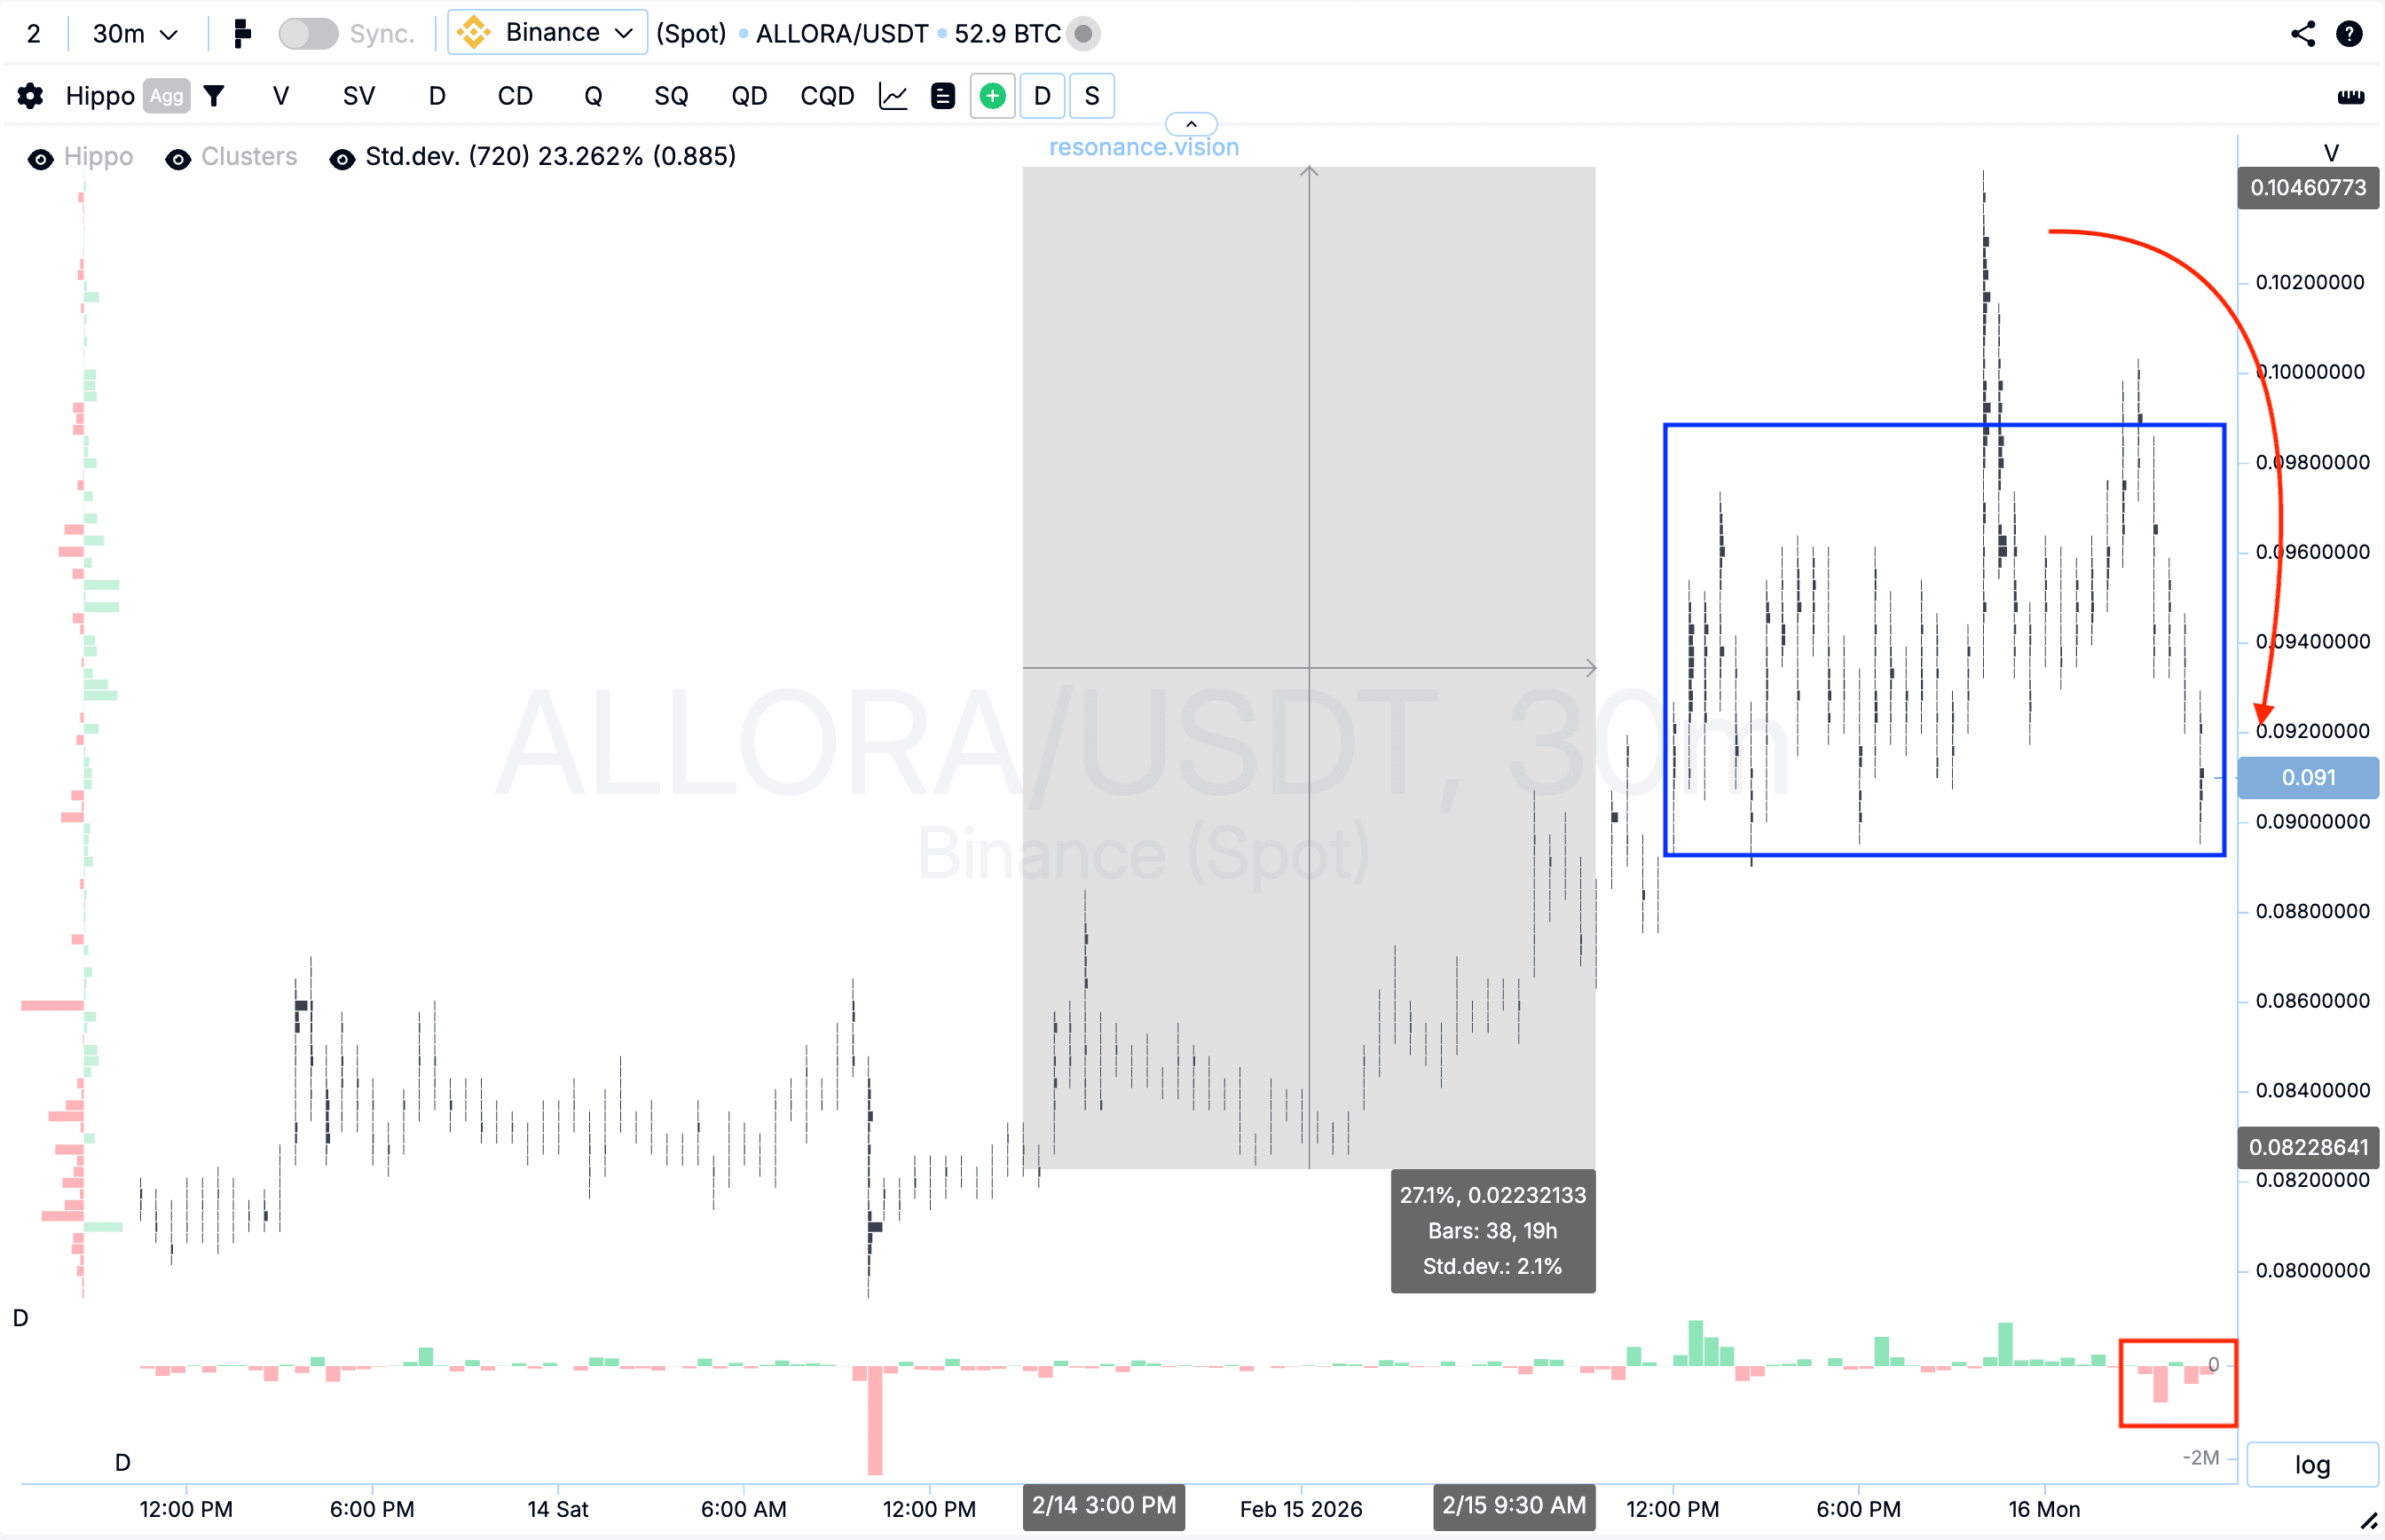
Cluster chart: after the entry point, the price increased by an additional 27%. Subsequently, volatility increased noticeably within this price range (blue rectangle).
Against this background, market sell orders began to dominate, after which a pullback formed (red rectangle and arrow).
Such dynamics indicate rising uncertainty and often signal a transition of the market into a balance-seeking phase. Under these conditions, further position holding would have been accompanied by increased risk, therefore profit-taking appeared to be the most rational and balanced decision, allowing the realized movement to be secured and the result to be protected.
Conclusion
This analysis is based not merely on volume itself, but on its effectiveness. Despite the pronounced dominance of market sell orders, the price did not demonstrate a corresponding decline, indicating active absorption of supply and the formation of a local deficit. The interaction between volume and price reaction became the key argument for entry.
Additional confirmation through aggregated data and the analysis of price change per unit of volume allowed for an objective identification of the shift in initiative toward buyers.
The exit from the position was driven by increased volatility and the appearance of signs of the market transitioning into a balance phase.
Such an approach allows for systematic work with phases of deficit and surplus, focusing on the quality of movement and risk management rather than emotions or expectations of trend continuation.
Follow new insights in our telegram channel.
No need to invent complex schemes and look for the "grail". Use the Resonance platform tools.
Register via the link — get a bonus and start earning:
OKX | BingX | KuCoin.
Promo code TOPBLOG gives you a 10% discount on any Resonance tariff plan.
Recommended articles


