ALLORA +171.26% (Напрямкова стратегія Resonance)

Розбір угоди через кластерний аналіз та дельту: як неефективність маркет-продажів дозволила виявити локальний дефіцит та увійти у позицію, а повернення ефективності продавців стало сигналом до фіксації прибутку після зростання більш ніж на 170%.
Зміст

Монета: ALLORA/USDT
Ризик: середній
Рівень розуміння: новачок
Причини входу
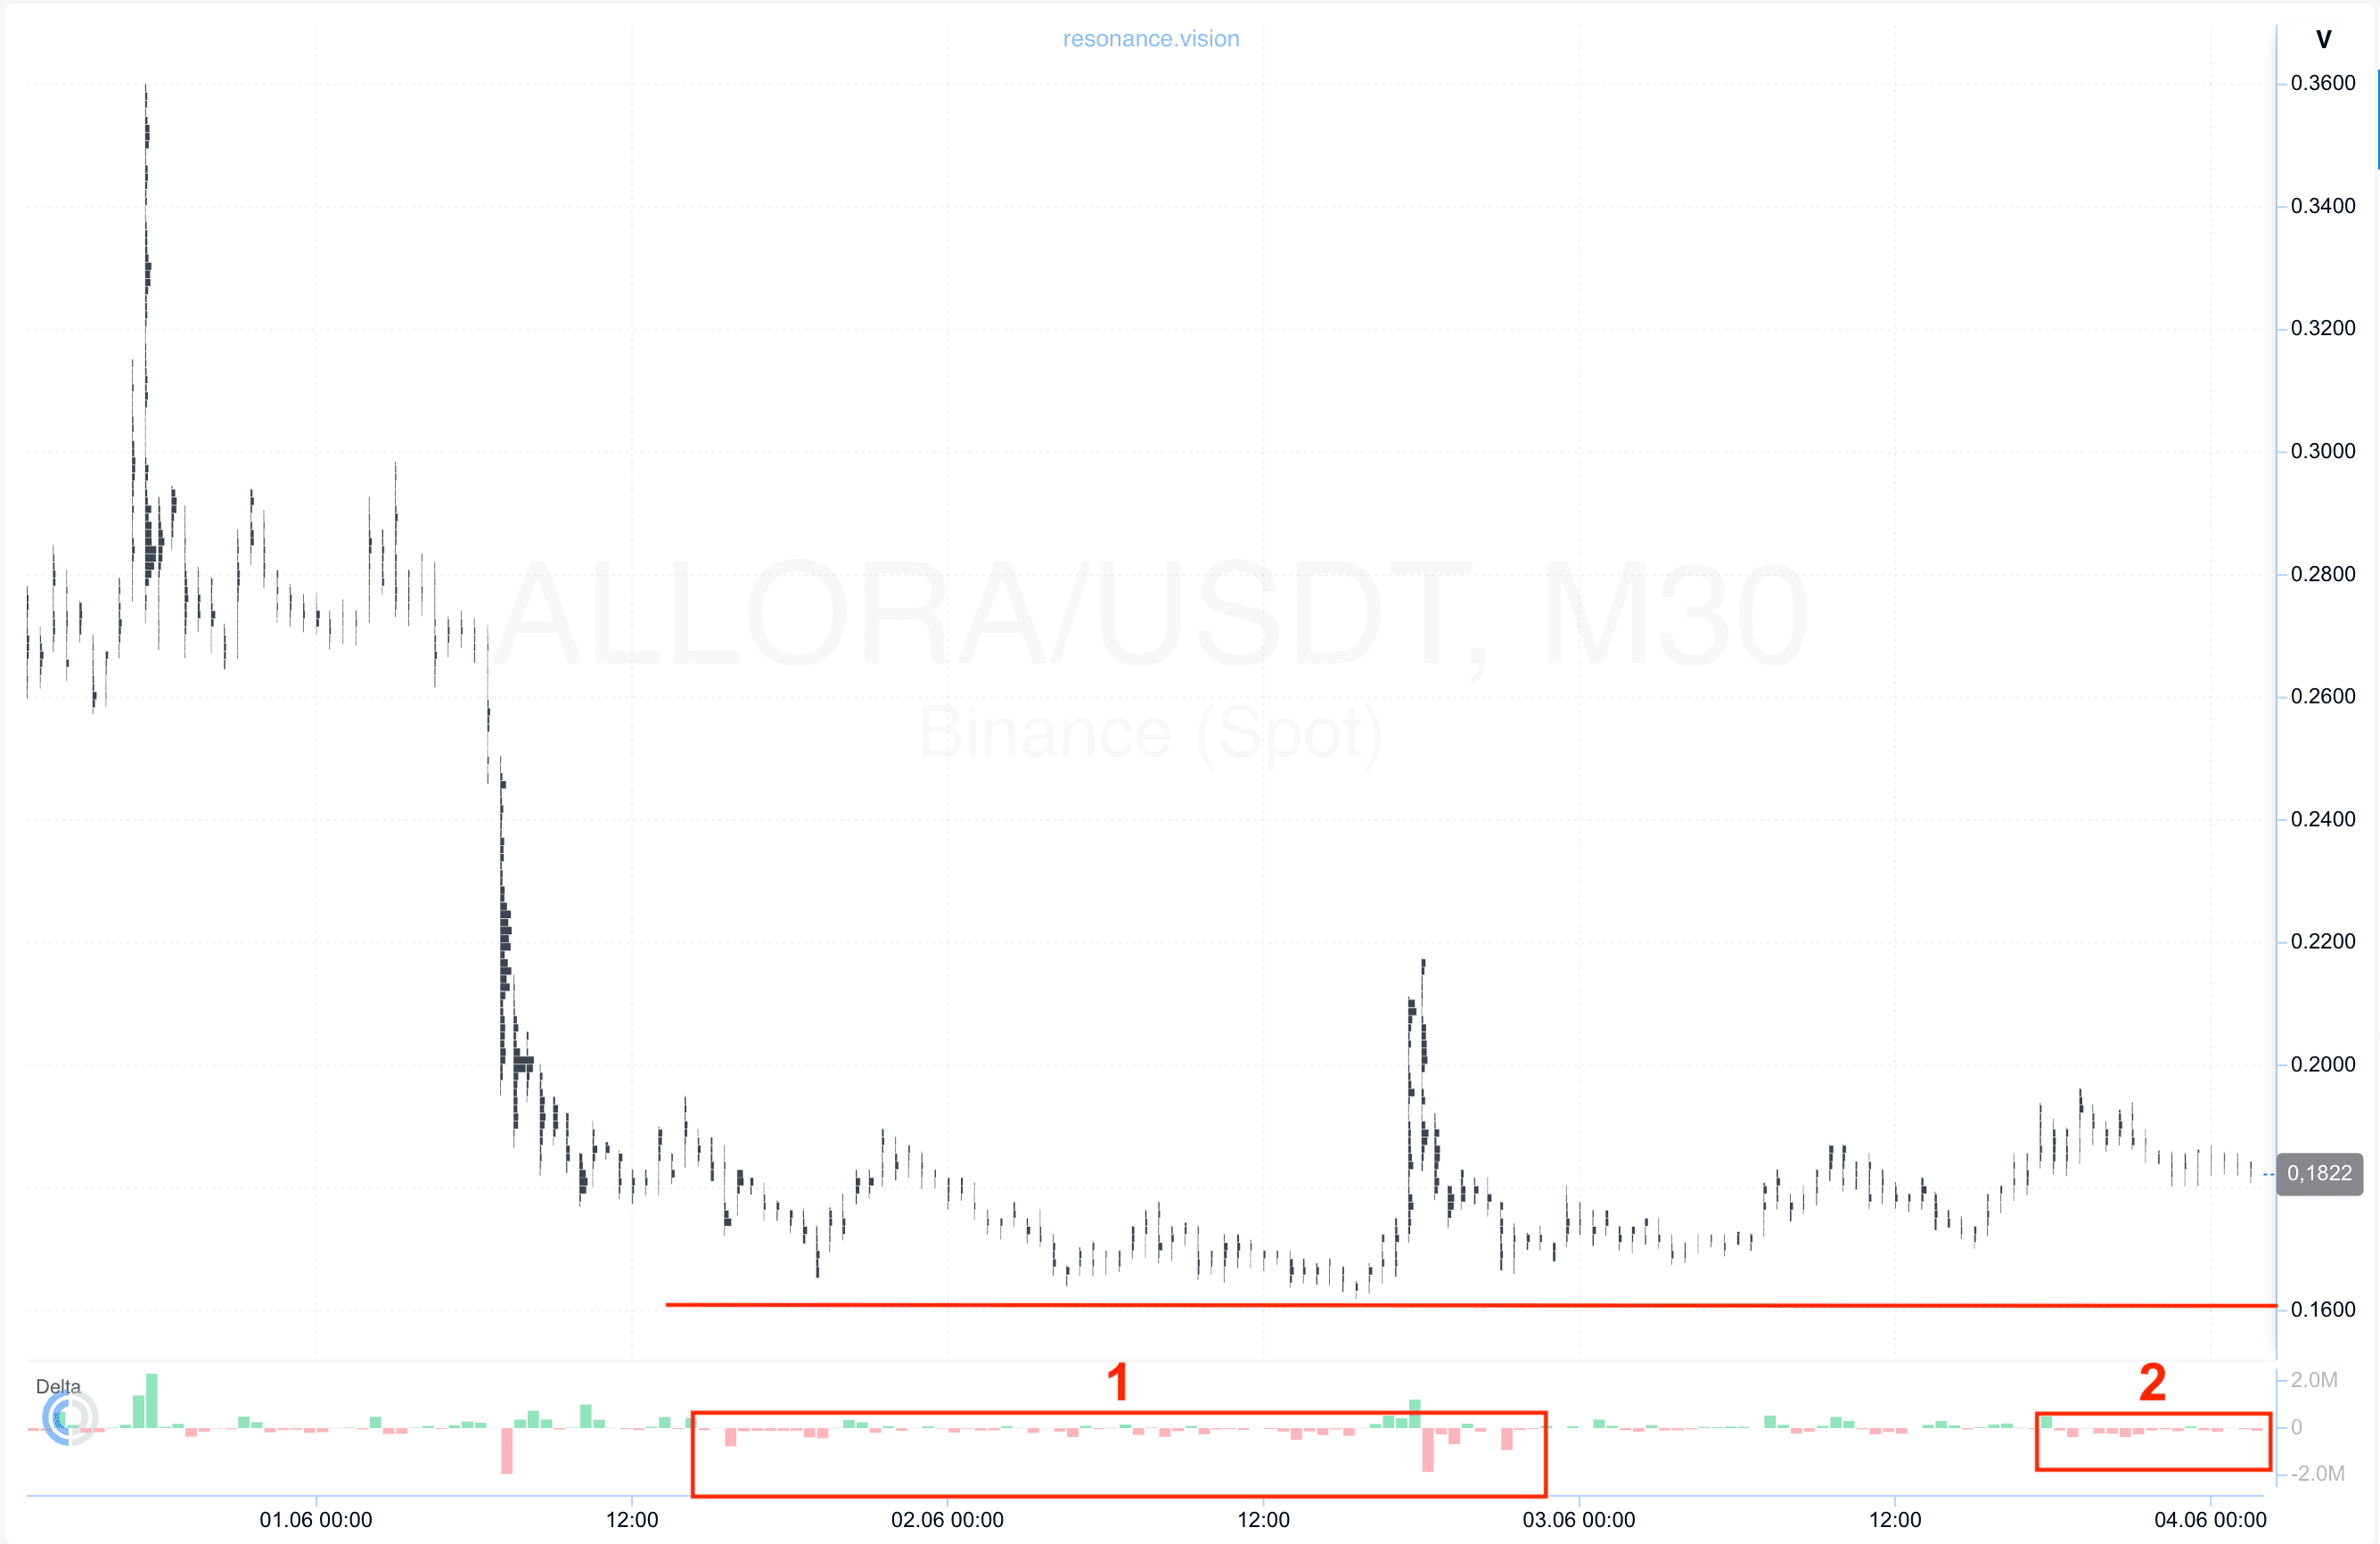
Кластерний графік: у фазі локального бокового руху протягом тривалого часу спостерігалося переважання маркет-ордерів на продаж (червоний прямокутник №1). Незважаючи на постійний тиск з боку продавців, ринок не демонстрував відповідного зниження, що було першою ознакою послаблення їх ініціативи.
Особливу увагу привернула остання ділянка діапазону, де об’єм маркет-продажів знову помітно збільшився (червоний прямокутник №2), проте ціна практично перестала реагувати на цей потік продажів і не змогла оновити локальний мінімум (червона лінія).
Подібне розходження між об’ємом та реакцією ціни є важливим сигналом зміни ринкового балансу. Продавці продовжують витрачати значний об’єм, проте їх вплив на ціну стає менш ефективним. Це говорить про наявність зустрічного попиту, який активно поглинає продажі, що надходять.
Така реакція вказує на формування ознак локального дефіциту: ринок перестає знижуватися навіть при переважанні продажів, що свідчить про послаблення ініціативи продавців та можливий перехід контролю до покупців.
У Дешборді
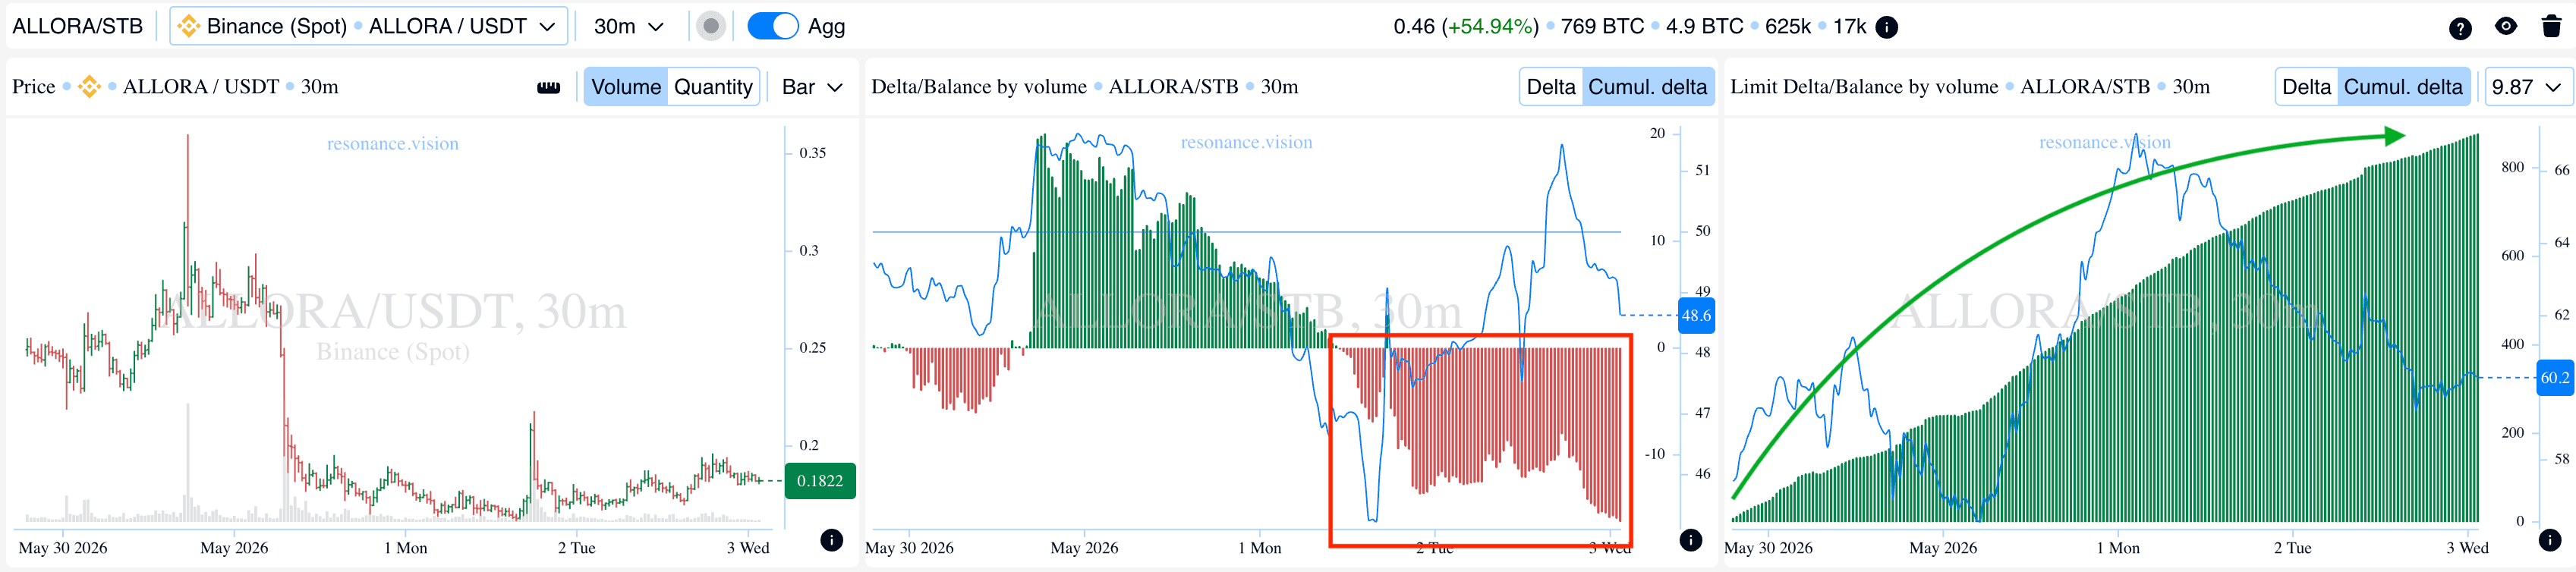
Дельта / Баланс за об’ємом та лімітна дельта: в агрегованому вигляді дані по всіх парах та біржах підтверджують спостереження з кластерного графіка. У аналізований період фіксувався тиск маркет-продажів, що виразно відбивається на гістограмі кумулятивної дельти (червоний прямокутник).
При цьому ціна не демонструвала порівнянної реакцію на даний об’єм продажів, що додатково вказувало про зниження ефективності продавців. Незважаючи на приплив ринкової пропозиції, ринок утримував поточні цінові рівні та не формував нових мінімумів.
Водночас по лімітній дельті спостерігалося виражене збільшення лімітних заявок на купівлю поблизу поточного цінового діапазону (зелений прямокутник). Це говорить про те, що ринковий об’єм продажів, що входить, активно поглинався лімітними покупцями.
Подібна комбінація сигналів вказує на формування локальної підтримки та поступове зміщення балансу у бік покупців. В умовах, коли продаж перестає рухати ціну вниз, ймовірність зміни ініціативи суттєво зростає.
Причини виходу
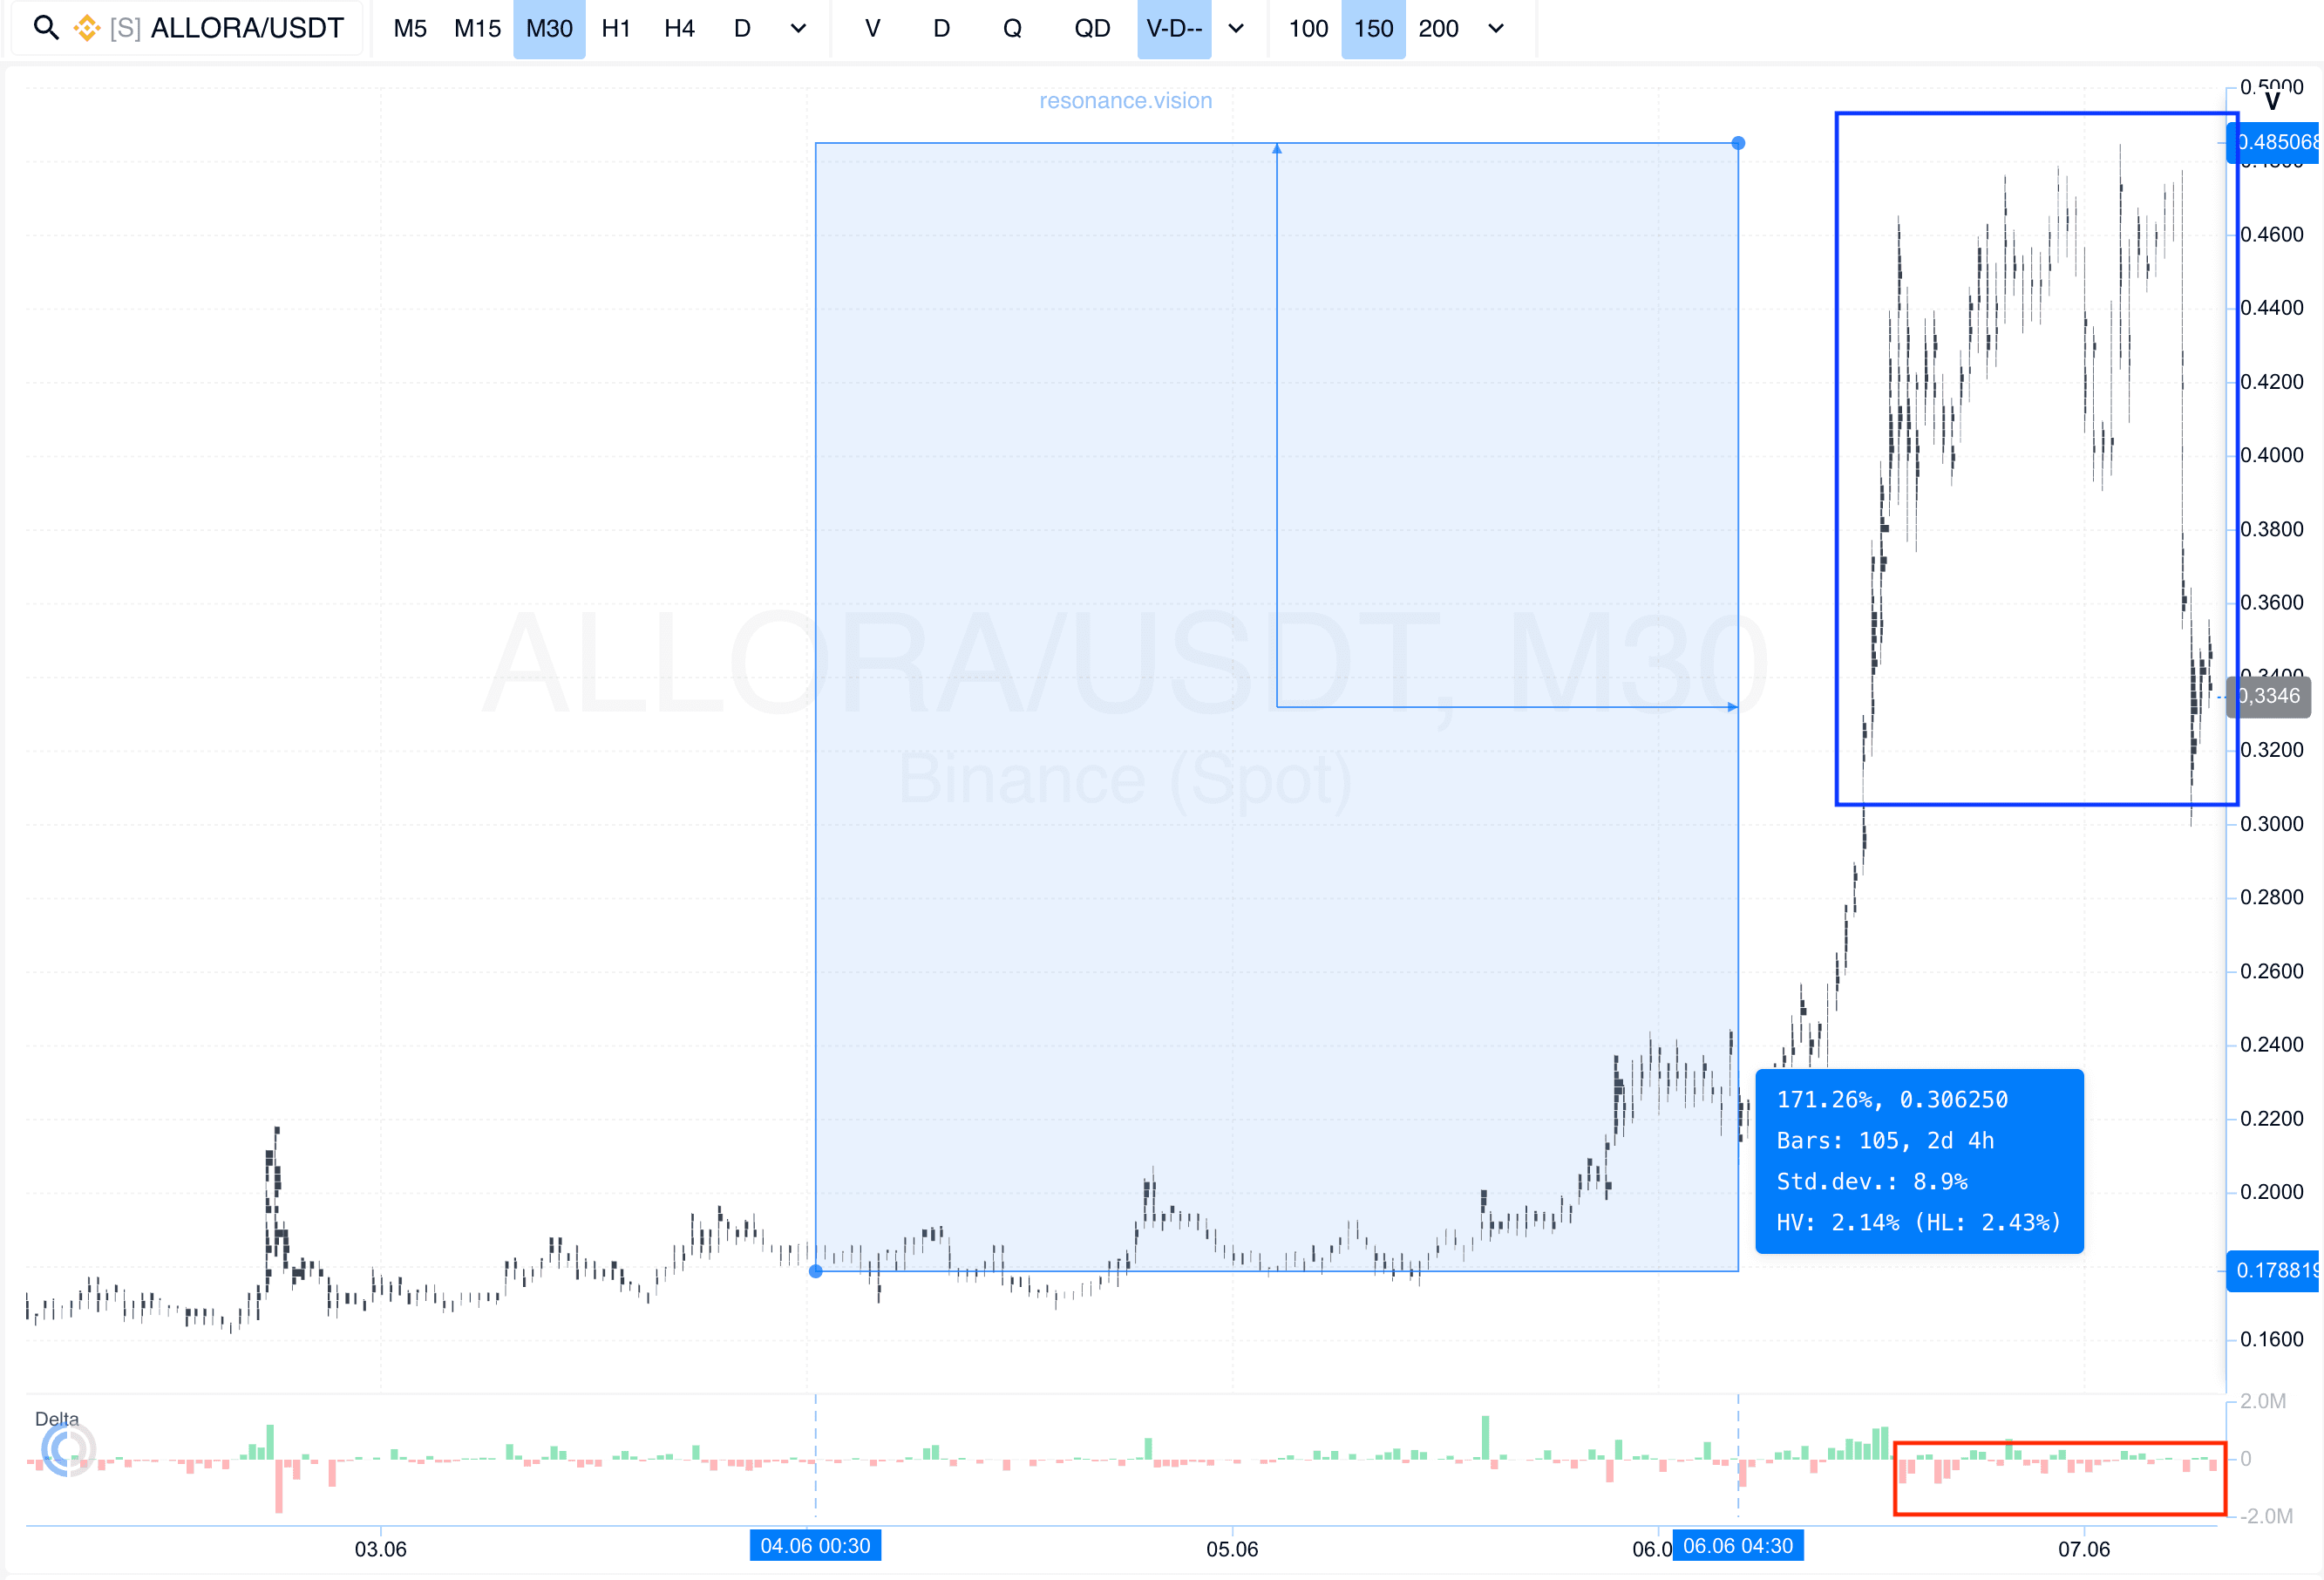
Кластерний графік: після точки входу ціна зросла більш ніж на 170%, сформувавши сильний імпульсний рух та повністю реалізувавши початковий сценарій.
У міру розвитку зростання помітно зросла волатильність, що часто спостерігається на пізніх стадіях трендового руху. Додатково сформувався сильний імпульсний відкат (синій прямокутник), що супроводжувався підвищеною активністю учасників ринку.
Усередині цієї зони проторговки почали переважати маркет-ордери на продаж (червоний прямокутник), а їх вплив на ціну знову сталв ефективним. На відміну від ситуації на вході, продавці вже не зустрічали такого об’єму поглинання та змогли перевести ринок у фазу корекції.
Подібна динаміка свідчить, що ініціатива поступово переходить до продавців, а ринок переходить у фазу пошуку нового балансу. Після такого сильного руху ймовірність тривалої консолідації або глибшої корекції суттєво зростає.
У разі появи таких ознак подальше утримання позиції супроводжується помітним зростанням ризиків. Тому фіксація прибутку у цій зоні виглядала найбільш раціональним і виваженим рішенням з погляду управління позицією.
Висновок
Цей розбір наочно демонструє, наскільки важливо аналізувати не сам об’єм, а й його фактичний вплив на ціну. Саме оцінка ефективності дій учасників ринку дозволяє виявляти зміни балансу попиту та пропозиції ще до формування очевидного цінового руху.
На етапі входу ринок був під стійким тиском маркет-продавців. . Це вказувало зниження ефективності продавців і активне поглинання їх об’єму лімітними заявуками на покупку. Додатковим підтвердженням виступало зростання лімітних заявок на купівлю, що свідчить про формування локальної підтримки та поступове зміщення балансу у бік покупців.
Після входу ринок реалізував сильний висхідний рух, продемонструвавши зростання більш ніж на 170%. Проте з розвитком тренду почали з’являтися ознаки зміни ринкової структури. Волатильність помітно зросла, сформувався імпульсний відкат, а маркет-продажі знову почали ефективно впливати на ціну. Це свідчило про повернення ініціативи до продавців та переходу ринку у фазу пошуку нового балансу.
Таким чином, вхід у позицію був заснований на ознаках локального дефіциту та неефективності продавців, а вихід на відновленні їх ефективності та зростанні ймовірності глибшої корекції. Подібний підхід дозволяє приймати торговельні рішення на основі об’єктивної оцінки взаємодії об’єму та ціни, що робить роботу з ринком більш системною та підвищує якість результатів на дистанції.
Стеж за новими статтями у нашому телеграм каналі.
Не треба вигадувати складних схем та шукати “грааль”. Використовуйте інструменти платформи Resonance.
Реєструйся за посиланням - отримуй бонус і починай заробляти:
OKX | BingX | KuCoin.
Промокод TOPBLOG дає тобі 10% знижки на будь-який тарифний план Resonance.
Рекомендовані статті


