TST +71.3% (Resonance Directional Strategy)
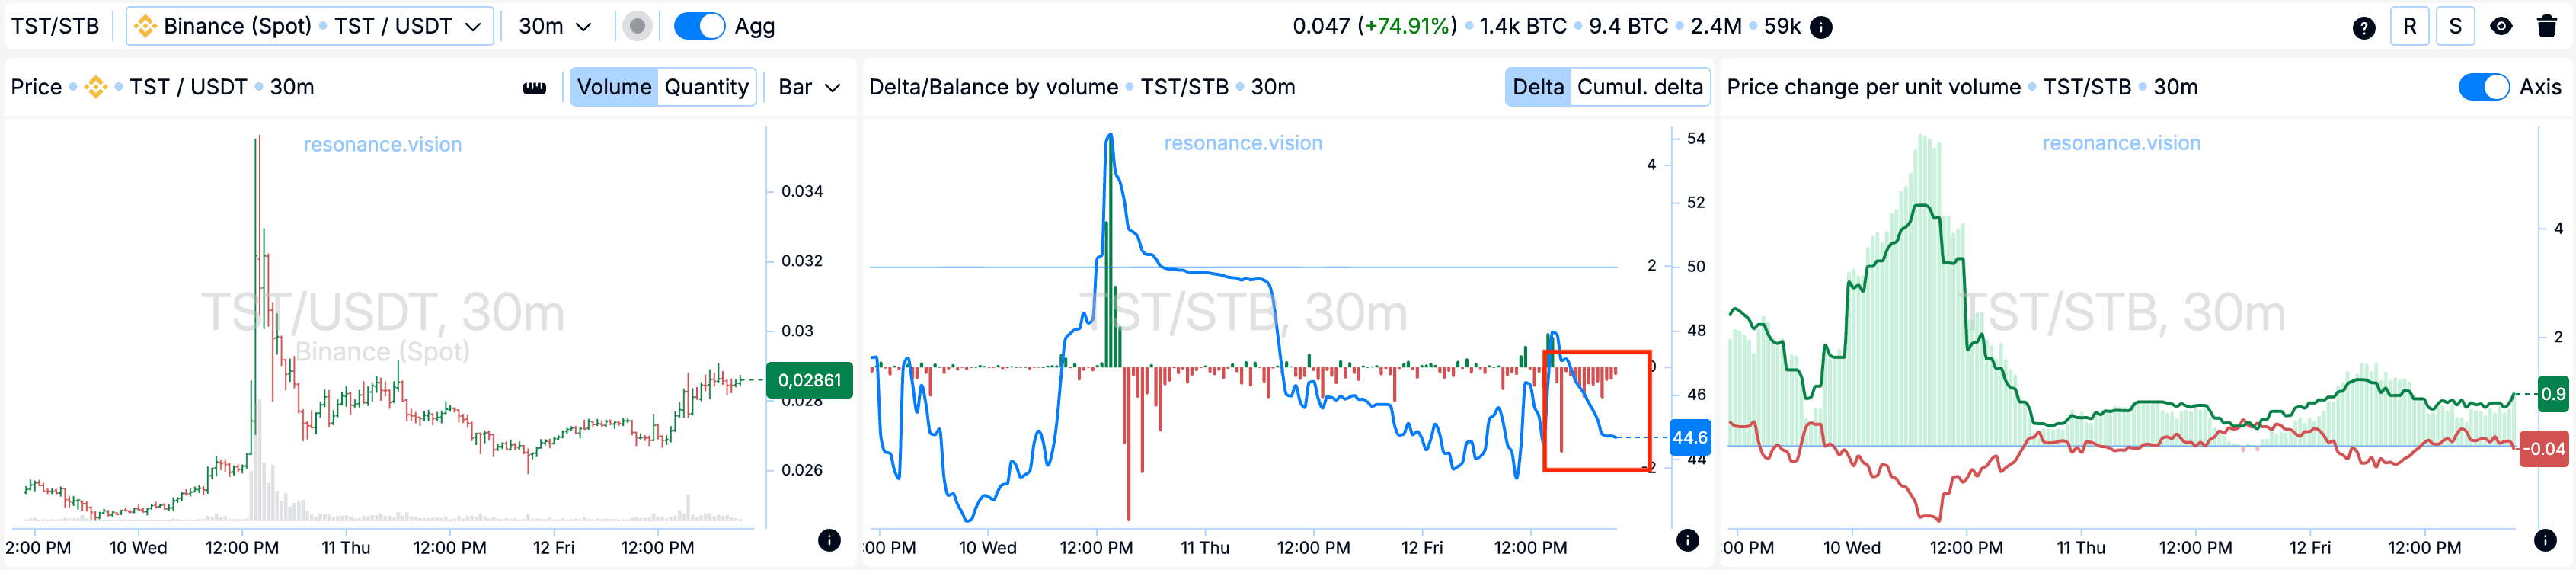
📊 The TST/USDT trade demonstrated how cluster analysis can help identify strong entry points. Despite the prevailing selling pressure, selling pressure eased, and the price held and gradually rose, indicating a localized shortage.
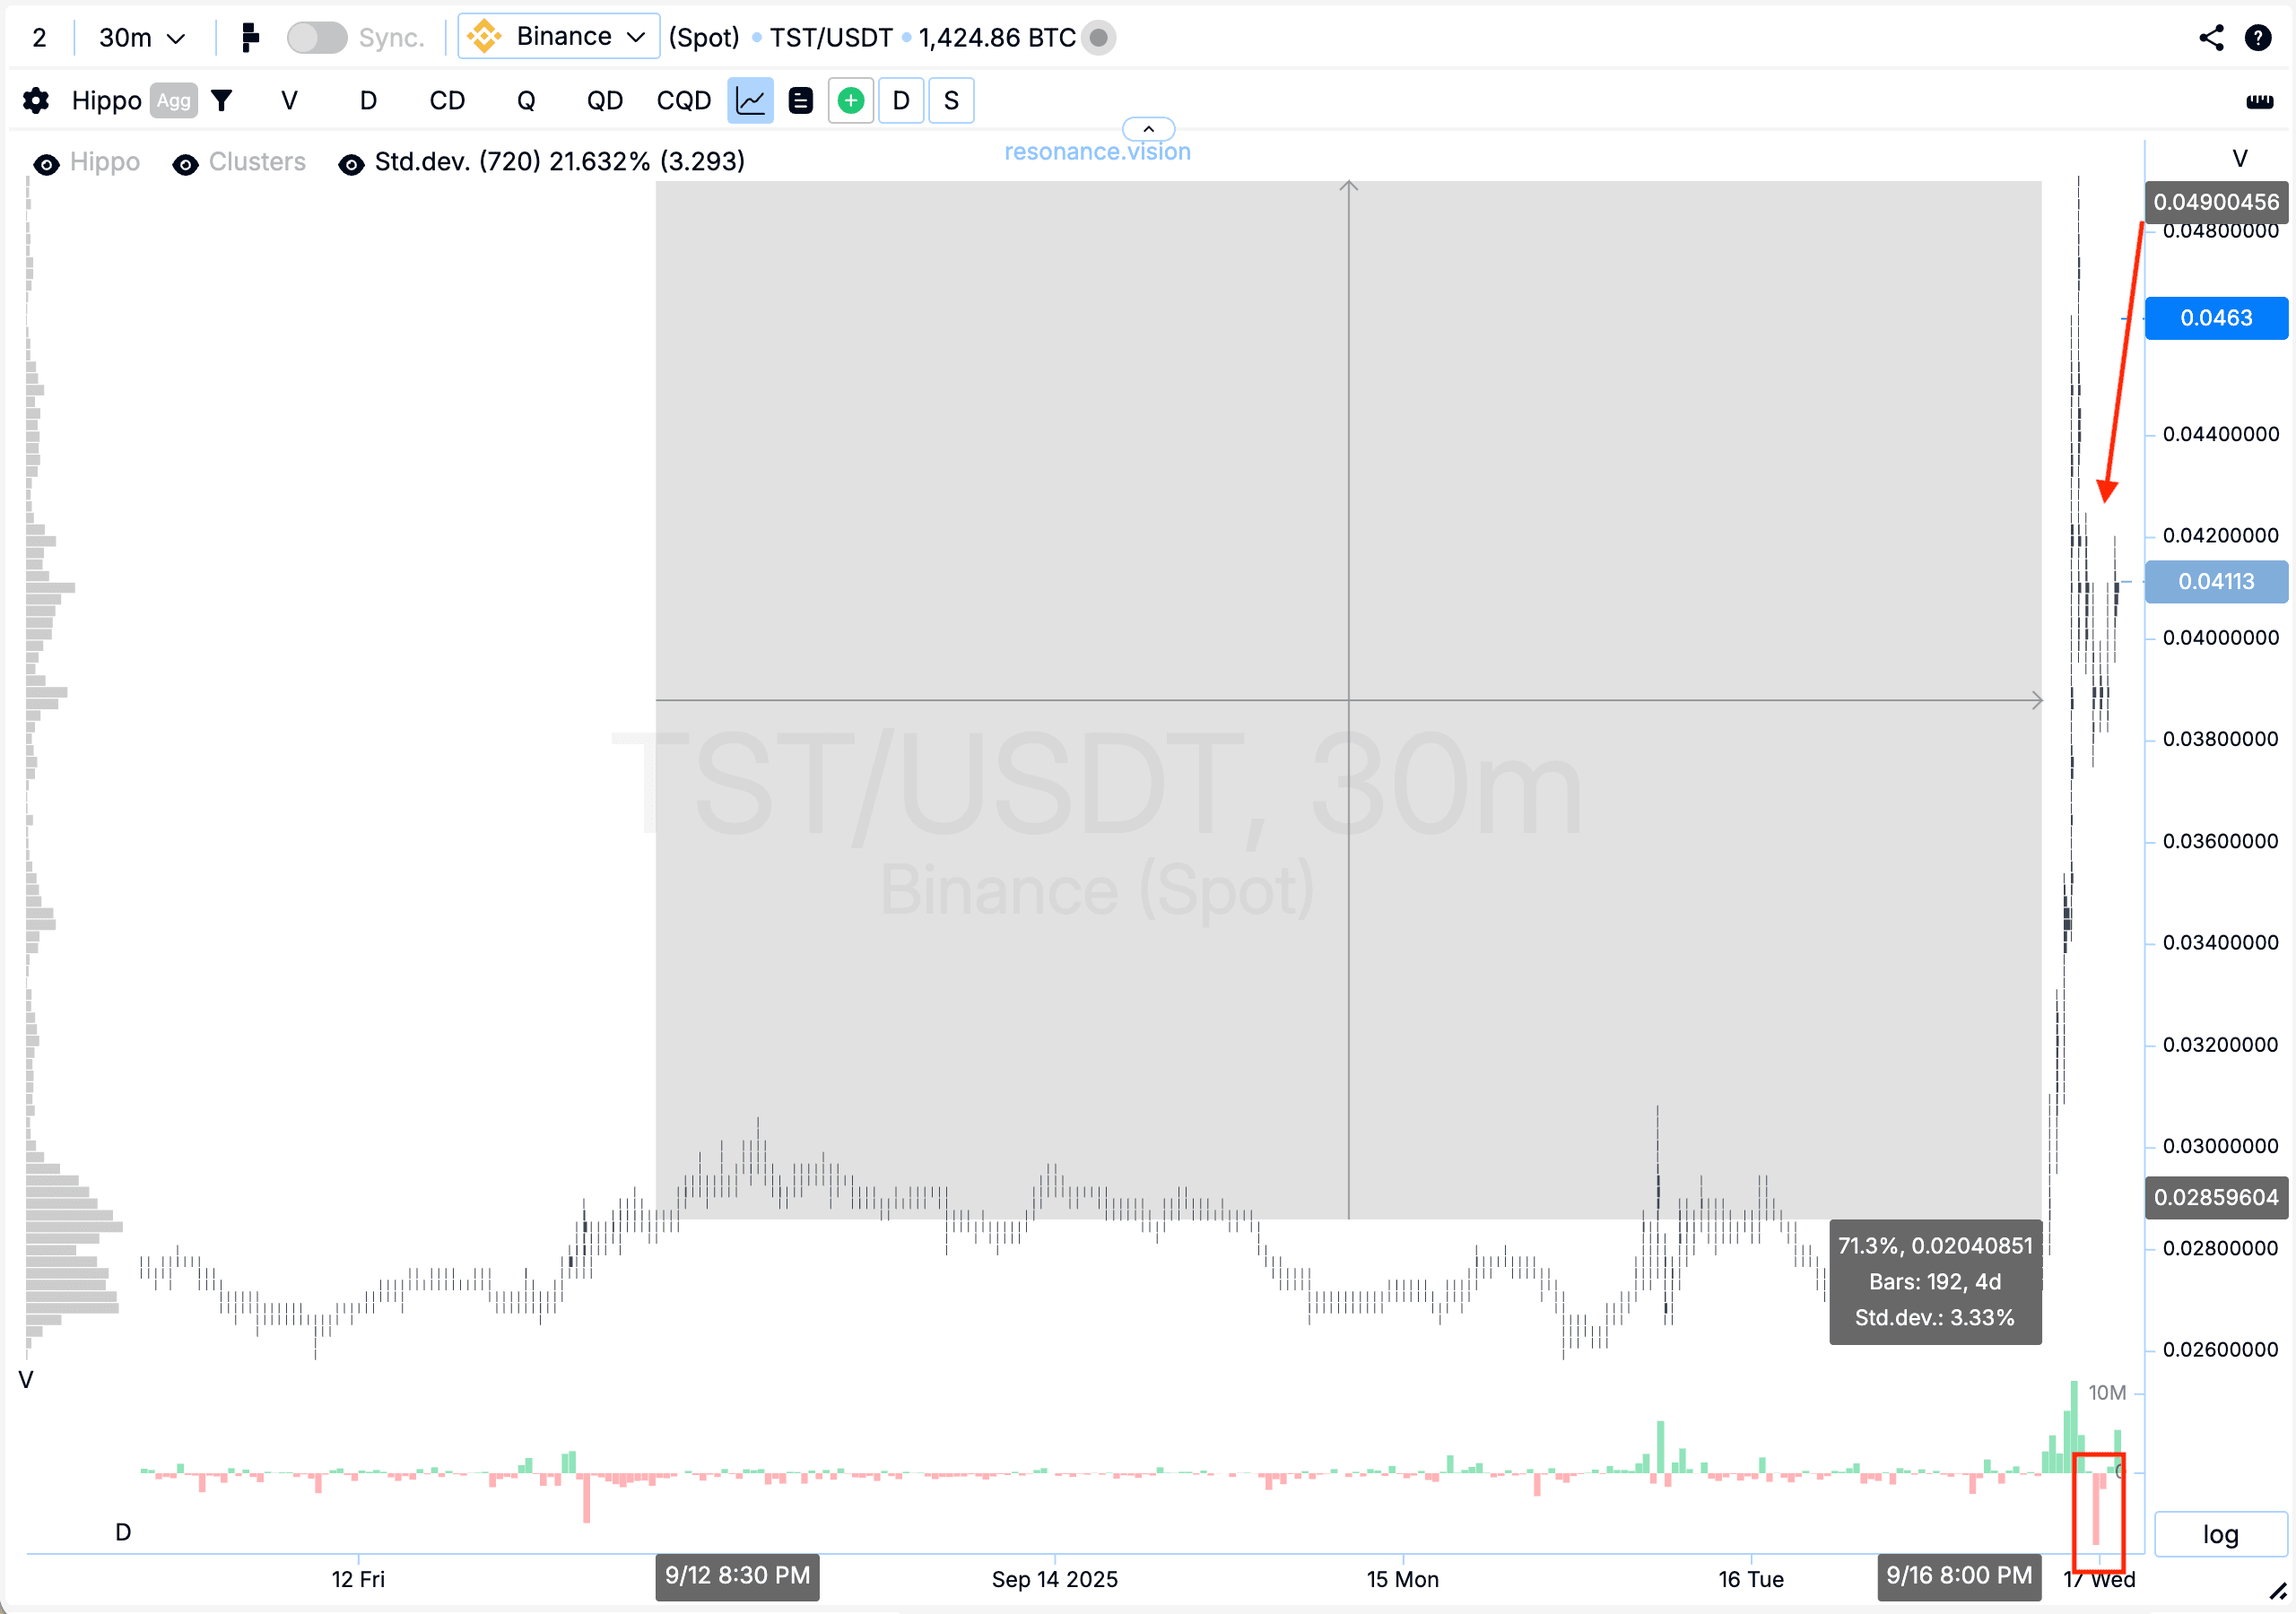
💡 The final move exceeded 70%, after which a pullback began—a signal to take profits and reduce risk.
Table of contents

Coin: TST/USDT
Risk: High
Skill Level: Beginner
Entry Reasons
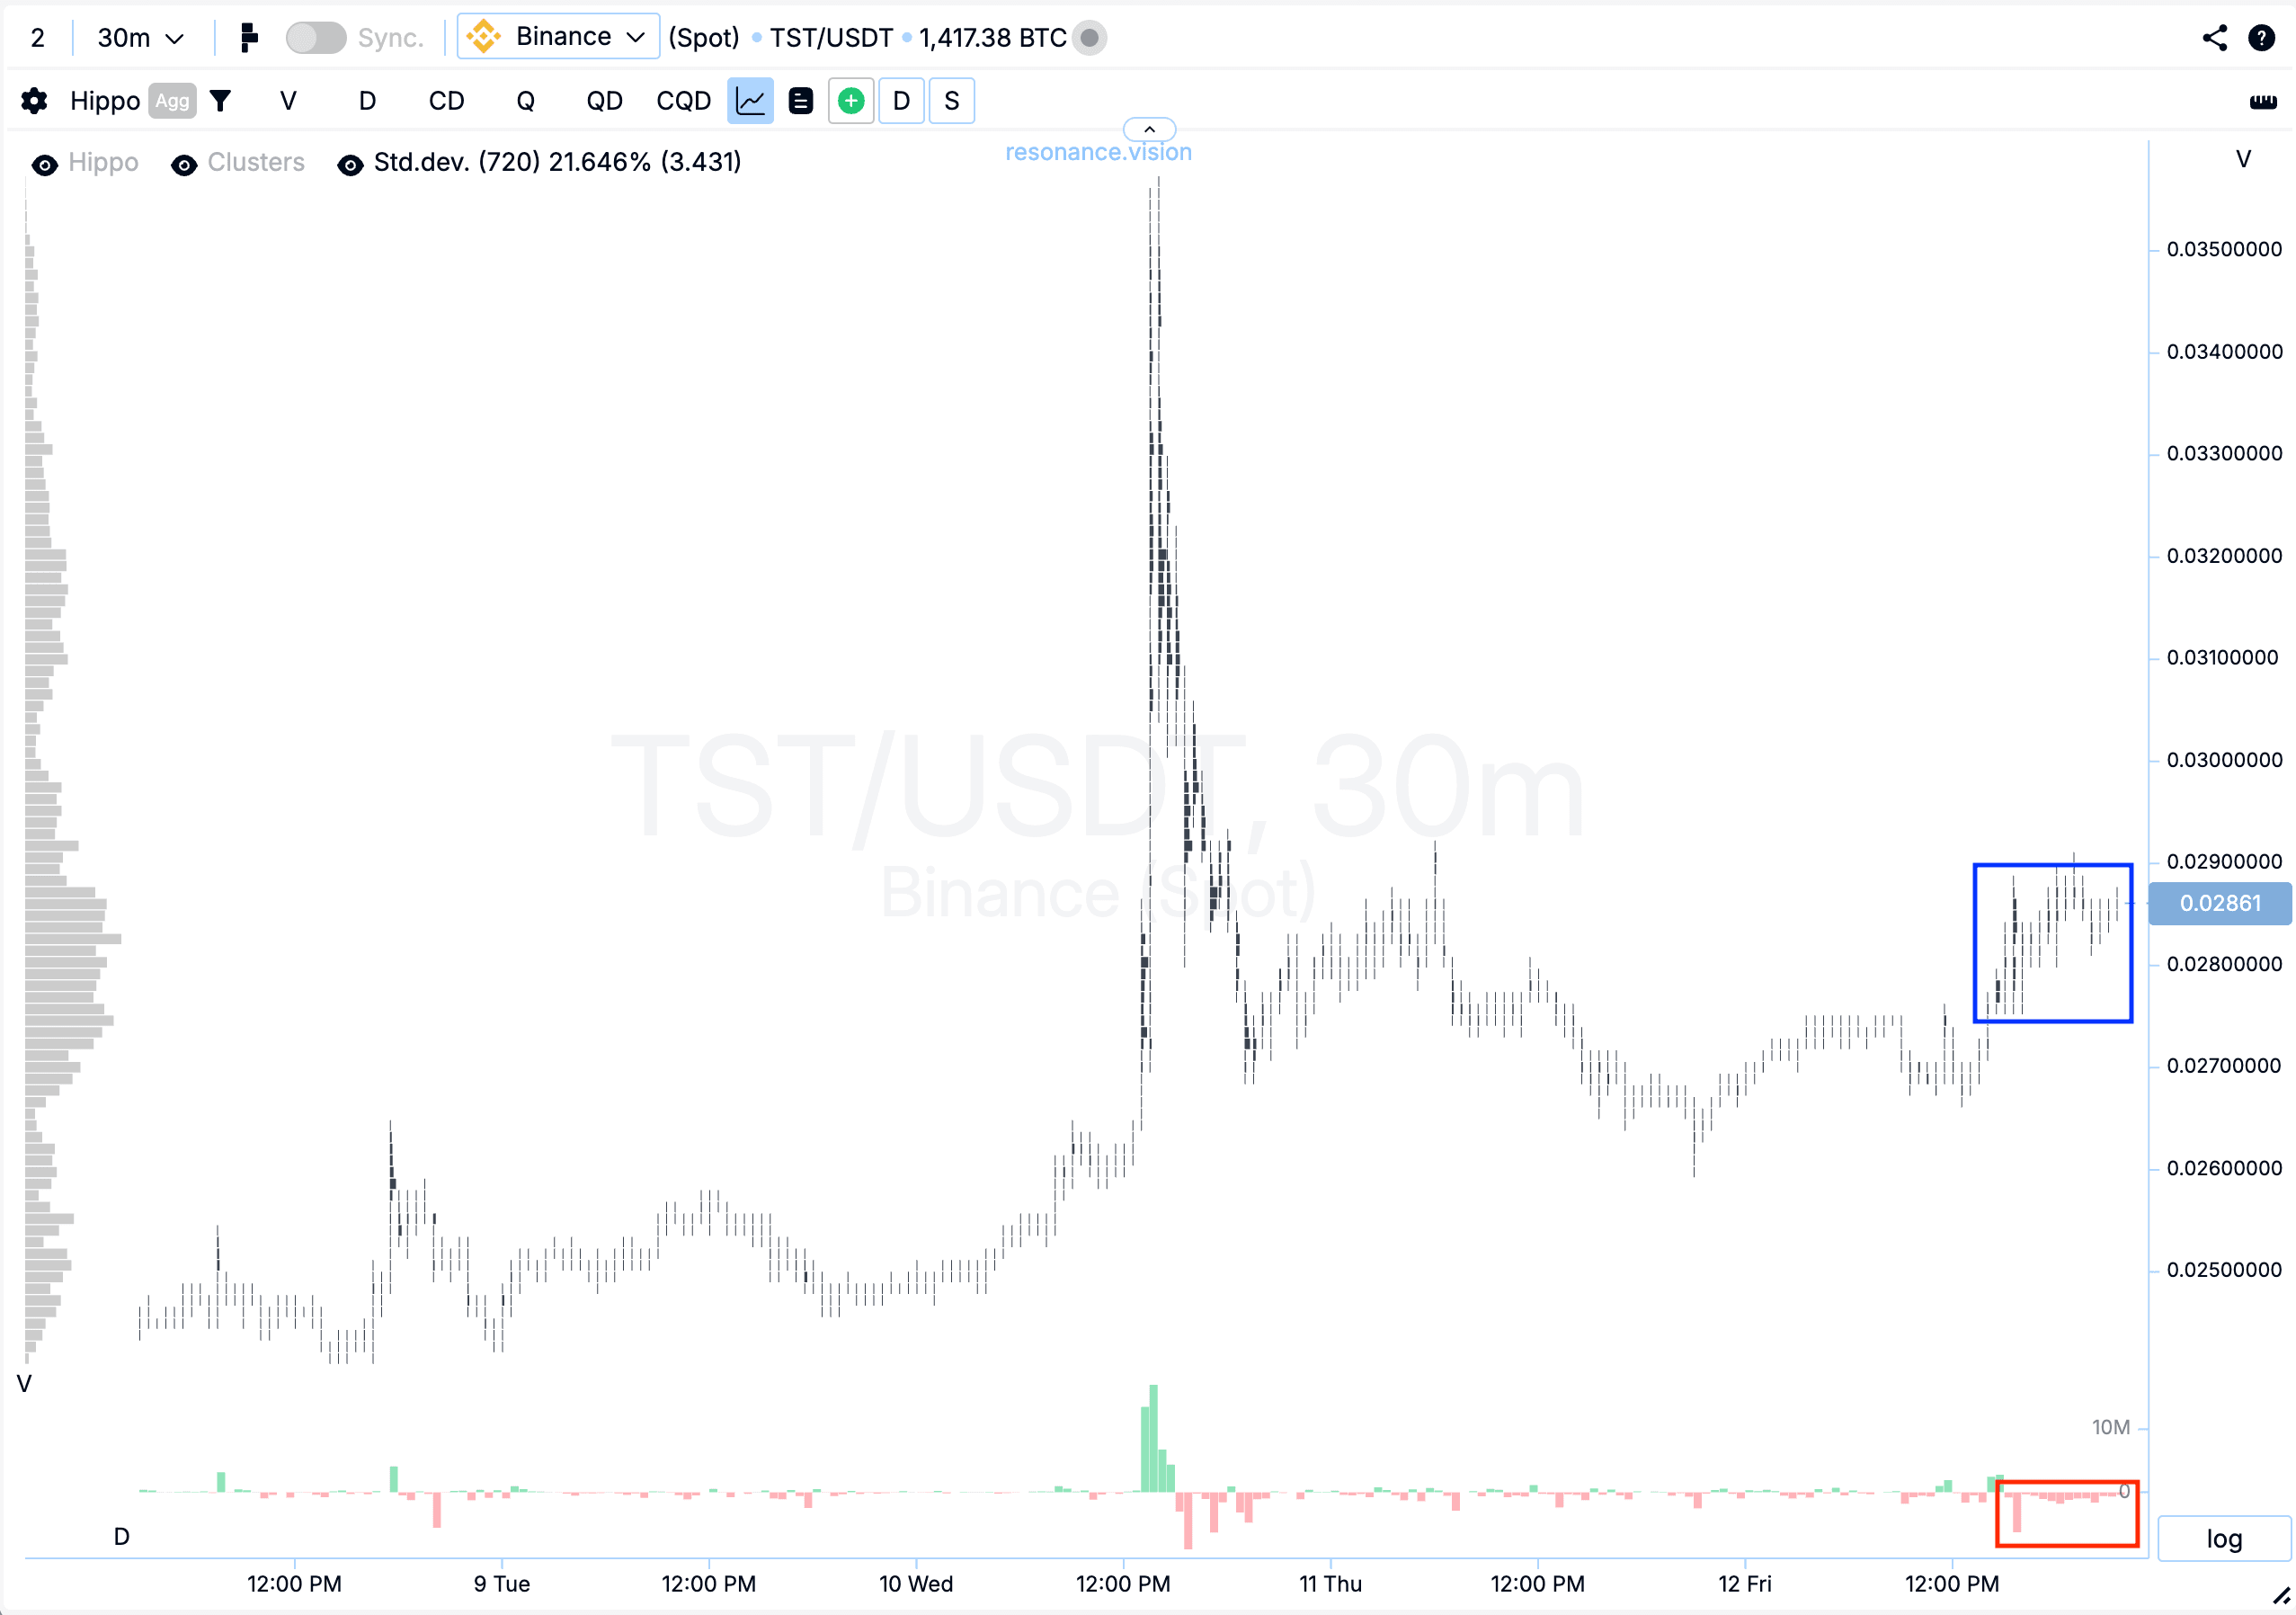
Cluster Chart: After the pullback, large volume clusters started to form (blue rectangle). These clusters showed a dominance of selling (red rectangle), but they didn’t put significant pressure on price. Instead, the price gradually moved upward, pointing to continued buyer interest and the potential formation of a local deficit.
On the Dashboard
Delta/Volume Balance: Aggregated data confirmed the observations from the cluster chart. Despite the dominance of selling and balance shifting in their favor, the price did not show a meaningful decline. Moreover, the selling volumes were gradually decreasing (red rectangle), which further indicated weakening seller pressure and increased the probability of a local deficit forming.
Exit Reasons
Cluster Chart: After a strong price move of more than 70%, a significant pullback formed (red arrow). In such conditions, fixing the position becomes the rational choice, since the likelihood of correction increases and holding further carries higher risk.
Conclusion
This trade clearly shows how, even with obvious selling dominance, the price can remain stable and display signs of a local deficit. These moments create opportunities for entries with growth potential.
On the exit, the key factor was a strong +70% impulse followed by a pullback — a signal that buyers were beginning to lose initiative and the risk of holding sharply increased.
This approach underlines the importance of discipline: it’s not only about finding entry points through cluster analysis and aggregated data, but also about timely profit-taking to preserve gains and minimize risk.
Follow new insights in our telegram channel.
No need to invent complex schemes and look for the “grail”. Use the Resonance platform tools.
Register via the link — get a bonus and start earning:
OKX | BingX | KuCoin.
Promo code TOPBLOG gives you a 10% discount on any Resonance tariff plan.
Recommended articles