XLM +21.29% (Напрямкова стратегія Resonance)

Розбір угоди через кластерний аналіз та дельту: як неефективність маркет-продажів сформувала точку входу, а відновлення тиску продавців стало сигналом до фіксації прибутку.
Зміст

Монета: XLM/USDT
Ризик: середній
Рівень розуміння: новачок
Причини входу
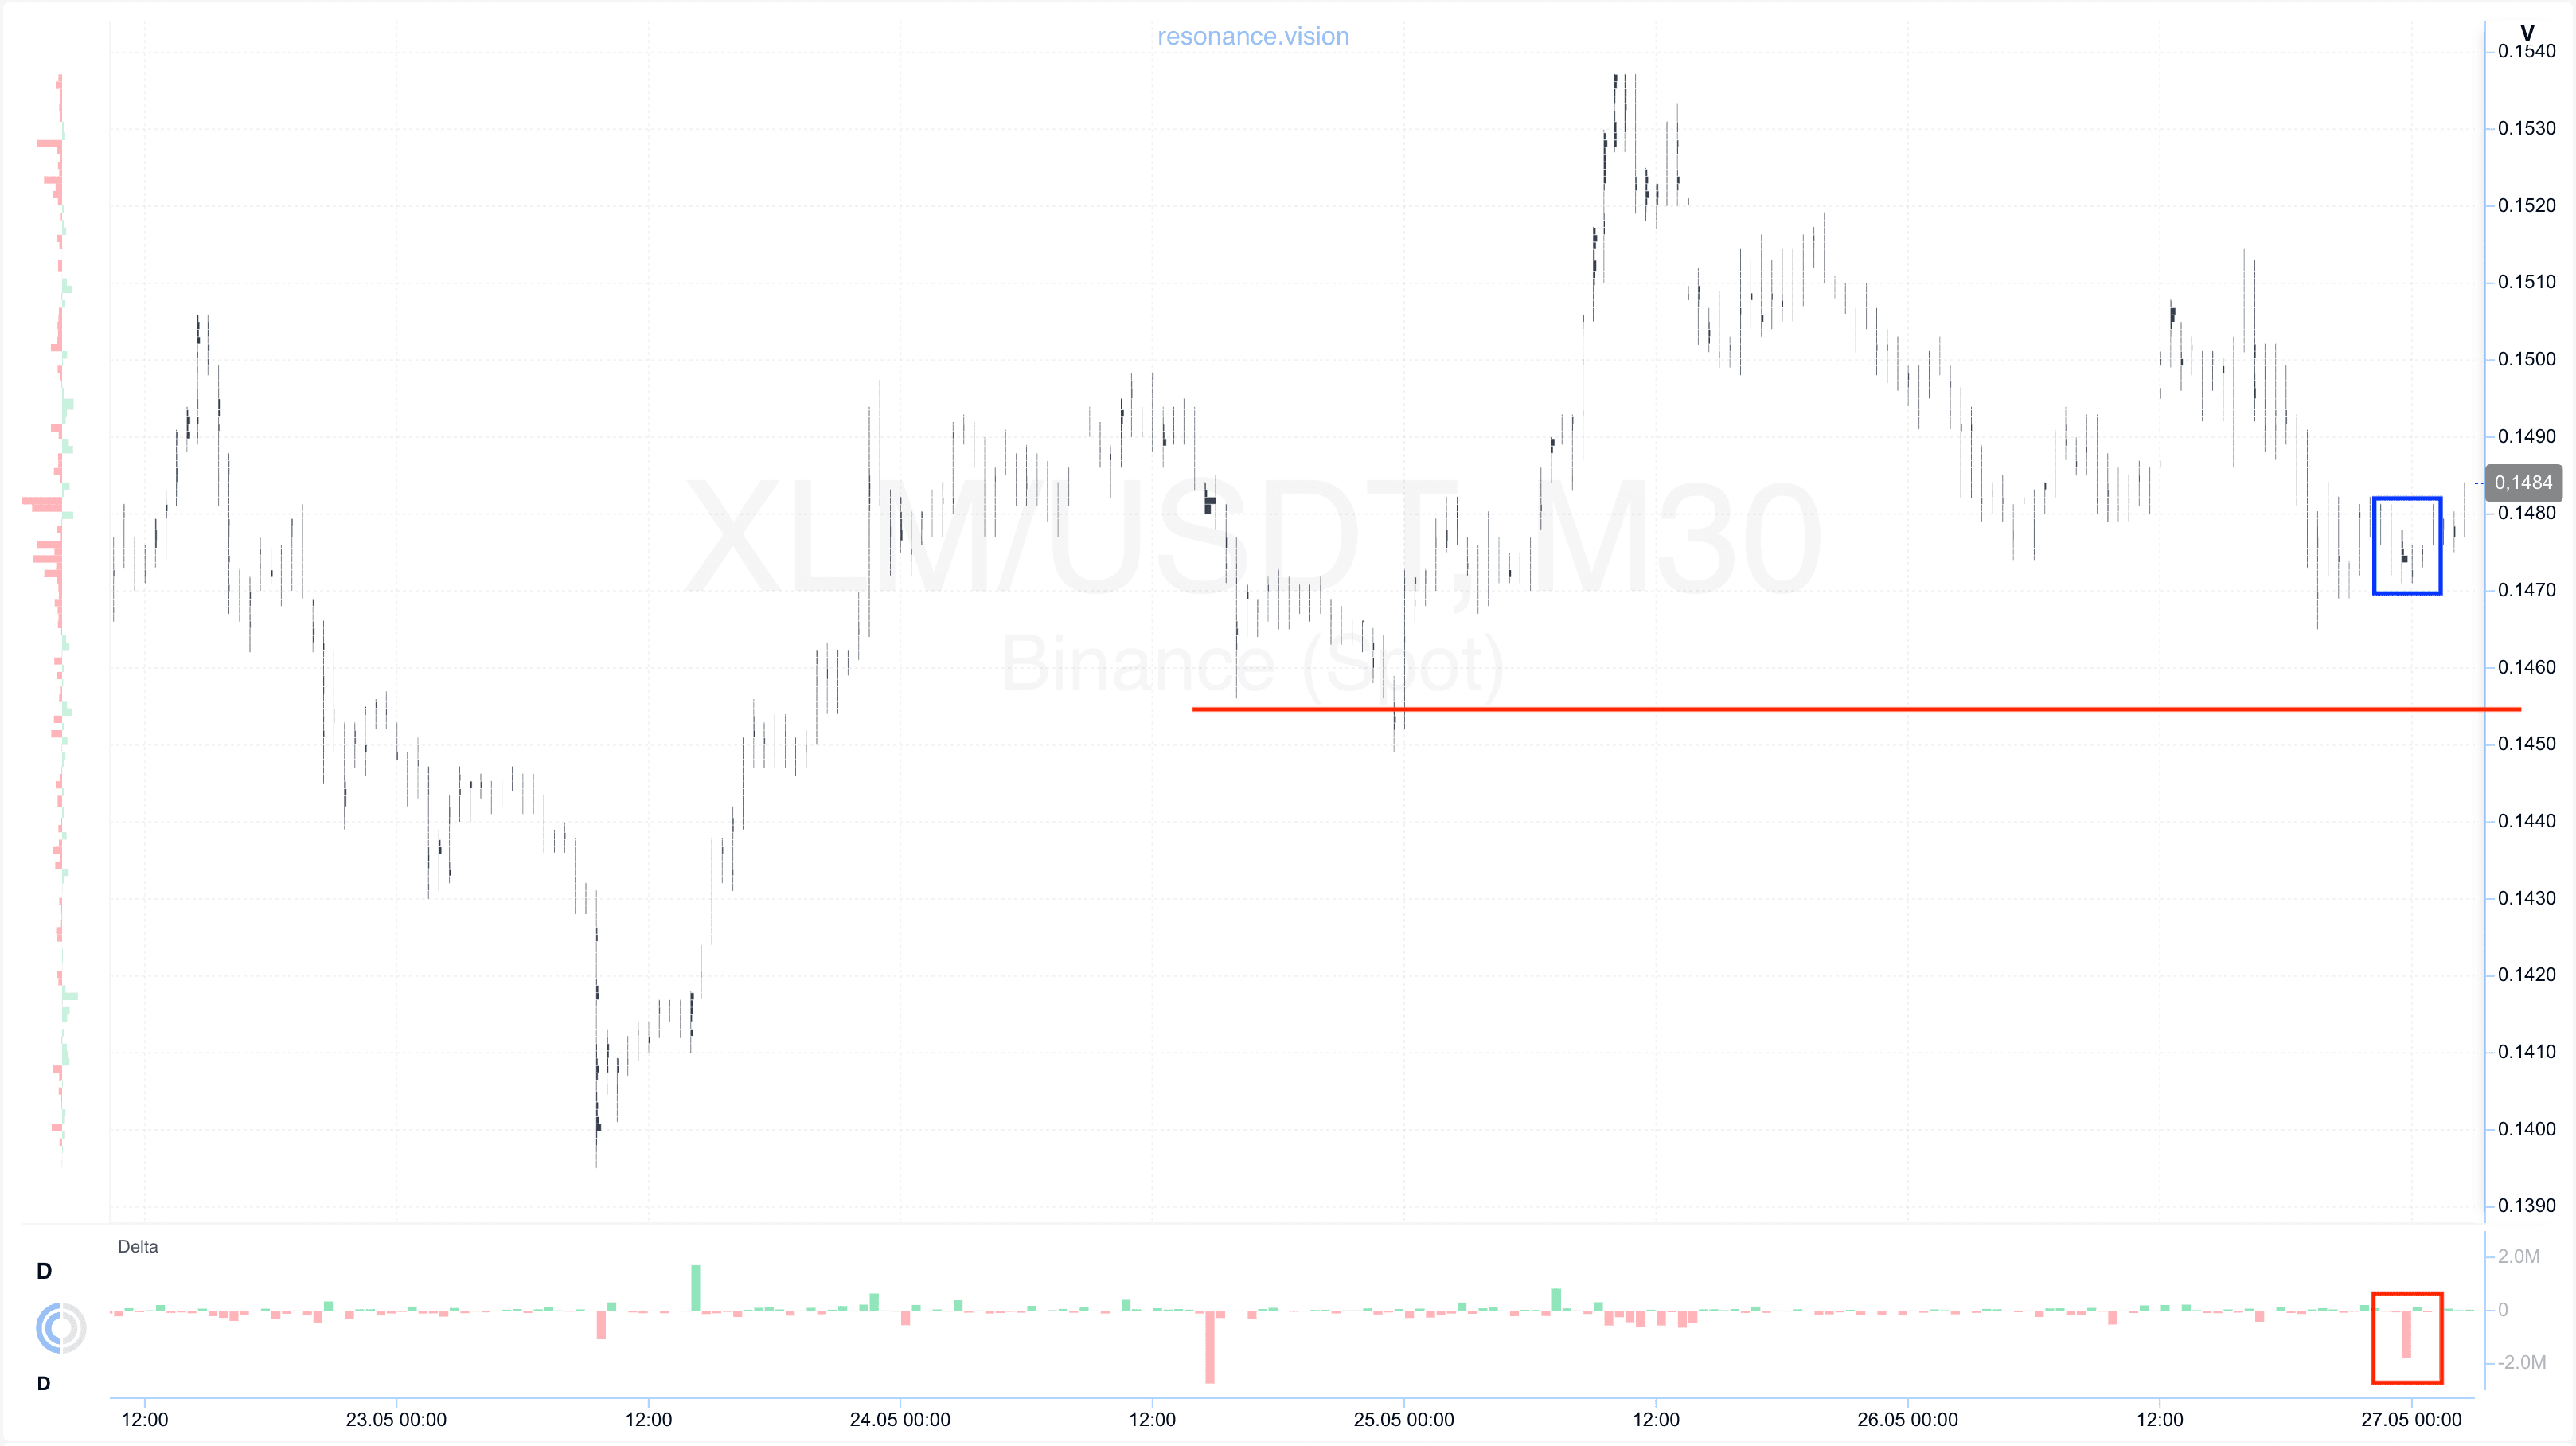
Кластерний графік: на локальному відкаті сформувався бар із великими об’ємними кластерами (синій прямокутник). Ці об’єми супроводжувалися вираженим переважанням маркет-ордерів на продаж (червоний прямокутник).
Однак, незважаючи на домінування продажів, ціна не продемонструвала значного зниження та не змогла оновити локальний мінімум (червона лінія).
Подібна реакція вказує на формування ознак локального дефіциту: ринок перестає знижуватися навіть при переважанні продажів, що свідчить про послаблення ініціативи продавців та можливе зміщення балансу у бік покупців.
Додатково важливо відзначити, що продавці продовжували витрачати значний об’єм, проте їх вплив на ціну ставав менш ефективним. Подібна структура часто свідчить про наявність сильного попиту з боку лімітних заявок.
У Дешборді
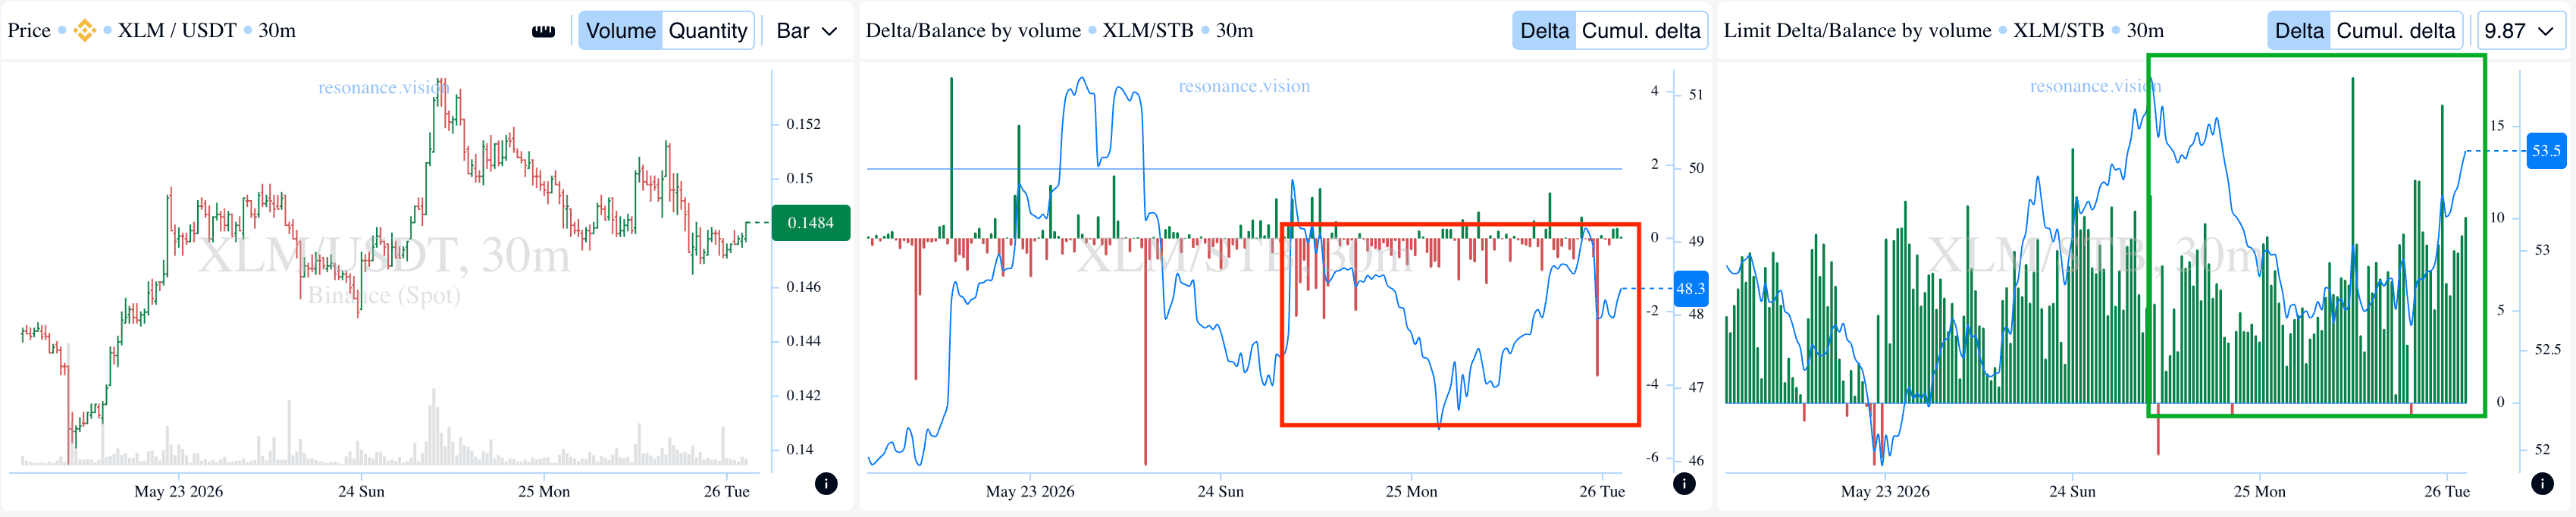
Дельта / Баланс за об’ємом та лімітна дельта: в агрегованому вигляді дані по всіх парах та біржах підтверджують спостереження з кластерного графіка. У аналізований період фіксувалося тривале посилення тиску маркет-продажів, що виразно відбито на гістограмі дельти. У цьому крайні значення продажів продовжували збільшуватися (червоний прямокутник).
Одночасно з цим за лімітною дельтою спостерігалося переважання лімітних заявок на купівлю, а в останній ділянці руху вони стали ще більш вираженими (зелений прямокутник).
Така комбінація вказує на активне поглинання ринкового об’єму продажів, що входить, лімітними заявками на купівлю. В результаті формується локальна підтримка в поточному діапазоні, що додатково підтверджує ознаки дефіциту пропозиції та поступове усунення балансу у бік покупців.
Додатковим фактором є те, що агресивні продажі продовжують бути присутніми на ринку, проте перестають призводити до оновлення ціни. Це посилює можливість формування локального розвороту.
Причини виходу
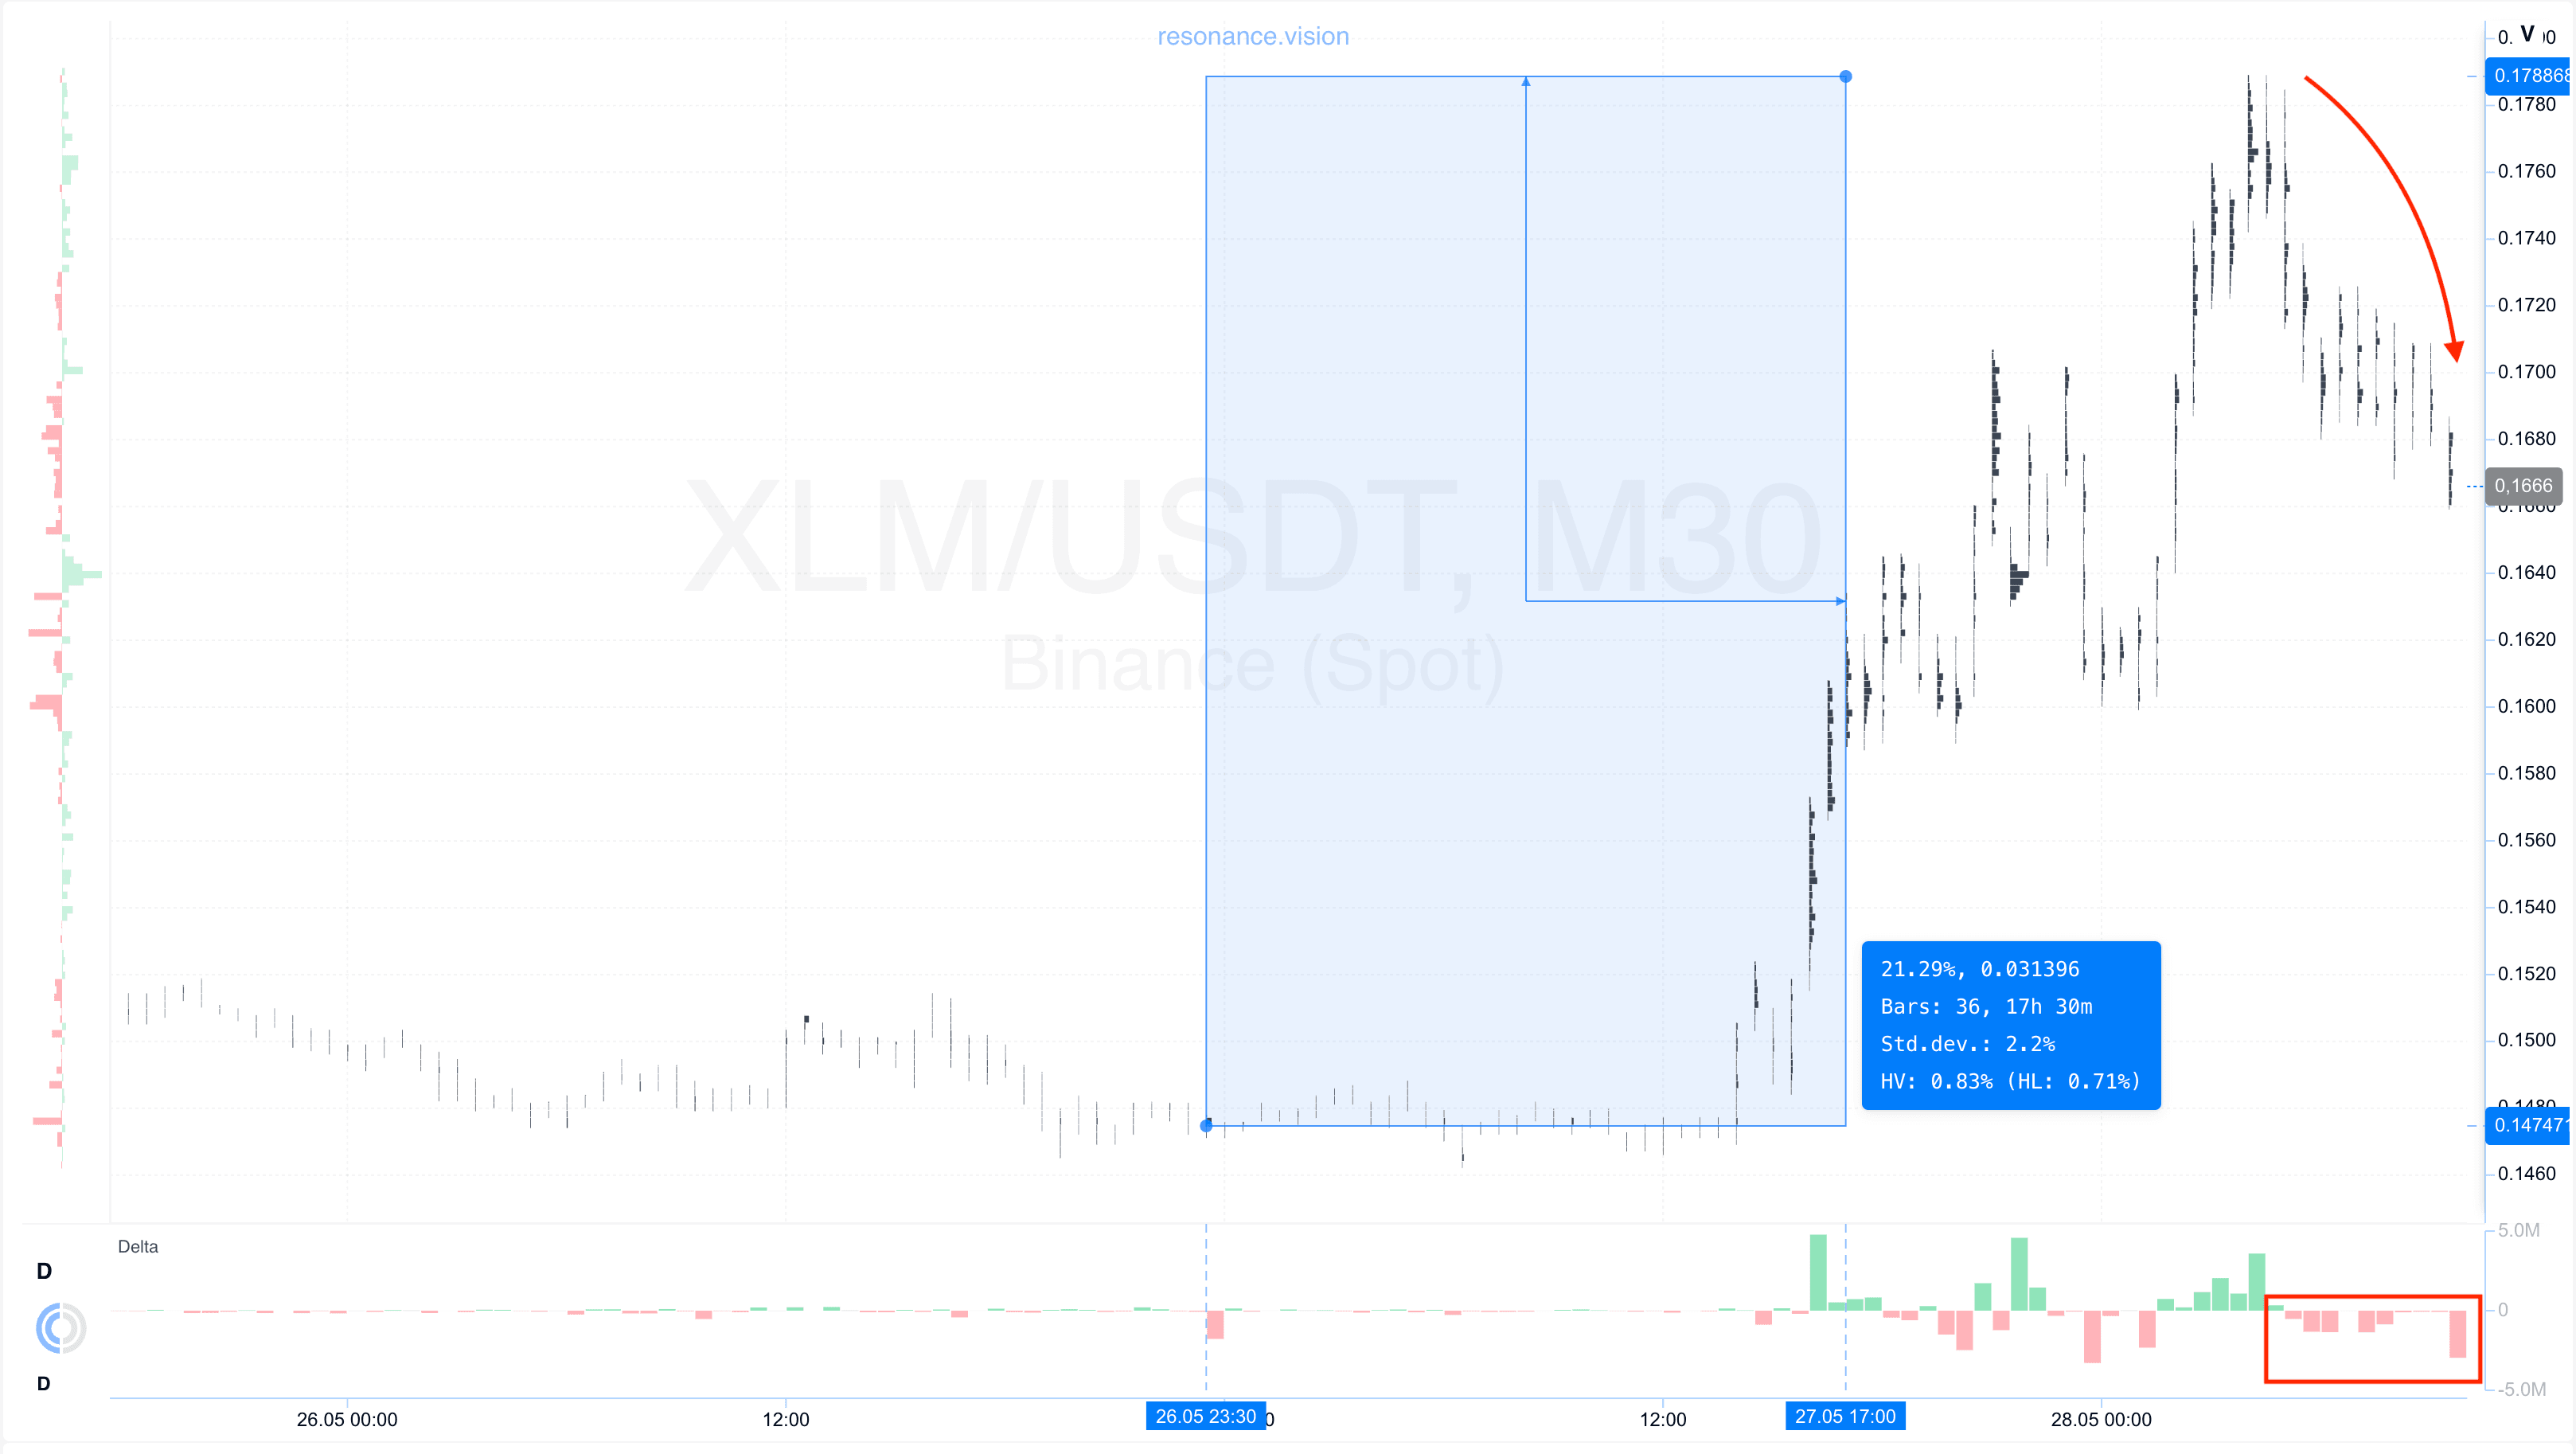
Кластерний графік: після точки входу ціна зросла більш ніж на 20%, сформувавши впевнений локальний рух.
У міру розвитку зростання суттєво збільшилася волатильність, що вказувало на розширення ринкової активності та поступове посилення боротьби між учасниками.
Одночасно з цим почали переважати маркет-ордери на продаж, а актив перейшов у фазу плавного та послідовного зниження (червоний прямокутник та стрілка). На відміну від ситуації на вході, у цьому випадку продажі вже почали ефективно впливати на ціну та призводити до її зниження.
Подібна динаміка вказує на відновлення ініціативи продавців та зростання ймовірності глибшої корекції.
У разі появи таких ознак подальше утримання позиції супроводжується зростанням ризиків. Тому фіксація прибутку у цій зоні виглядала раціональним і виваженим рішенням з погляду управління позицією.
Висновок
Цей аналіз наочно демонструє, що ключове значення в аналізі ринку має не сам об’єм, а його ефективність та вплив на ціну.
На етапі входу ринок перебував під вираженим тиском маркет-продажів, проте ціна перестала реагувати подальшим зниженням та не змогла оновити локальний мінімум. Це вказувало на ослаблення продавців та активне поглинання їхнього об’єму лімітними покупцями, що призвело до формування ознак локального дефіциту та створило передумови для подальшого зростання.
Додатковим підтвердженням виступили агреговані дані дашборду, де тривале посилення маркет-продажів супроводжувалося переважанням лімітних заявок на покупку. Подібна комбінація сигналів свідчила про формування локальної підтримки та поступове зміщення балансу у бік покупців.
Після входу ринок реалізував впевнений висхідний рух, однак у міру його розвитку структура почала змінюватися: зросла волатильність, а маркет-продаж знову почав ефективно впливати на ціну, що супроводжувалося послідовним зниженням активу.
Таким чином, вхід був заснований на ознаках неефективності продавців та формуванні локального дефіциту, а вихід – на відновленні ефективності продавців та зростанні ймовірності глибшої корекції. Подібний підхід дозволяє приймати більш обґрунтовані торгові рішення, спираючись не тільки на напрямок руху ціни, але й на реальну взаємодію попиту, пропозиції та ліквідності всередині ринку.
Стеж за новими статтями у нашому телеграм каналі.
Не треба вигадувати складних схем та шукати “грааль”. Використовуйте інструменти платформи Resonance.
Реєструйся за посиланням - отримуй бонус і починай заробляти:
OKX | BingX | KuCoin.
Промокод TOPBLOG дає тобі 10% знижки на будь-який тарифний план Resonance.
Рекомендовані статті


