ALPINE +116% (Направленная стратегия Резонанс)

В разборе сделки по ALPINE/USDT видно, как сочетание кластерного графика и инструментов Дешборда помогает находить сильные точки для входа. Несмотря на активные продажи, цена удерживалась и не обновляла минимум, а редкое отклонение по Z-Score усиливало гипотезу на рост. На выходе решающим фактором стало появление давления со стороны рыночных продаж и признаки фиксации прибыли участниками. Такой анализ показывает ценность комплексного подхода — наблюдать за балансом сил и вовремя фиксировать результат.
Содержание

Монета: ALPINE/USDT
Риск: средний
Уровень понимания: новичок
Причины входа
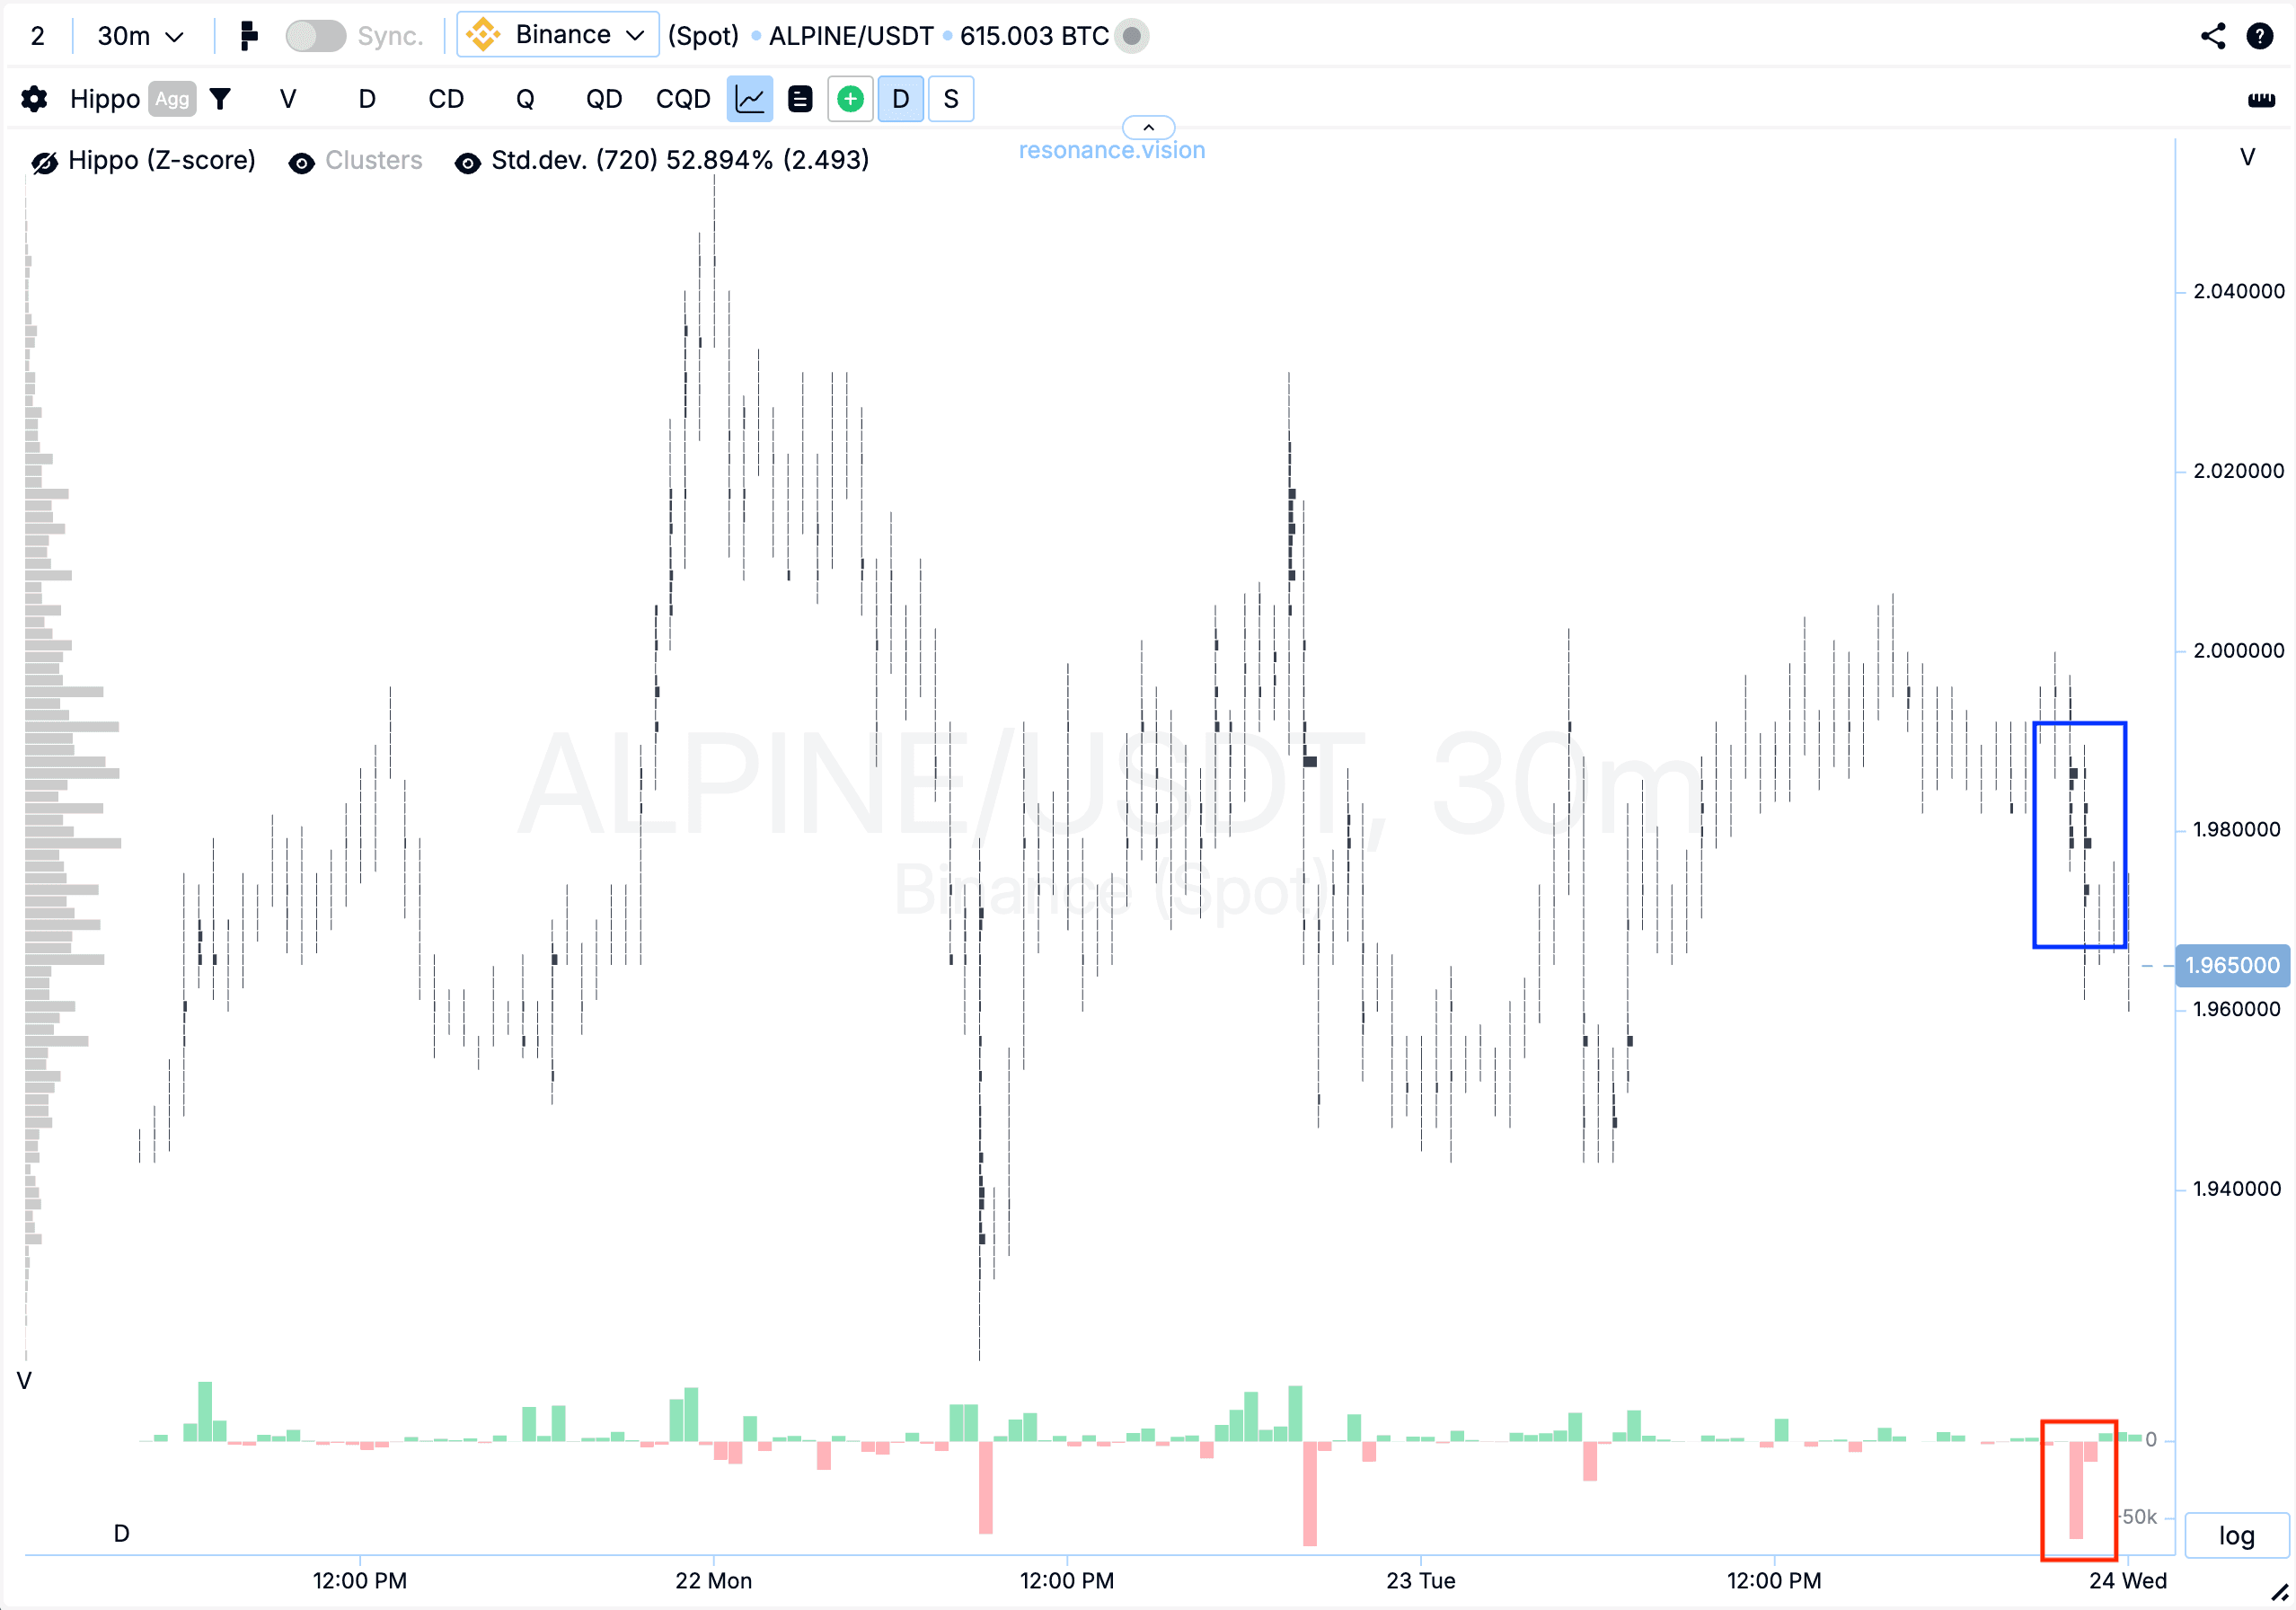
Кластерный график: начали формироваться кластера по объёму (синий прямоугольник). Внутри них преобладали рыночные продажи (красный прямоугольник), однако, несмотря на давление, цена не обновила локальный минимум. Подобная динамика может указывать на локальное формирование дефицита и присутствие интереса со стороны покупателей.
В Дешборде
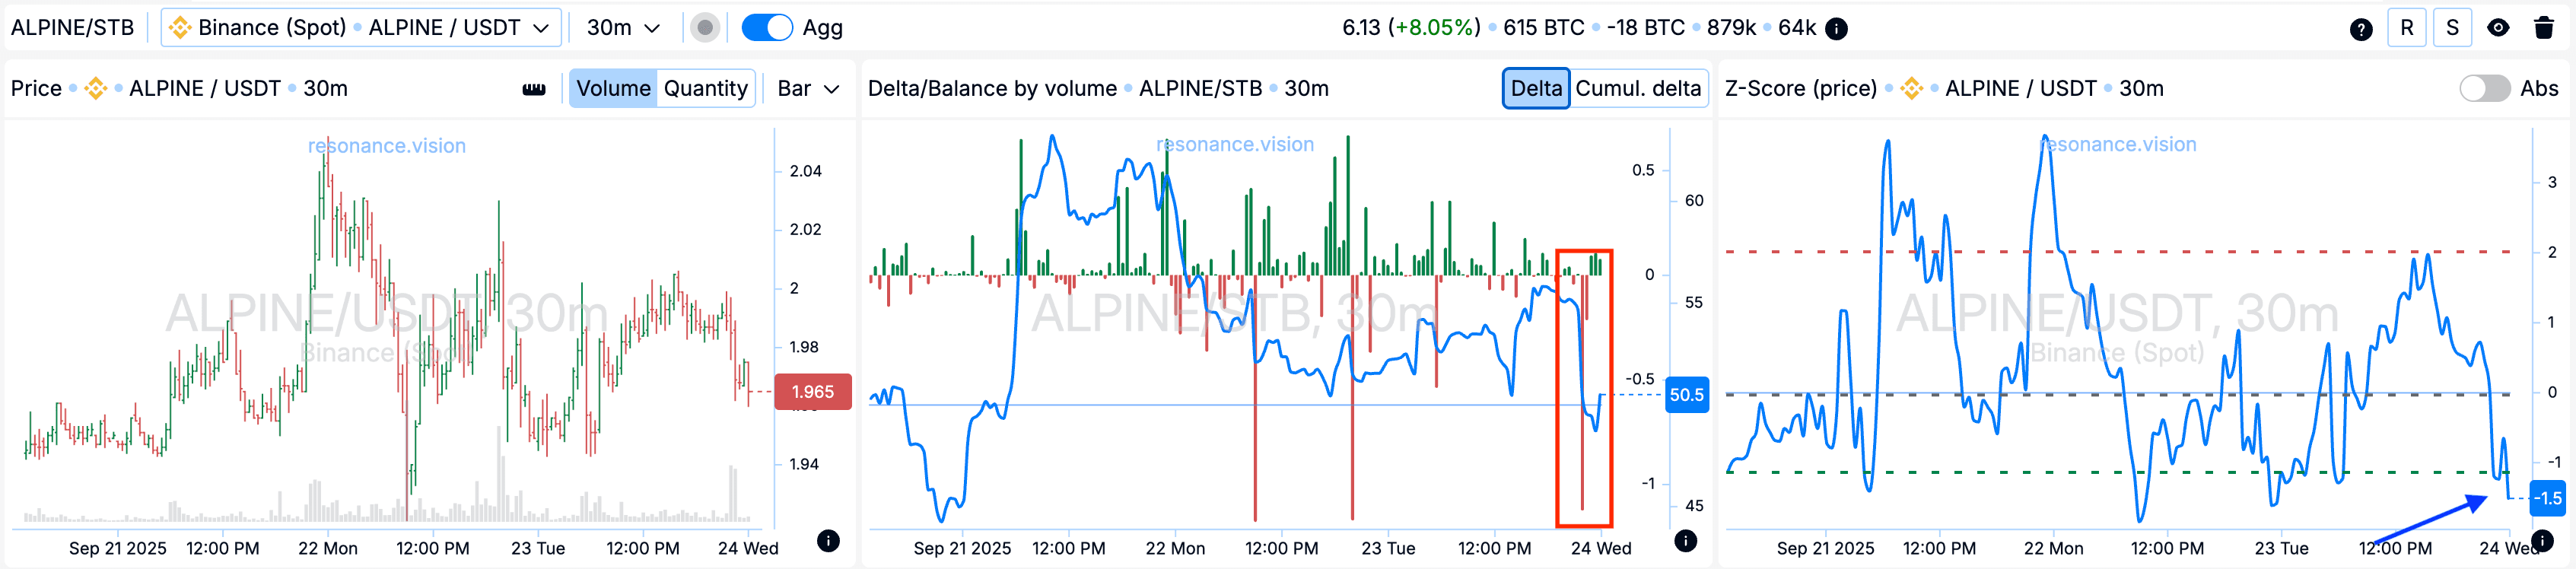
Дельта/Баланс по объёму: по агрегированным данным заметен выраженный всплеск рыночных продаж — это хорошо отражено на гистограмме дельты (красный прямоугольник). Однако, несмотря на давление, цена практически не снизилась, что указывает на ослабление влияния продавцов.
Z-Score (цена): дополнительно отмечено отклонение цены вниз за пределы нижнего перцентиля, что для данного актива встречается нечасто (синяя стрелка). Такая аномалия может сигнализировать о вероятности разворота и дальнейшего роста.
Причины выхода
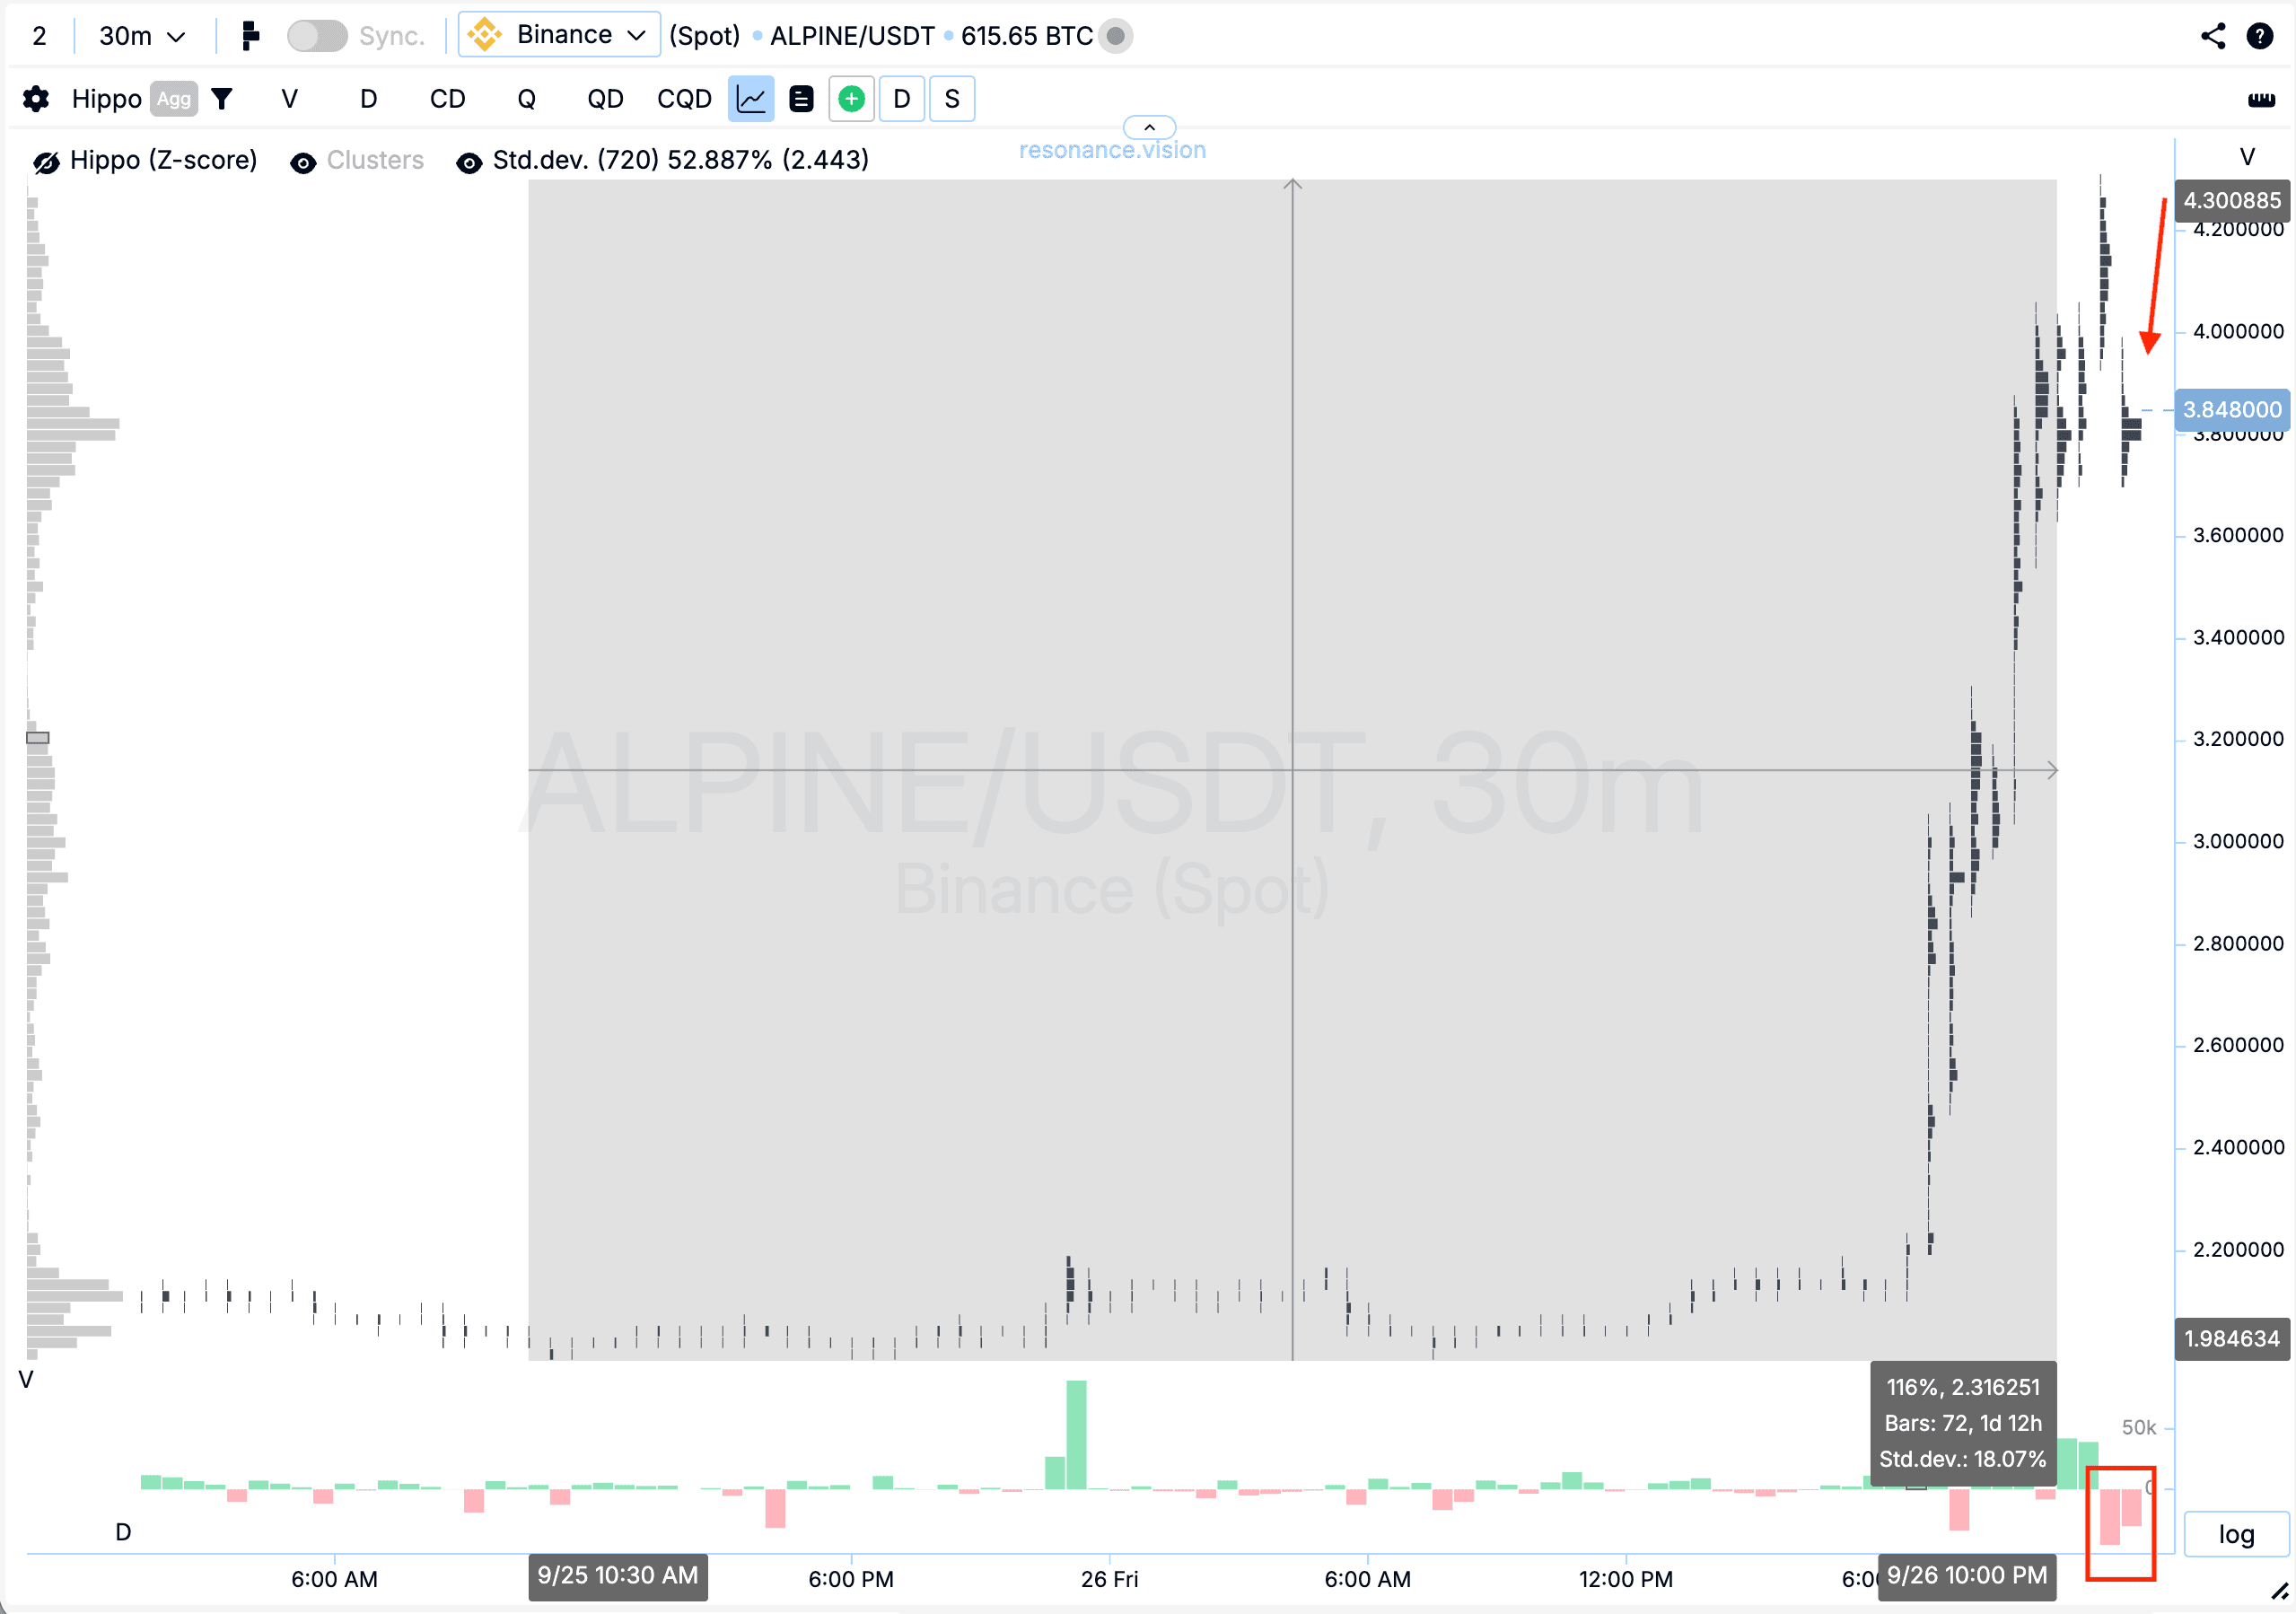
Кластерный график: после входа цена показала уверенный рост без заметных откатов, дав дополнительное движение ещё на +116%. Затем началось снижение: рыночные объёмы на продажу стали оказывать ощутимое давление на цену (красный прямоугольник и стрелка). Подобная динамика сигнализирует о фиксации результата, так как участники рынка, вероятно, начали сбрасывать ранее набранные позиции и фиксировать прибыль.
Заключение
Эта сделка демонстрирует, как совмещение кластерного графика и данных Дешборда помогает выявлять сильные точки входа. Несмотря на выраженное давление со стороны продавцов, отсутствие обновления минимума и аномальное отклонение цены указывали на локальный дефицит и интерес со стороны покупателей. Это стало основанием для гипотезы на лонг.
На выходе ключевым сигналом стало усиление рыночных продаж и появление ощутимого давления на цену, что указывало на фиксацию позиций участниками и необходимость закрытия сделки.
Такой подход позволяет вовремя распознавать смену баланса сил и принимать решения, которые помогают сохранить результат и контролировать риск.
Следи за новыми статьями в нашем телеграм канале.
Не нужно выдумывать сложных схем и искать “грааль”. Используй инструменты платформы Resonance.
Регистрируйся по ссылке — получай бонус и начинай зарабатывать:
OKX | BingX | KuCoin.
Промокод TOPBLOG дает тебе 10% скидки на любой тарифный план Resonance.
Рекомендуемые статьи


