APT +17.7% (Resonance Directional Strategy)

In this analysis, we analyze the APT/USDT trade, where the formation of a market surplus and subsequent reversal played a key role. We show how, using a cluster chart, delta, and Z-Score, you can identify the inefficiency of market participants, determine entry and exit points, and record the result, following the logic of volume behavior.
Table of contents

Coin: APT/USDT
Risk: low
Understanding level: beginner
Reasons to enter the deal
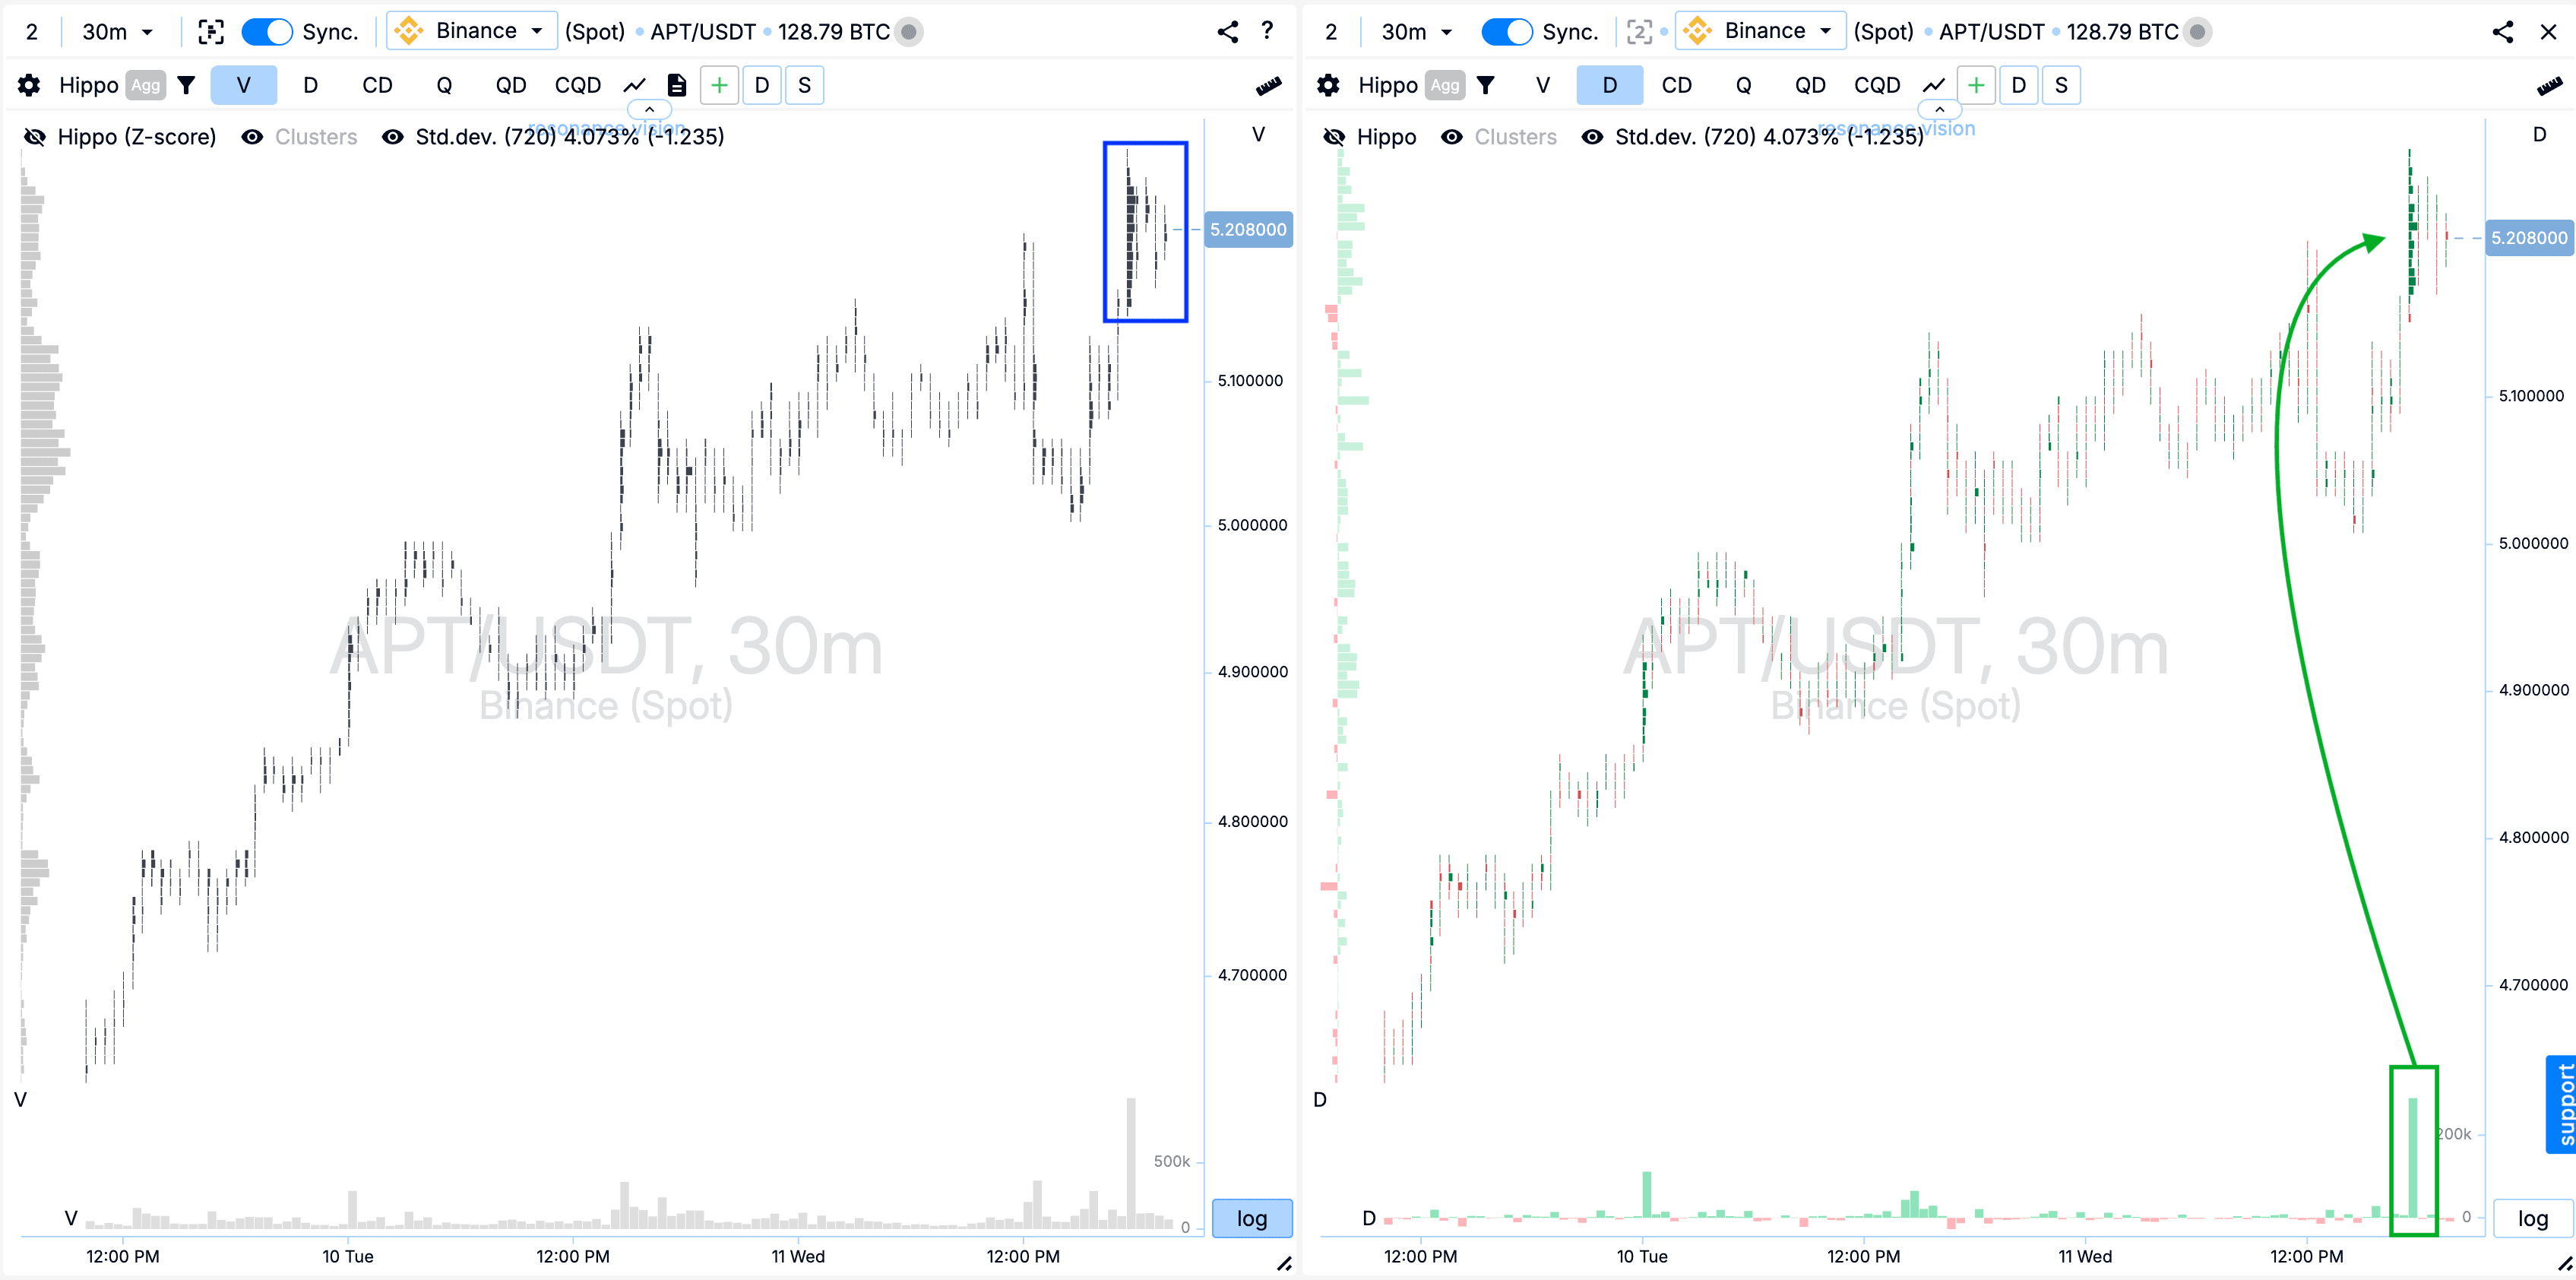
Cluster chart: Cluster chart: On the local growth, pronounced volume clusters were formed (blue rectangle). They were being followed by significant market purchases (green rectangle with an arrow). However, despite the volume, the price did not demonstrate a confident upward movement. This may indicate the presence of a local surplus - the predominance of supply over demand.
On the Dashboard
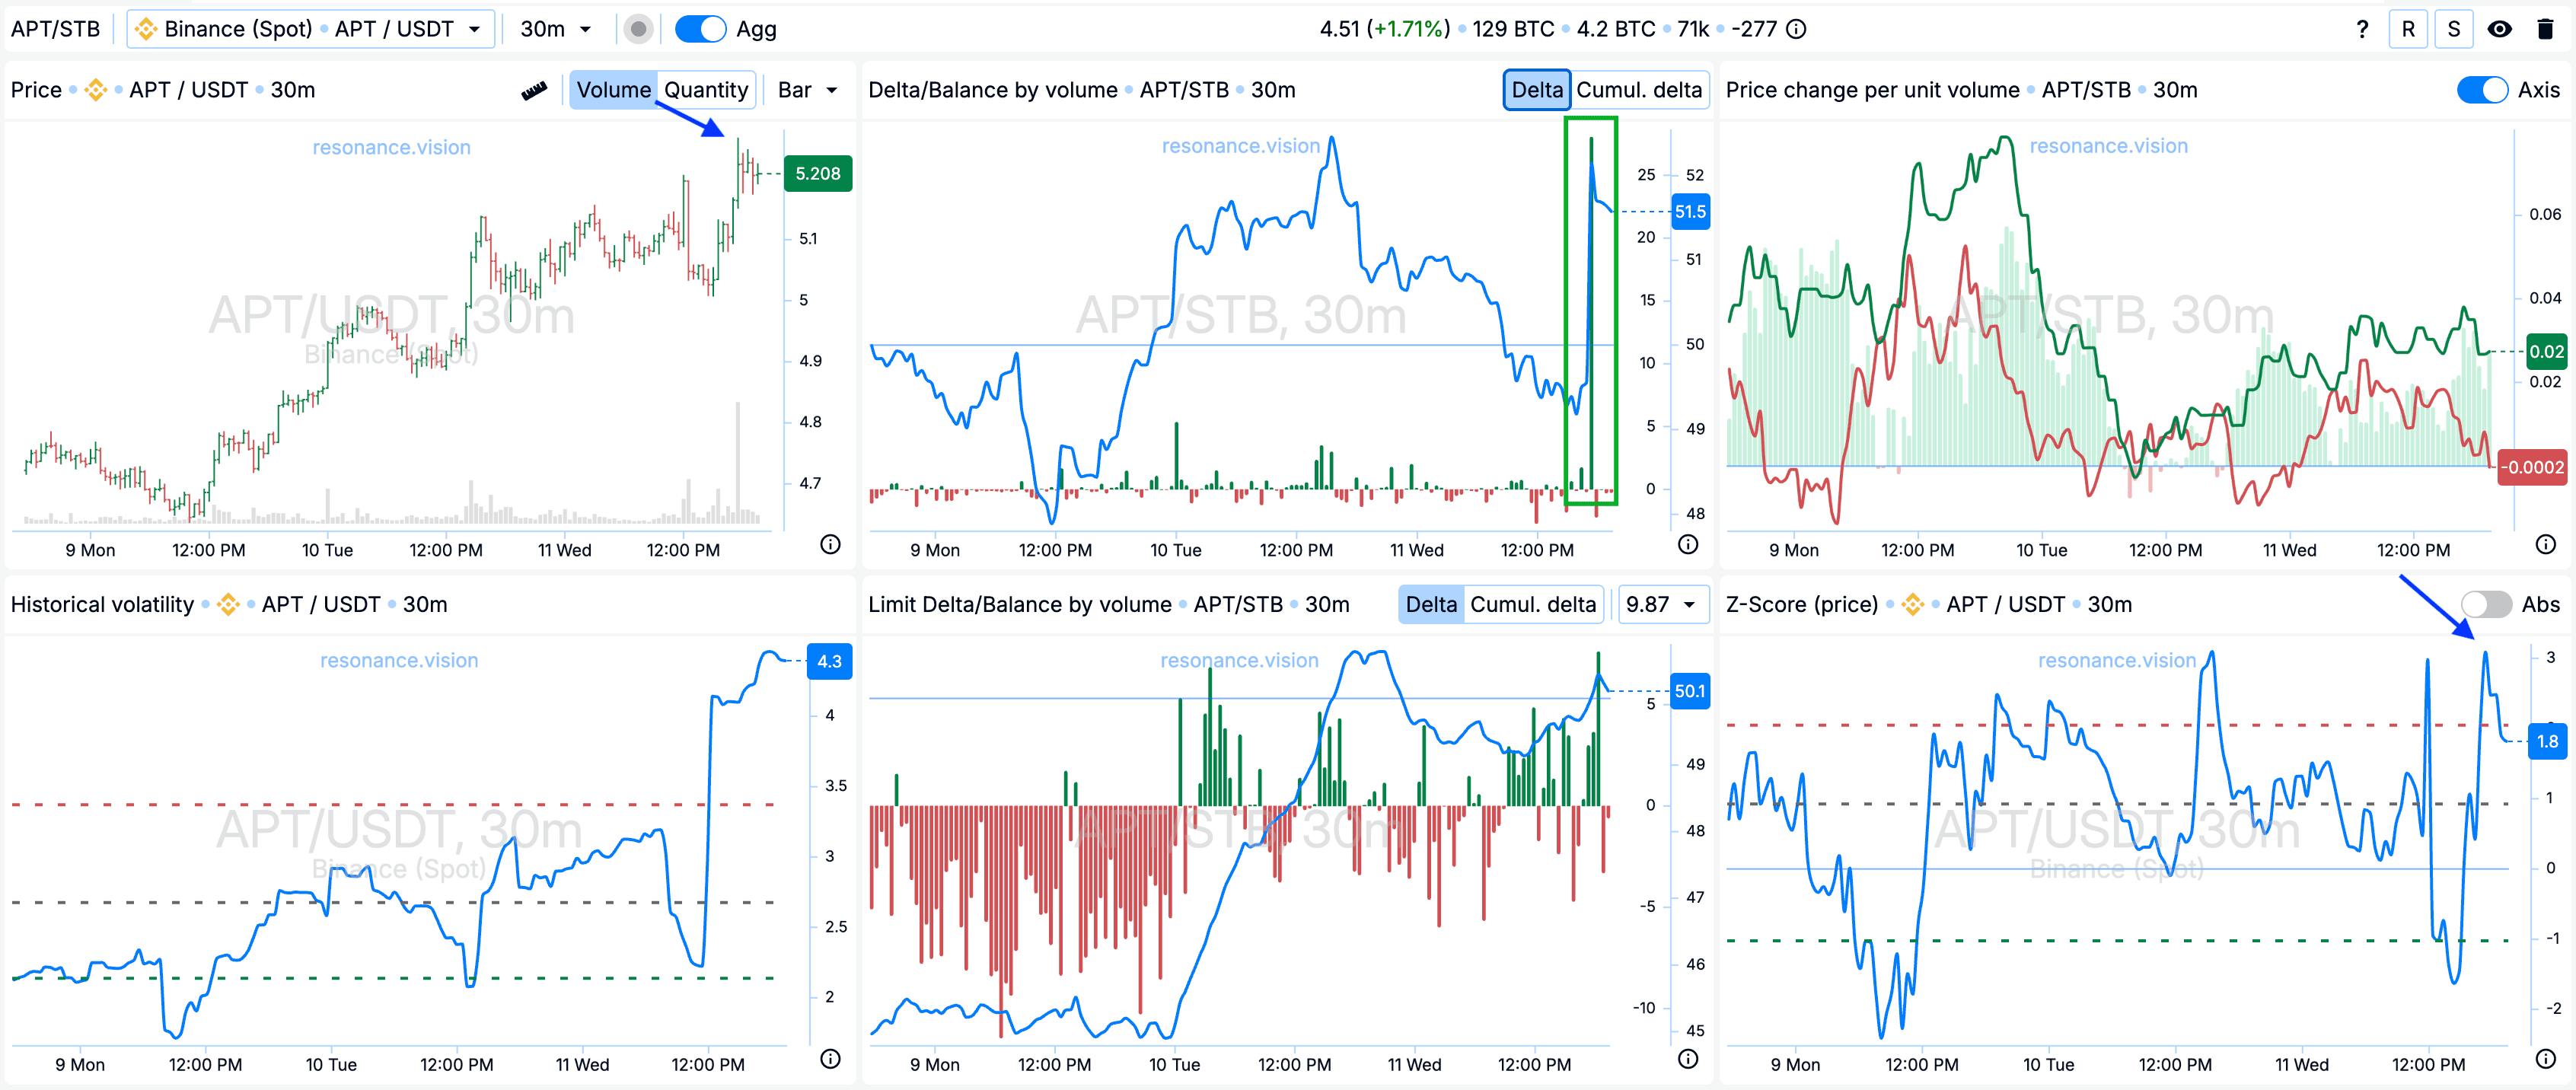
Delta/Balance by volume: Aggregated data also indicates that there is buying in all pairs: a huge delta (marked with a rectangle). But, as I mentioned above, the price did not perform well. This confirms the hypothesis of weak efficiency of buyers.
Z-Score (price): At the peak of the move, price reached values exceeding 3 standard deviations (blue arrows).
Reasons for exit
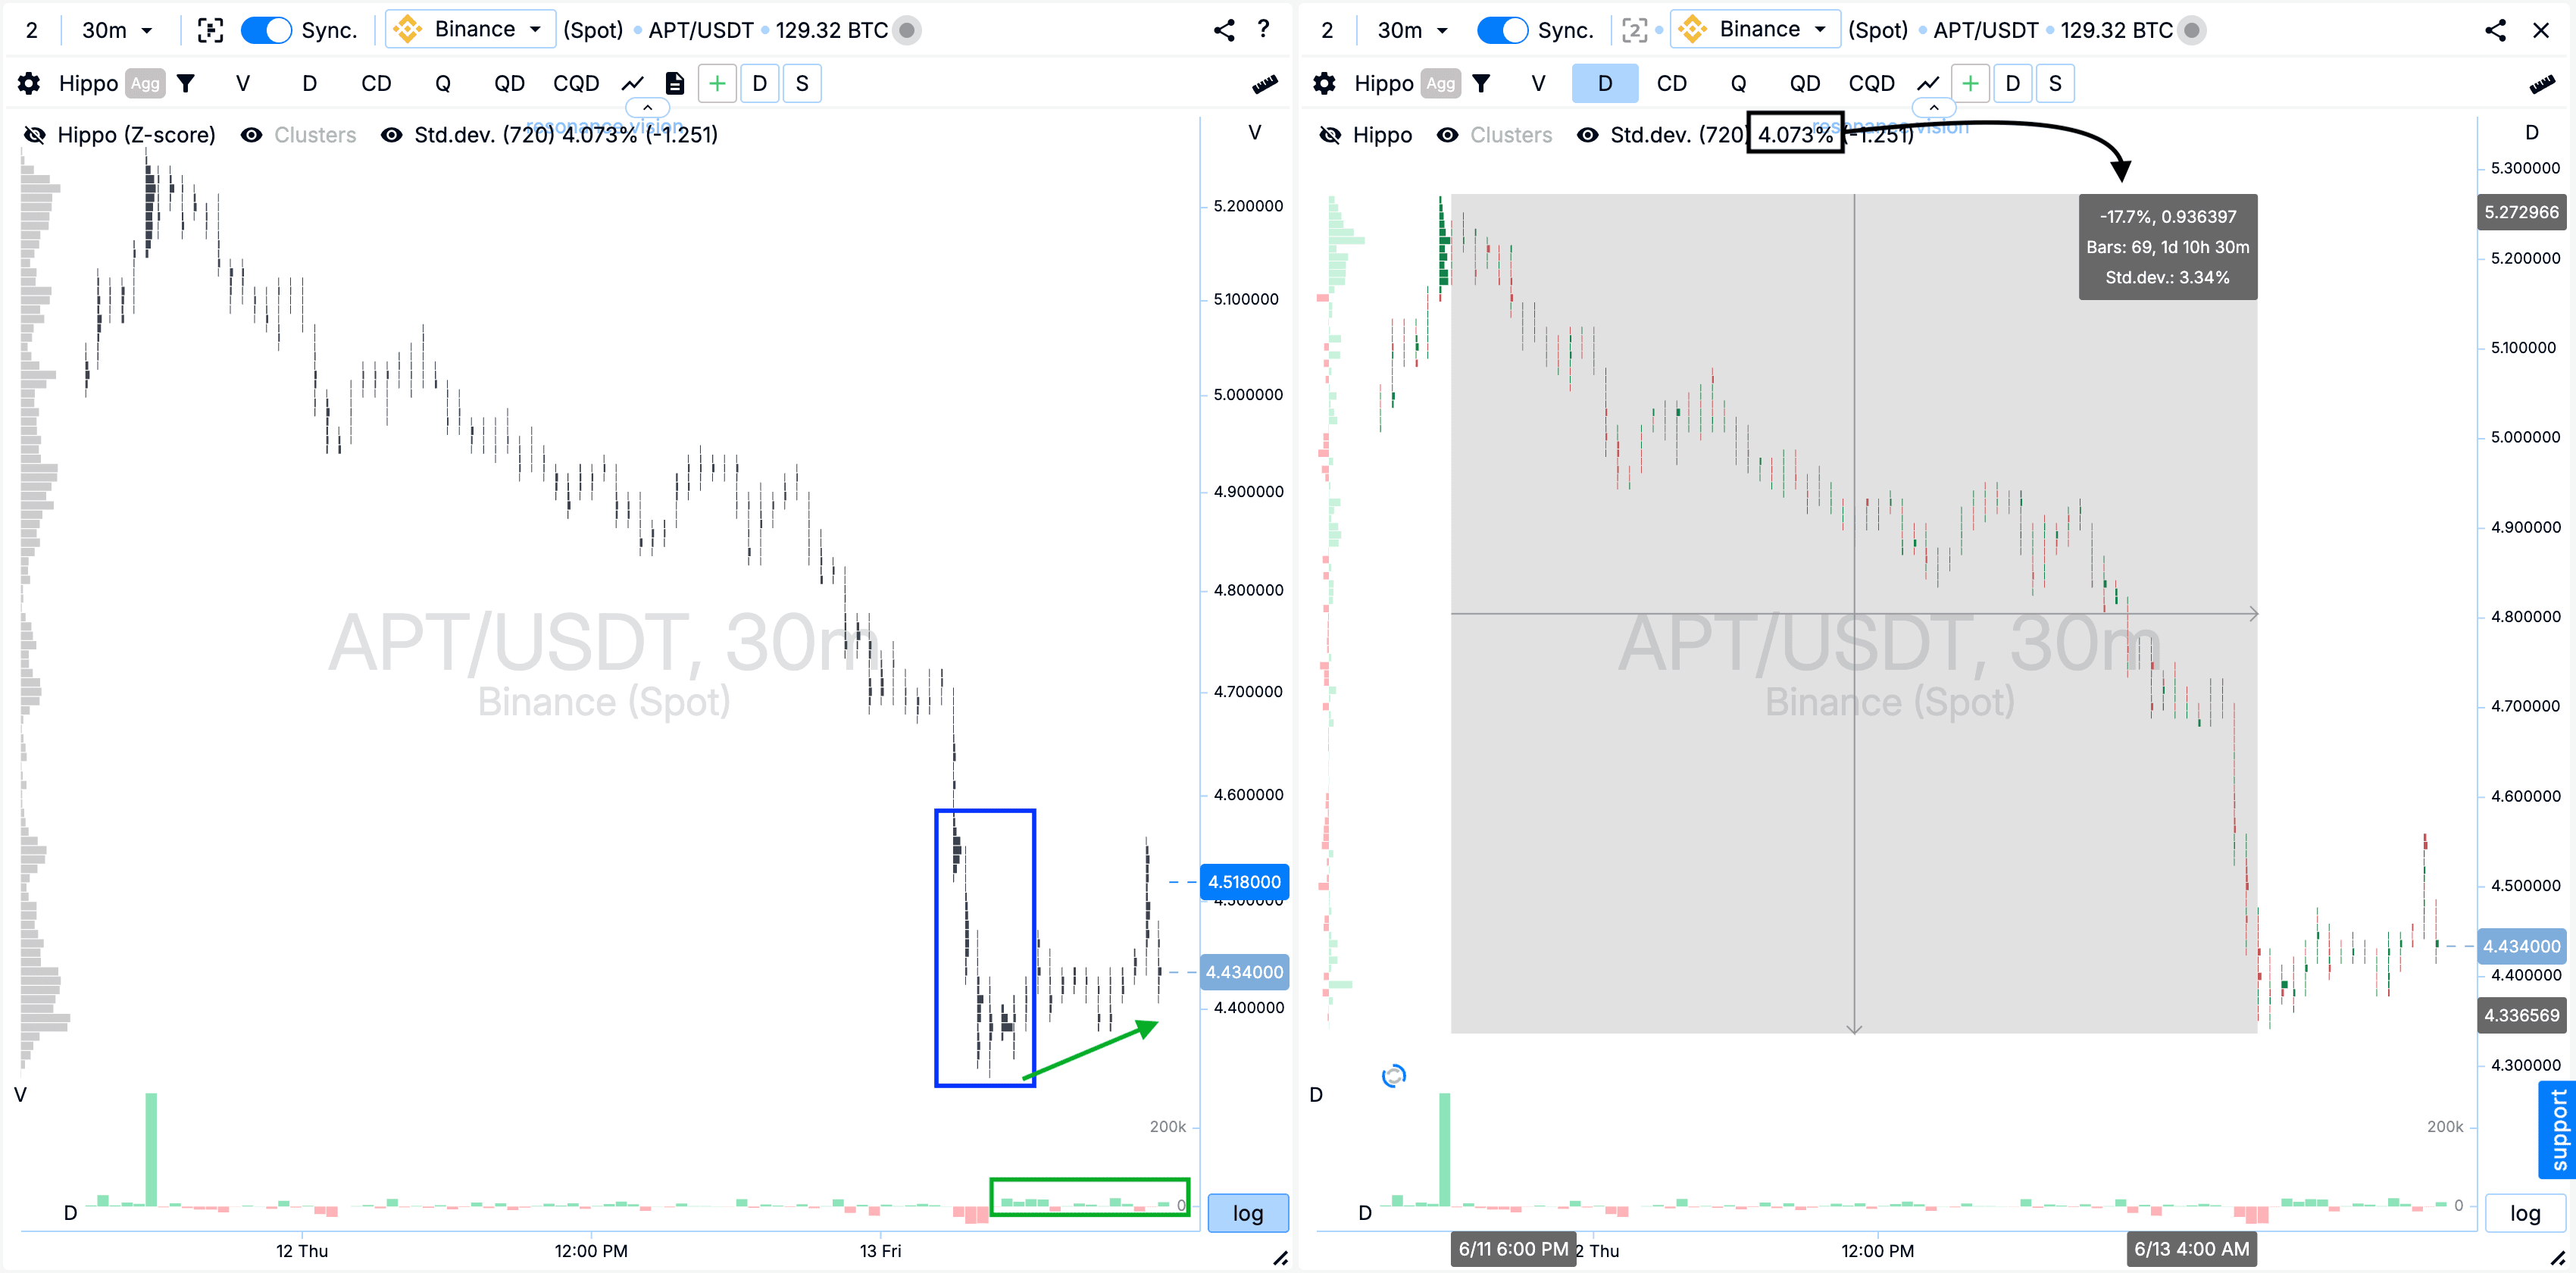
Cluster chart: Now volume clusters started to form at the bottom of the price range (blue rectangle). Soon after, the dominance of market buying became evident. This can be clearly seen in the delta. The price gradually began to grow (green rectangle with an arrow).
I also noted a local decrease in price by 17.7% (rectangle with an arrow). It is significant and exceeds 4 standard deviations. This fact strengthens the hypothesis about possible reversal or end of the movement.
Dashboard
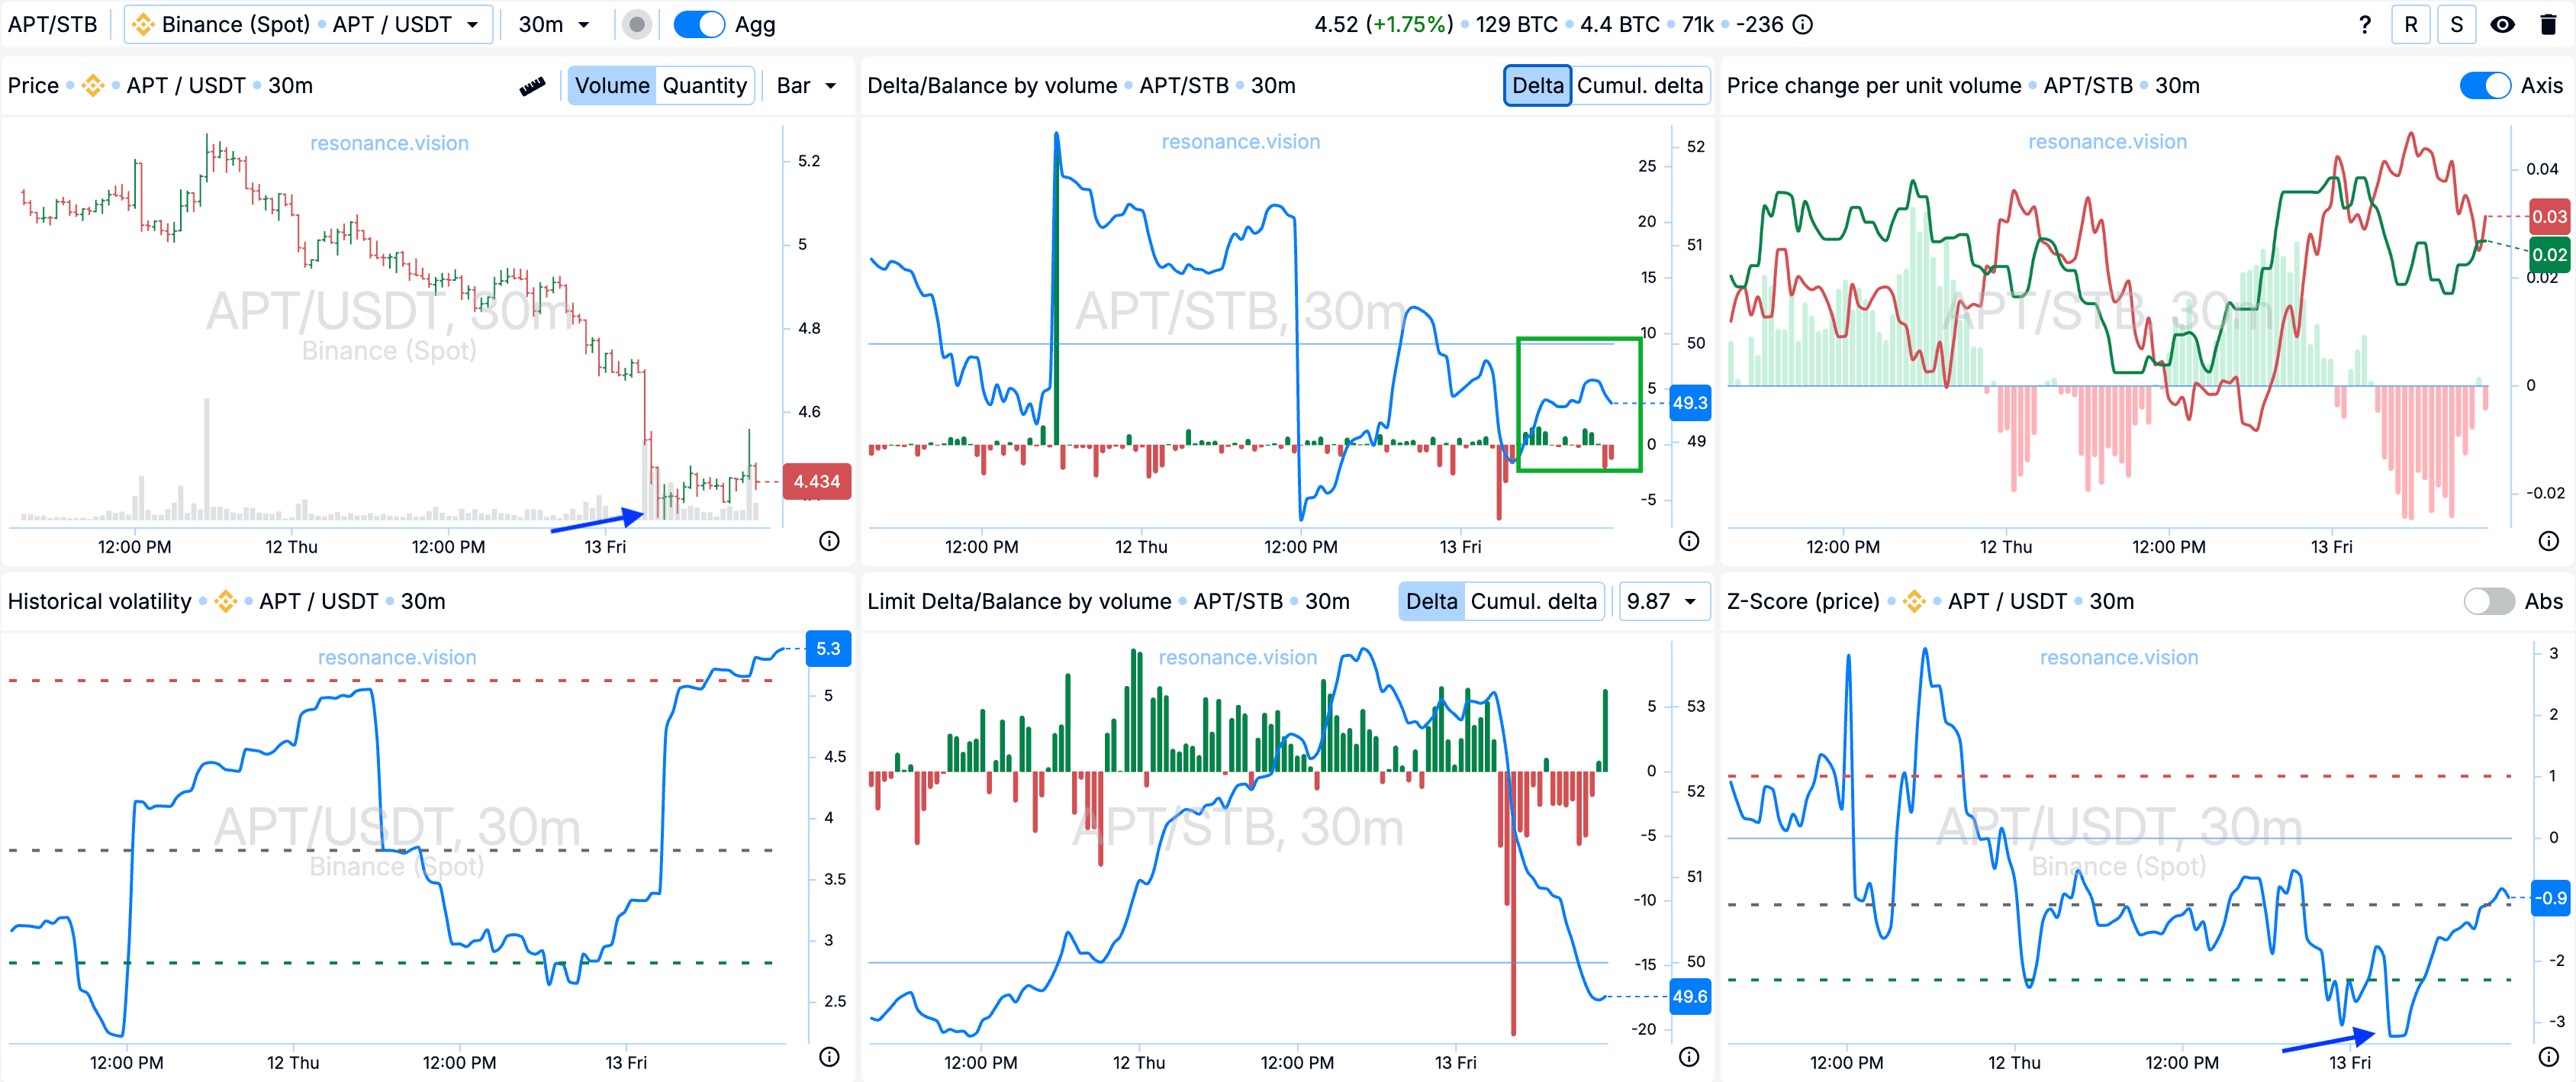
**Delta/Volume Balance: **The delta histogram shows the predominance of green bars. This indicates the growth of market purchases. At the same time, the balance is also moving towards buyers (marked with a green rectangle).
Z-Score (price): The situation is opposite to what was observed on entry. Now, the price has deviated down by more than 3 standard deviations at the peak of the down move (marked with blue arrows). This indicates an abnormal movement and a potential reversal zone.
Conclusion
In this trade, we were able to identify signs of a market surplus at the local high. Despite active market buying, the price did not show the expected growth. This was a valid signal to open a position. Additional confidence in the short scenario was given by strong deviation on Z-Score.
At the exit from the deal the opposite situation was formed. Buyers began to intercept the initiative. Signs of local deficit became visible. This deal once again highlights how important it is not just to fix volumes, but to understand their influence on the price. This is what allows you to make informed trading decisions.
Follow new articles in our telegram channel.
No need to invent complicated schemes and look for the "grail". Use the tools of the Resonance platform.
Register using the link - get a bonus and start earning:
OKX | BingX | KuCoin.
Promo code TOPBLOG gives you 10% discount on any Resonance tariff plan.
Recommended articles


