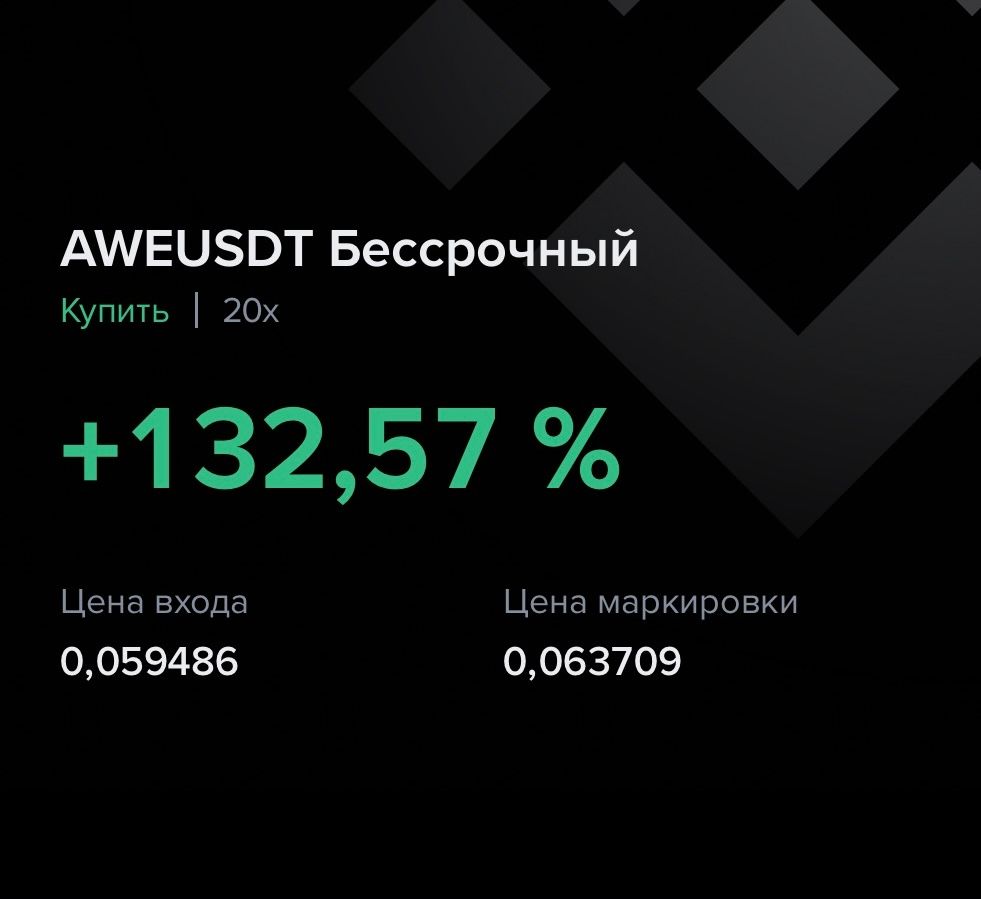
AWE +132,57% (Напрямкова стратегія Resonance)

AWE/USDT: угода за ознаками дефіциту об’ємів
Аналіз кластерного графіка та агрегованих даних виявив класичну картину локального дефіциту: продавці тиснули об’ємом, але ціна не знижувалась. Це дало основу для впевненого входу в лонг.
Зміст

Монета: AWE/USDT
Ризик: низький
Рівень розуміння: новачок
Причини входу
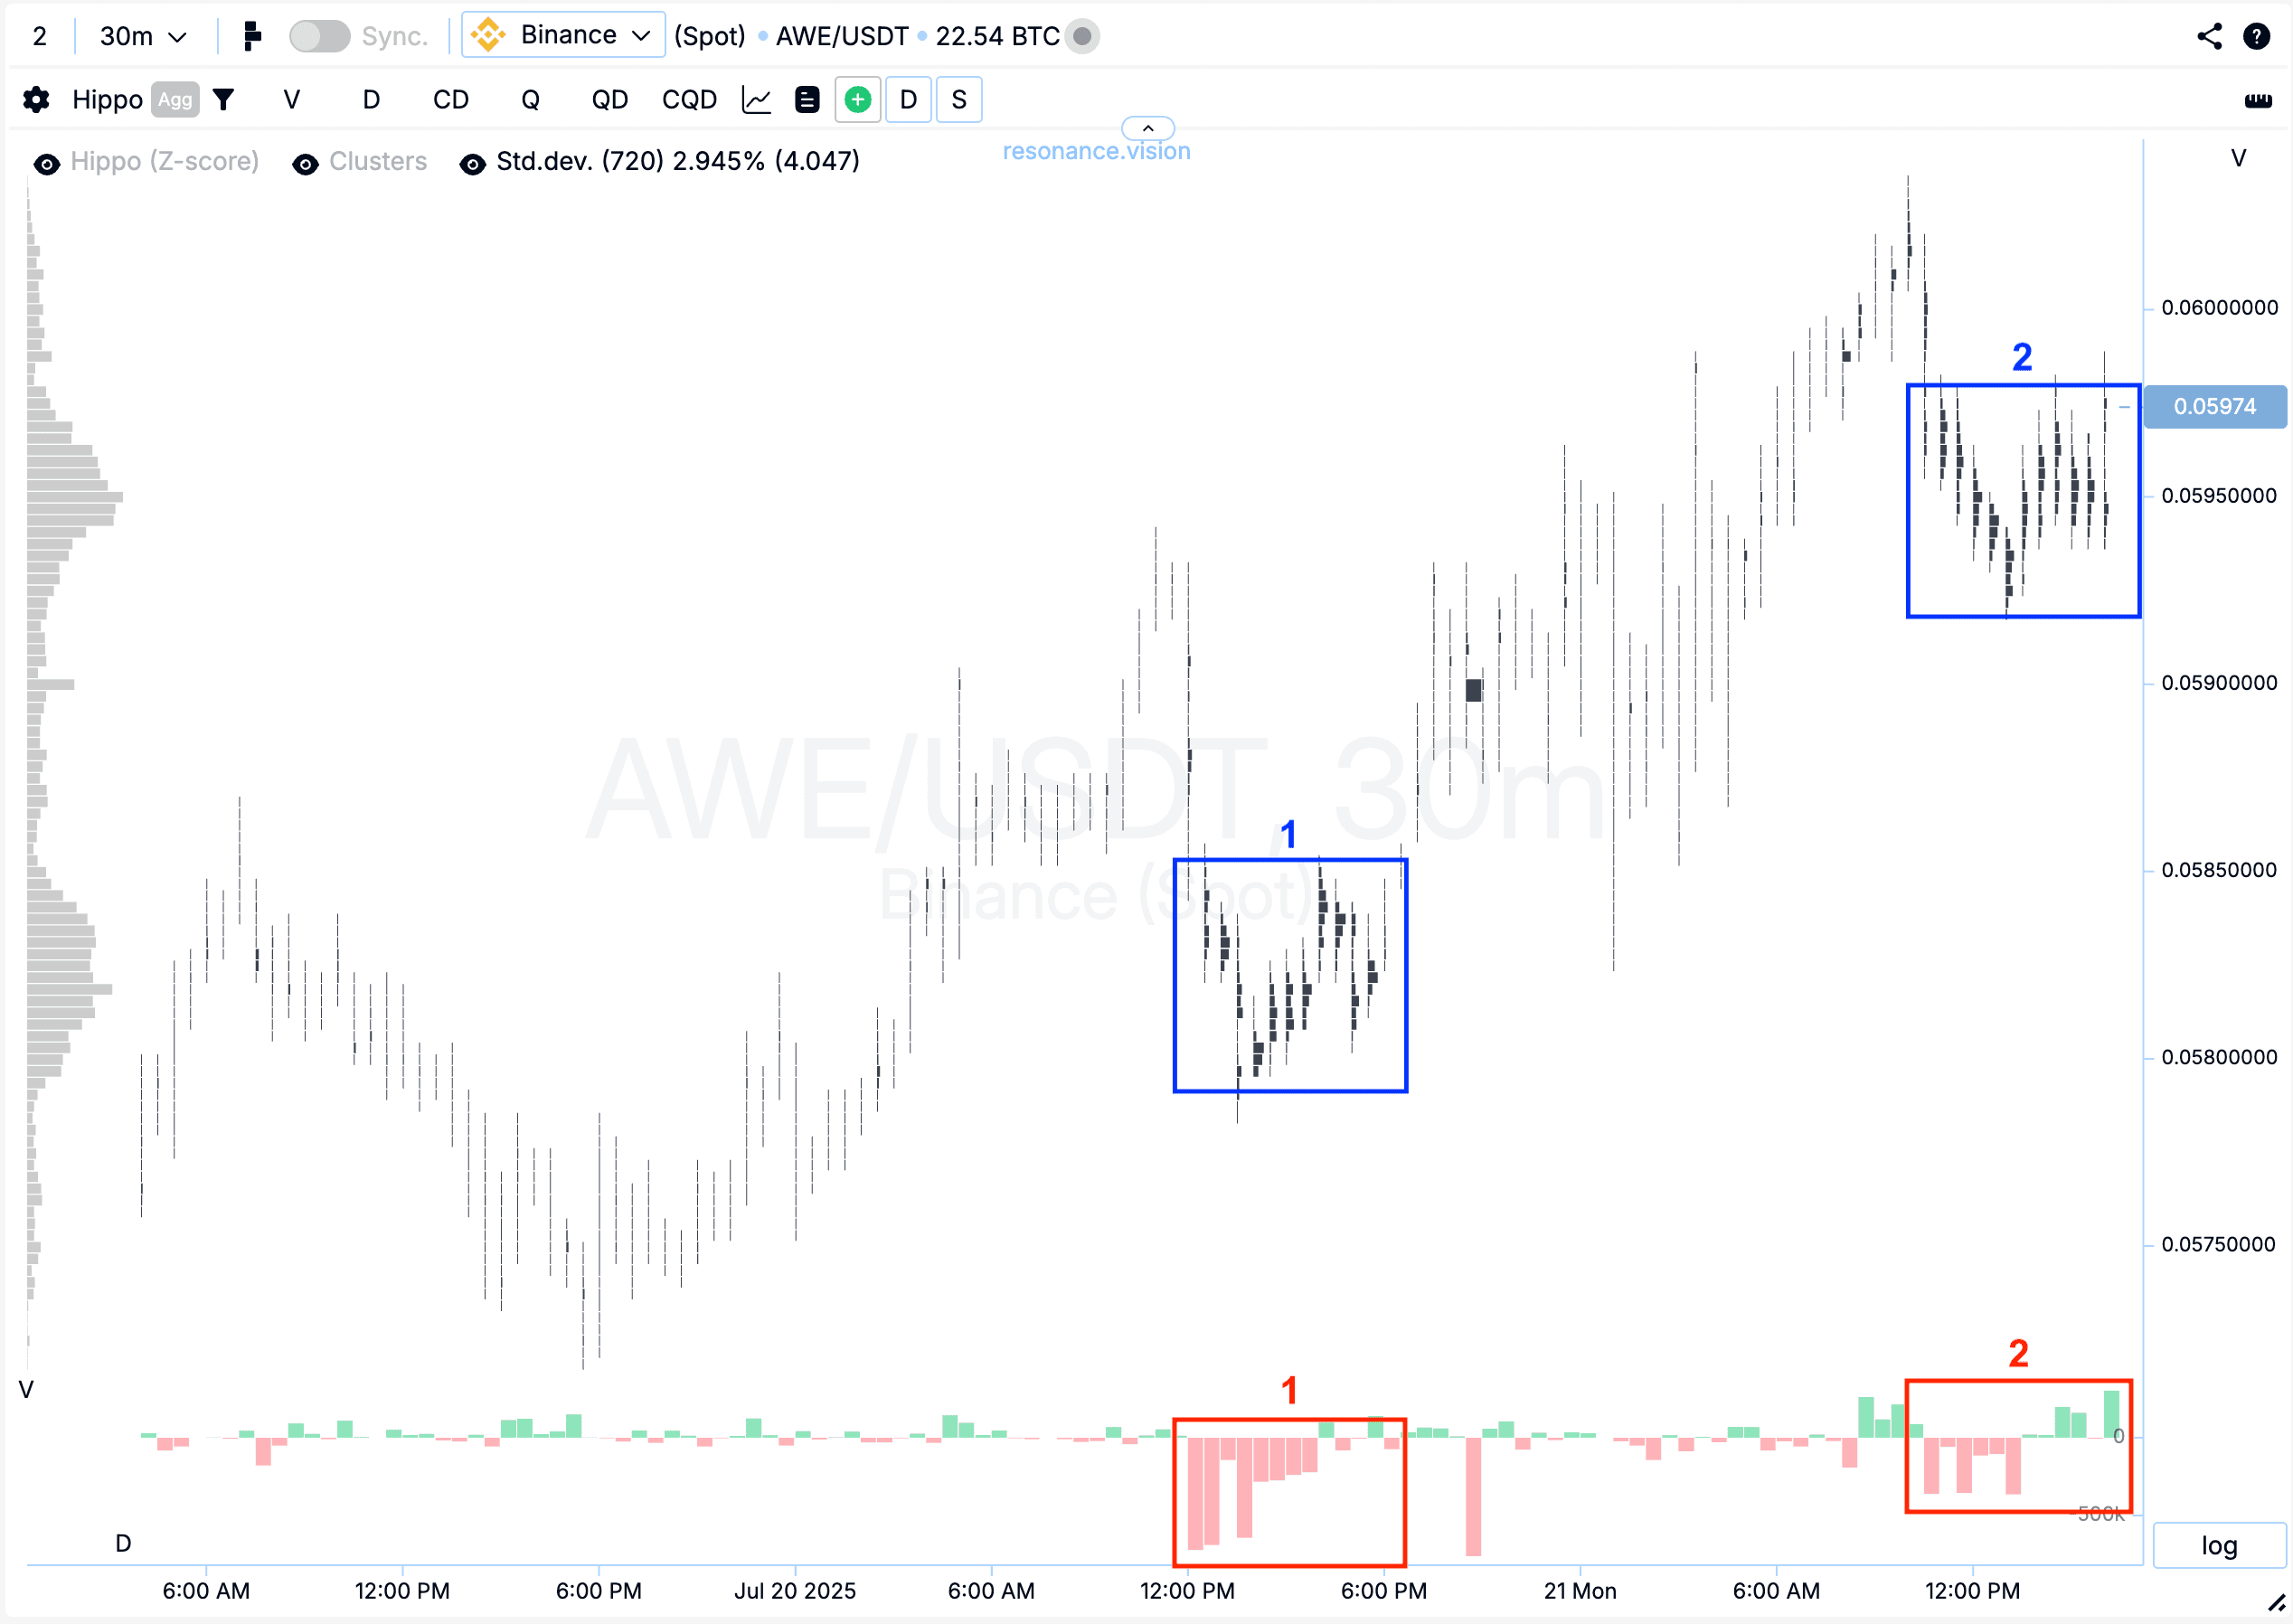
Кластерний графік: у відносно вузькому ціновому діапазоні почали формуватися кластери за об’ємом (синій прямокутник №1). На момент локального відкату об’єми помітно змістилися у бік продажів (червоний прямокутник №1), проте ціна на це практично не відреагувала — зниження припинилося.
Пізніше зафіксовано повторне формування кластерів за об’ємом (синій прямокутник №2), де знову спостерігалося переважання продажів, які потім почали поступово переходити до покупок (червоний прямокутник №2). Все це може свідчити про збереження ознак локального дефіциту — ініціатива, ймовірно, залишається на боці покупців.
У Дешборді
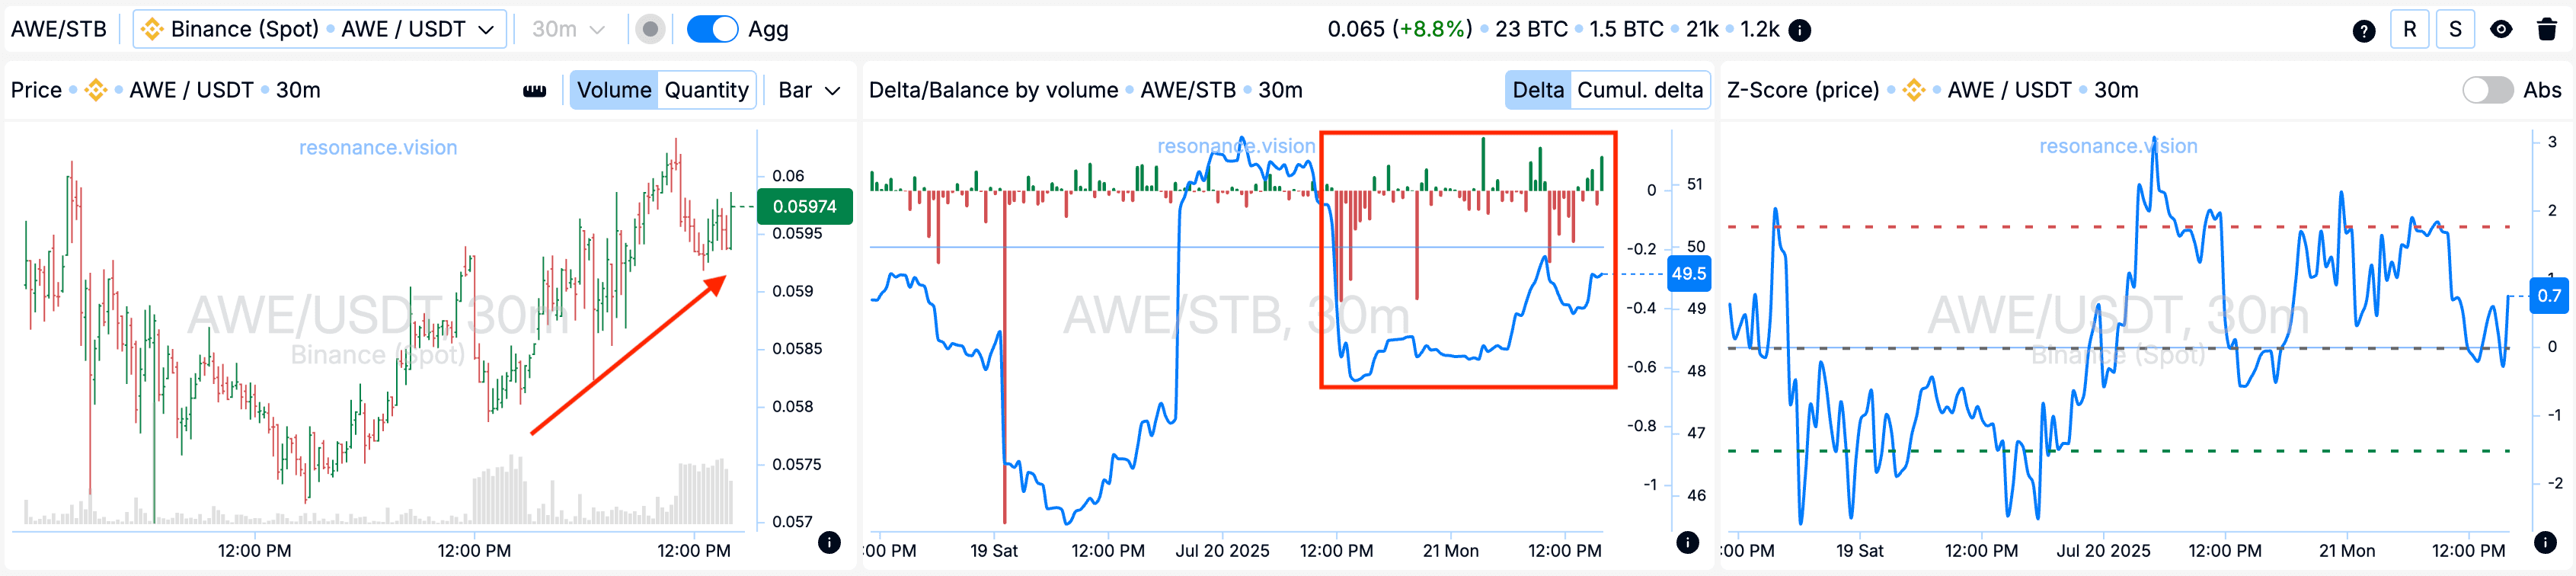
Дельта/Баланс за об’ємом: згідно з агрегованими даними, також по всіх парах спостерігається переважання ринкових продажів - це видно на гістограмі (червоний прямокутник). Однак, незважаючи на тиск із боку продавців, ціна продовжує зростати (показав стрілкою).
Все це підтверджує, що все ще є ознаки локального дефіциту — коли покупці ефективно утримують ціну, незважаючи на активні продажі. Це додає вагомого аргументу на користь відкриття лонг-позиції.
Причини виходу
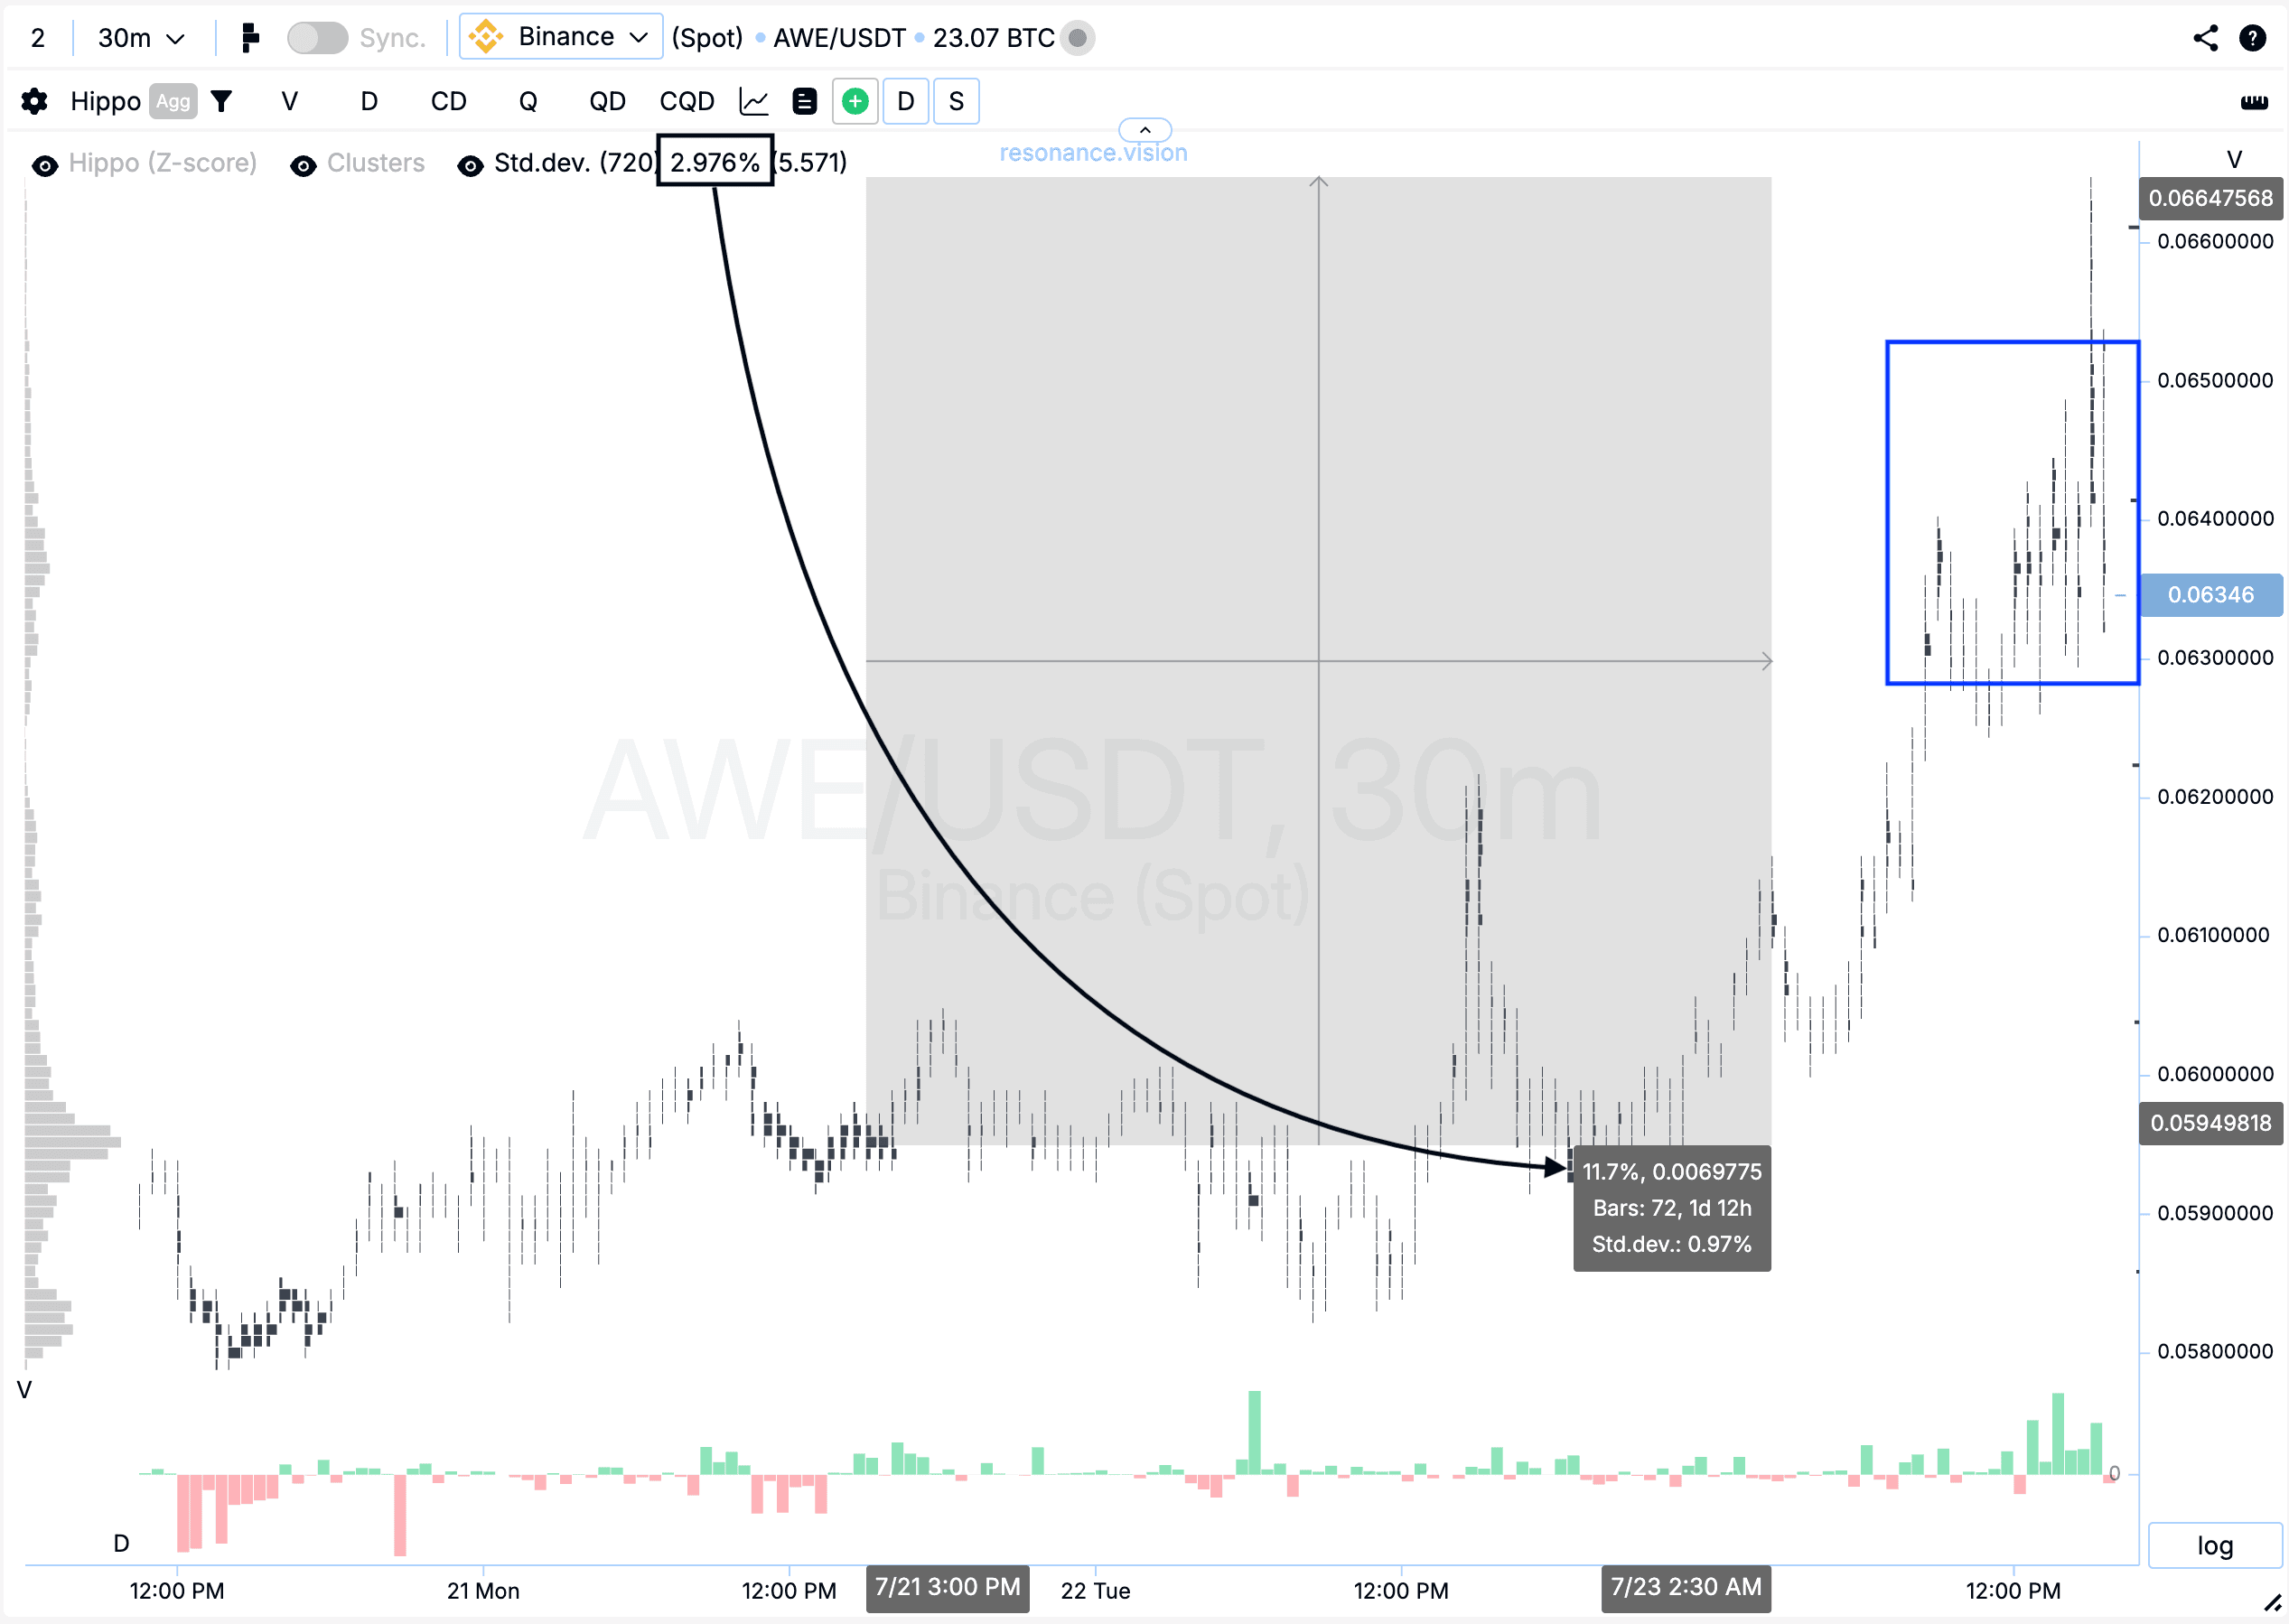
Кластерний графік: відзначив ціновий діапазон, у якому сформувалися кластери за об’ємом (синій прямокутник). У цей період також спостерігалося зростання волатильності та різкий імпульсний рух з наступним відкатом.
Звернув увагу також на те, що від точки входу ціна пройшла вгору майже 12%, що перевищує 4 стандартні відхилення для даного тікеру (чорний прямокутник зі стрілкою). Це робить рух статистично аномальним.
Підсумок
В результаті вдалося зафіксувати прибуток у розмірі 132,57%.
Висновок
З самого початку спостерігалася стійка поведінка ціни на тлі переважних продажів: продавці не могли досягти зниження.
Ключову роль зіграло розуміння взаємодії об’єму, кластерів та агрегованих даних. Це дозволило не просто увійти в ринок, а й витримати позицію до моменту, коли ціна показала аномальне зростання, що перевищує 4 стандартні відхилення. Така модель поведінки ринку є підтвердженням наявності дефіциту та неефективності продавців.
Стеж за новими статтями у нашому телеграм каналі.
Не треба вигадувати складних схем та шукати “грааль”. Використовуйте інструменти платформи Resonance.
Реєструйся за посиланням - отримуй бонус і починай заробляти:
OKX | BingX | KuCoin.
Промокод TOPBLOG дає тобі 10% знижки на будь-який тарифний план Resonance.
Рекомендовані статті


