AXS +160.85% (Directional Strategy Resonance)

How to understand that sellers are losing control over the market?
In this analysis, we analyze a deal in which the key moment was a local deficit: despite volume sales, the price did not decrease. The entry into the position was based on the analysis of the cluster chart, heat map and delta indicators.
And the exit was on abnormal growth and a collision with limit resistance. A clear, logical scenario, where the behavior of the participants gave all the answers.
Table of contents

Coin: AXS/USDT
Risk: medium
Understanding level: beginner
Reasons to enter
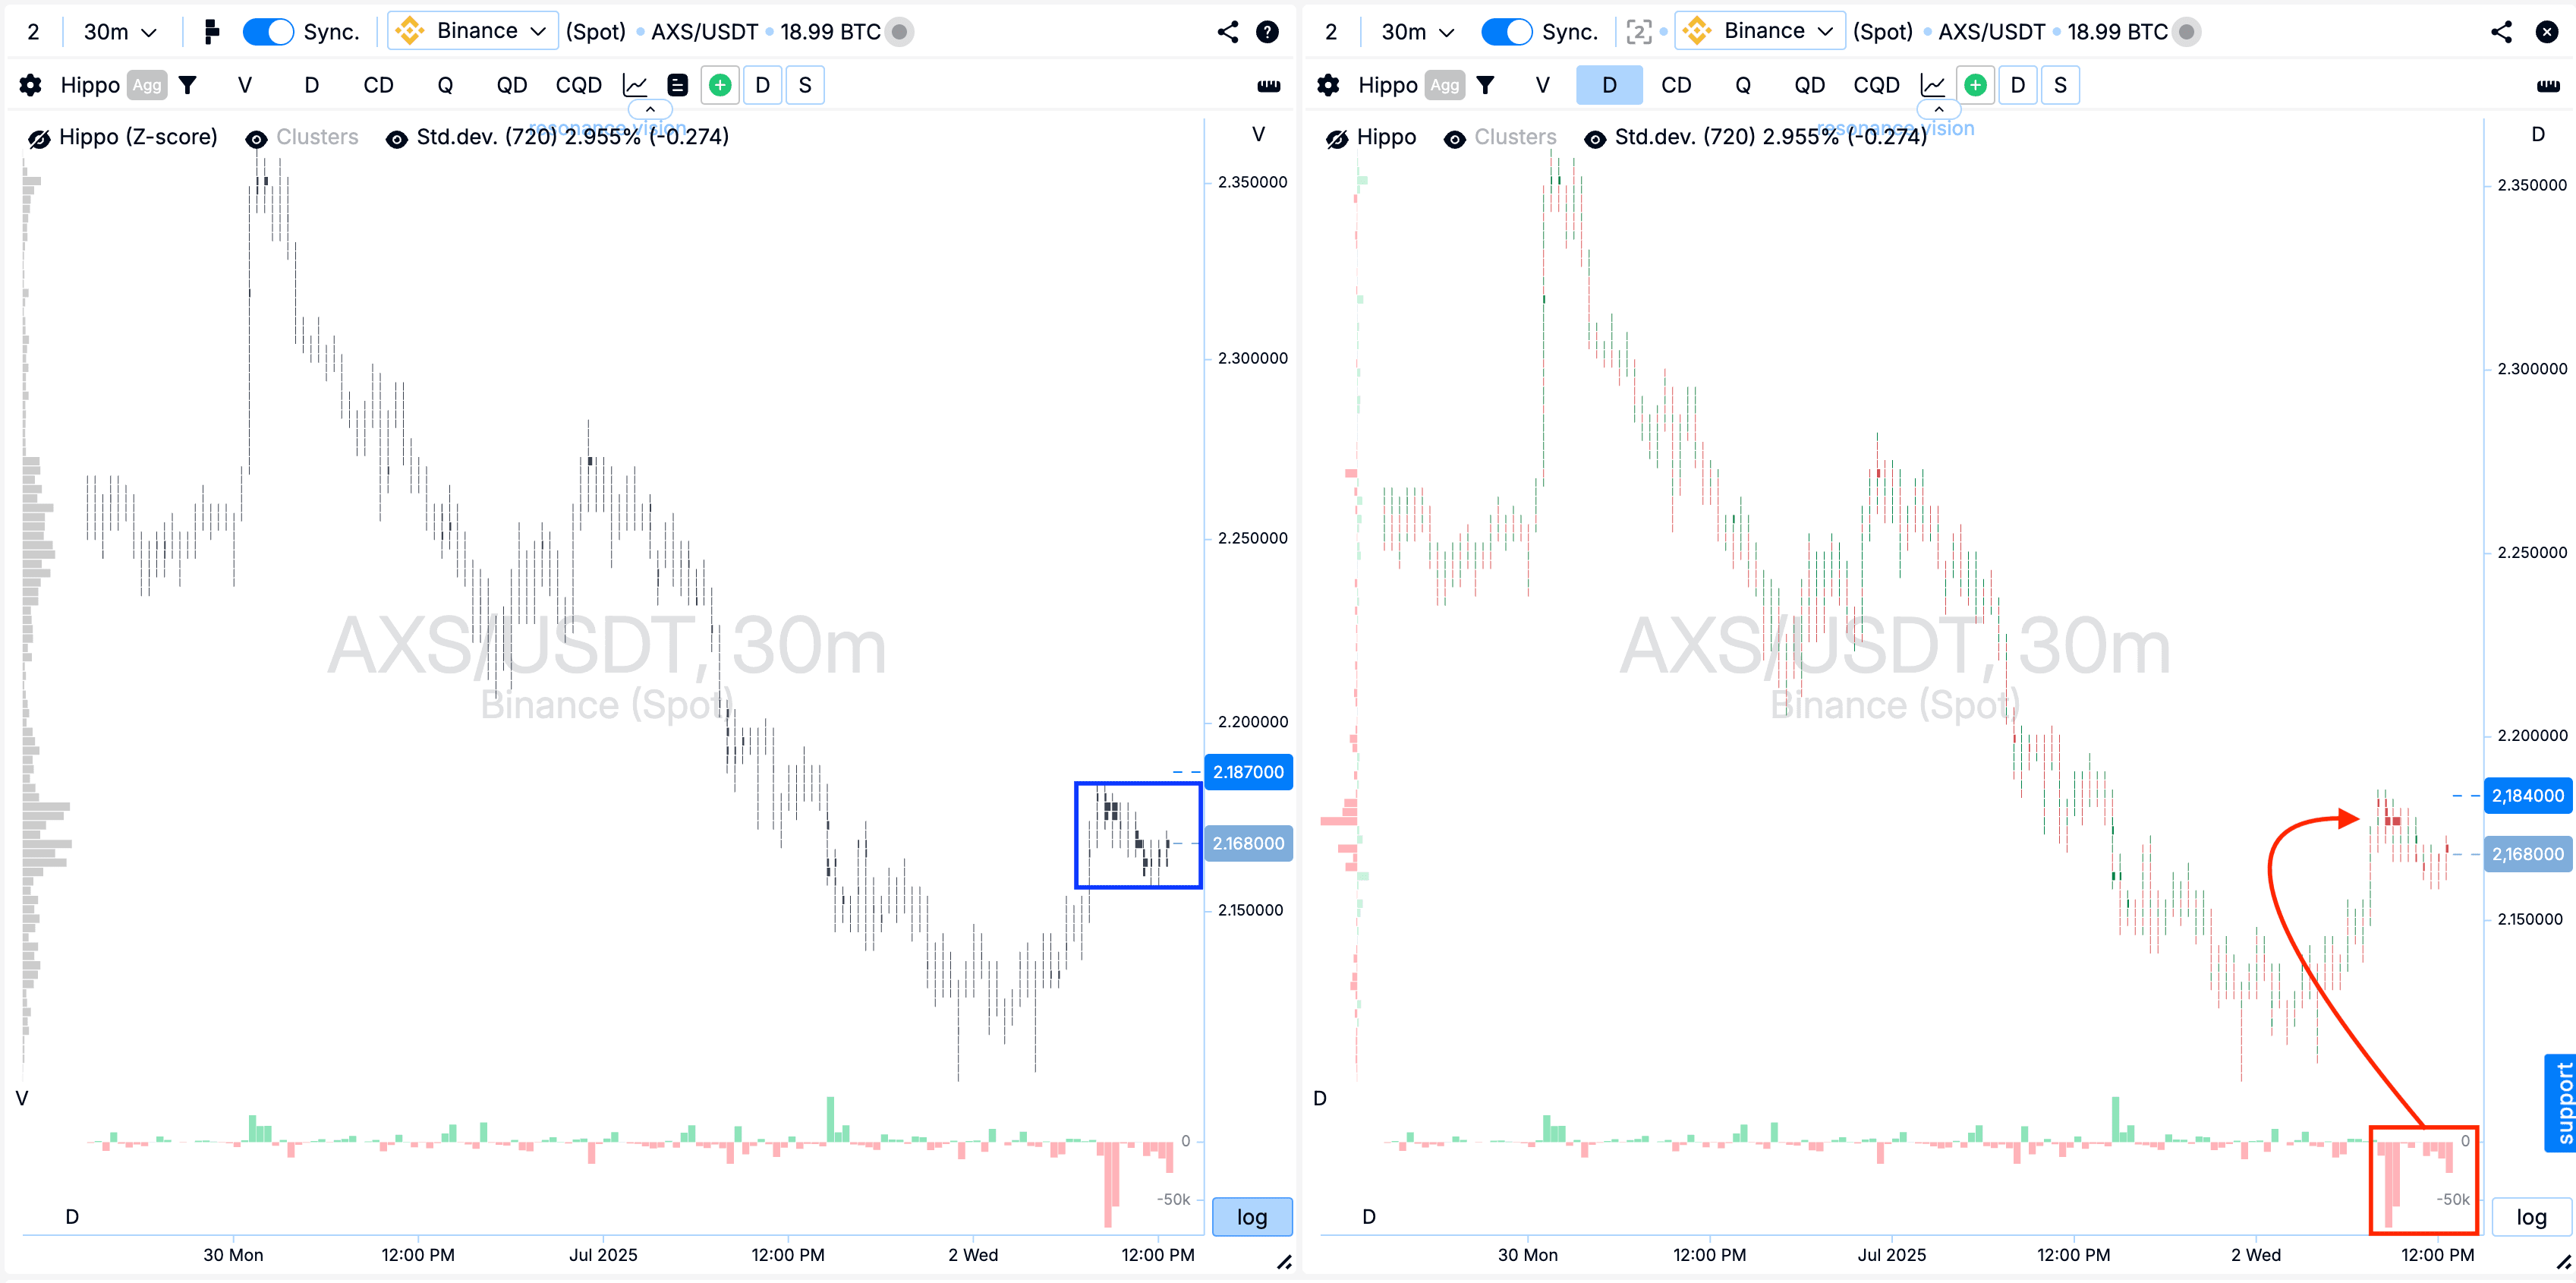
Cluster chart: I marked the price range in which clusters by volume began to form (blue rectangle). The volumes were accompanied by active sales (red rectangle with an arrow), but the price practically did not react to them - the expected decline did not occur. This may indicate signs of a local deficit and inefficiency on the part of sellers.
In the Dashboard
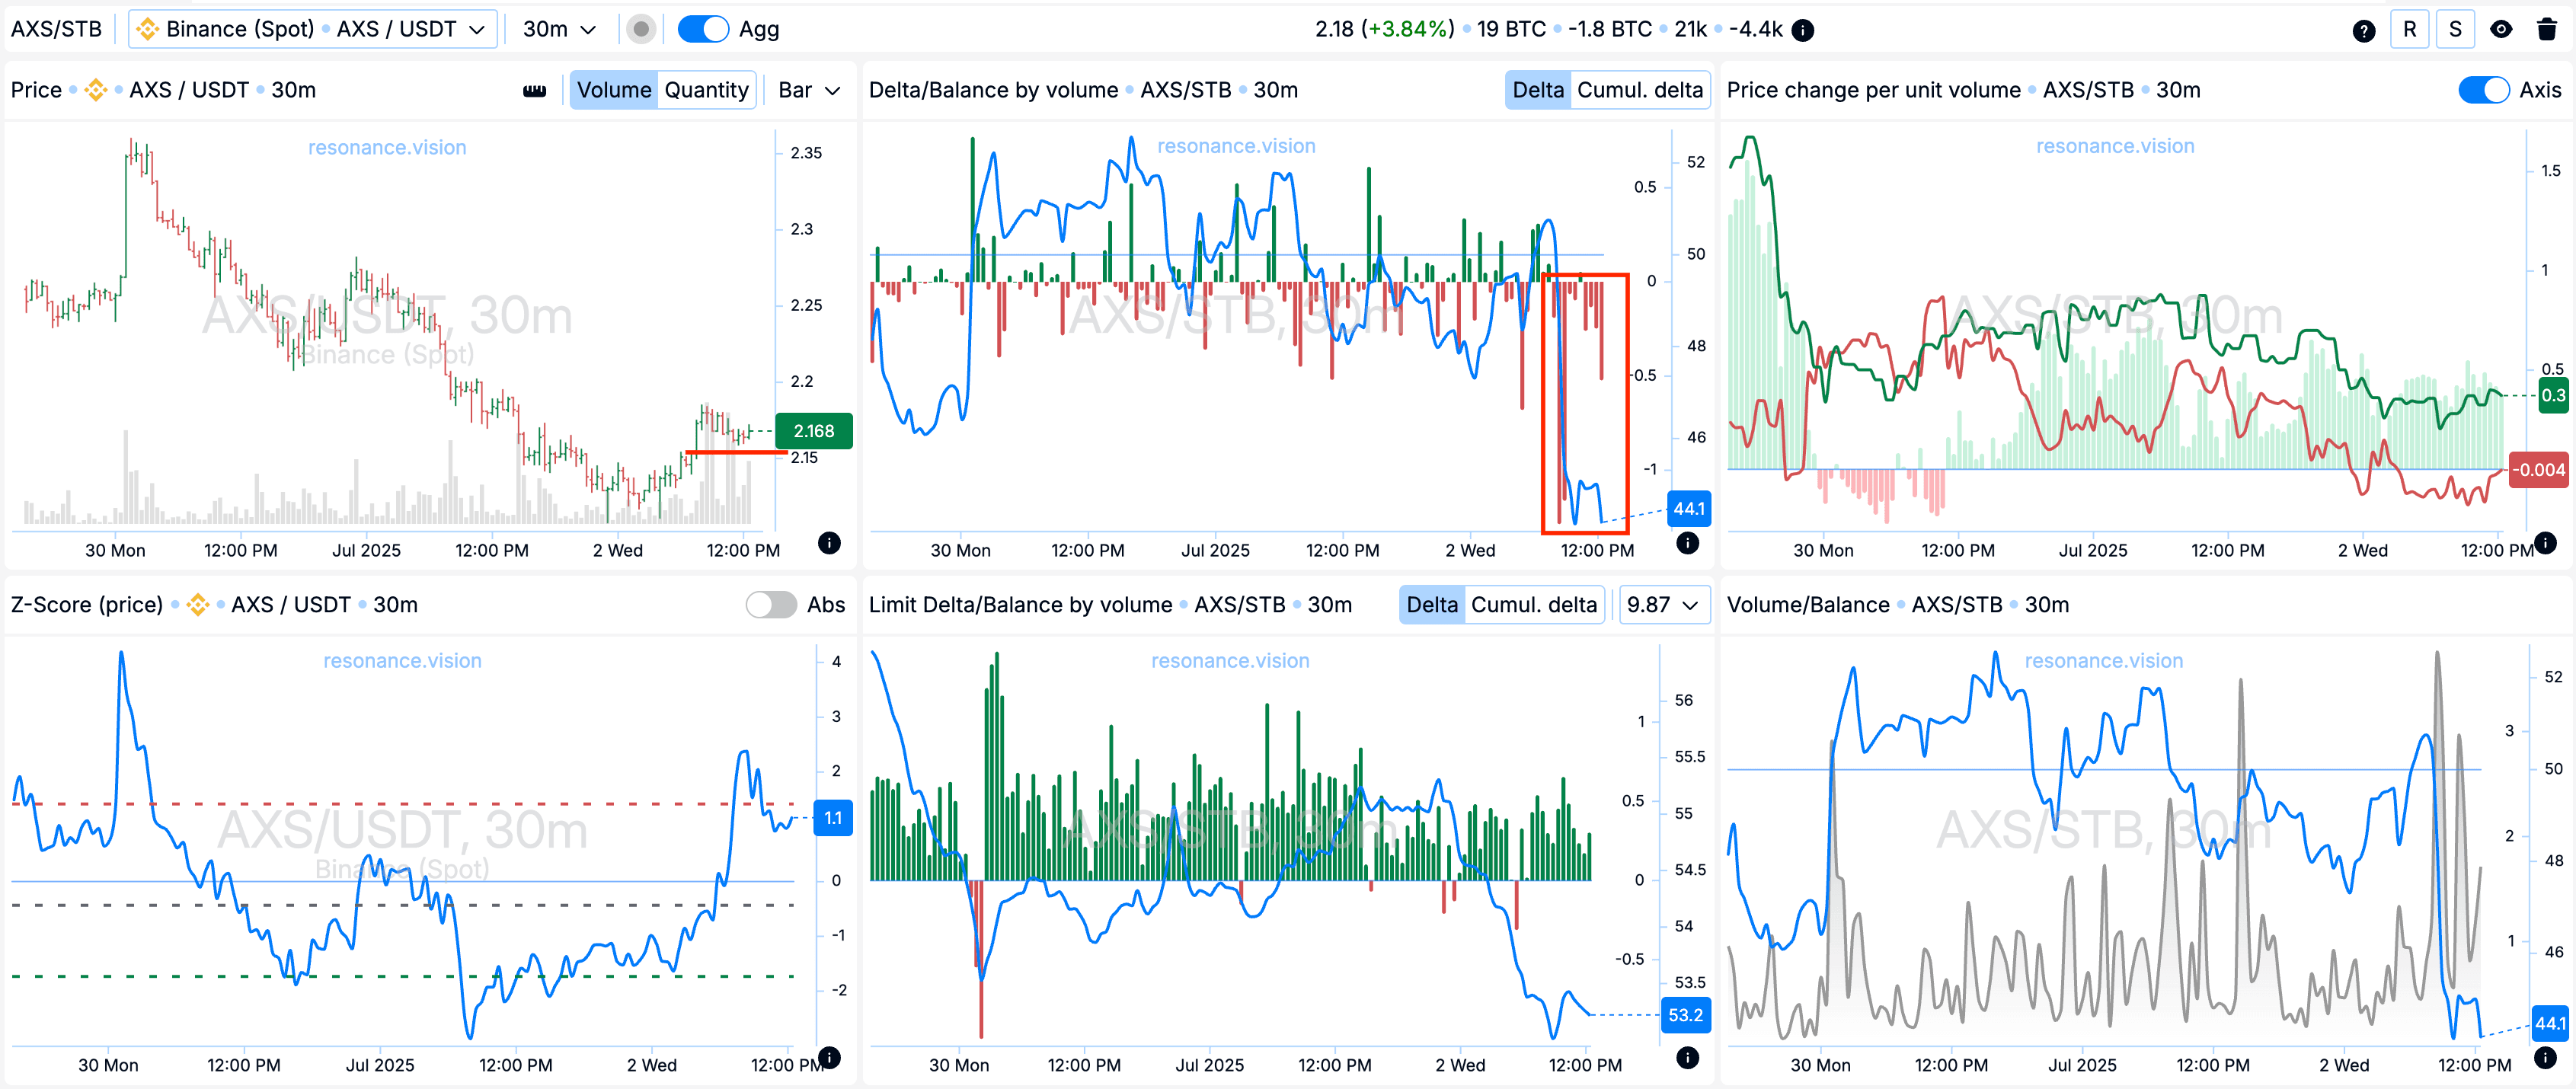
Delta/Balance by volume: Assessing the aggregated data, I noted the predominance of market sales of the ticker for all pairs and on all exchanges (red rectangle). At the same time, the price does not show the expected decline, as I wrote above, which further confirms the hypothesis of a continuing local deficit and strengthens the arguments in favor of opening a long position.
Reasons for exit
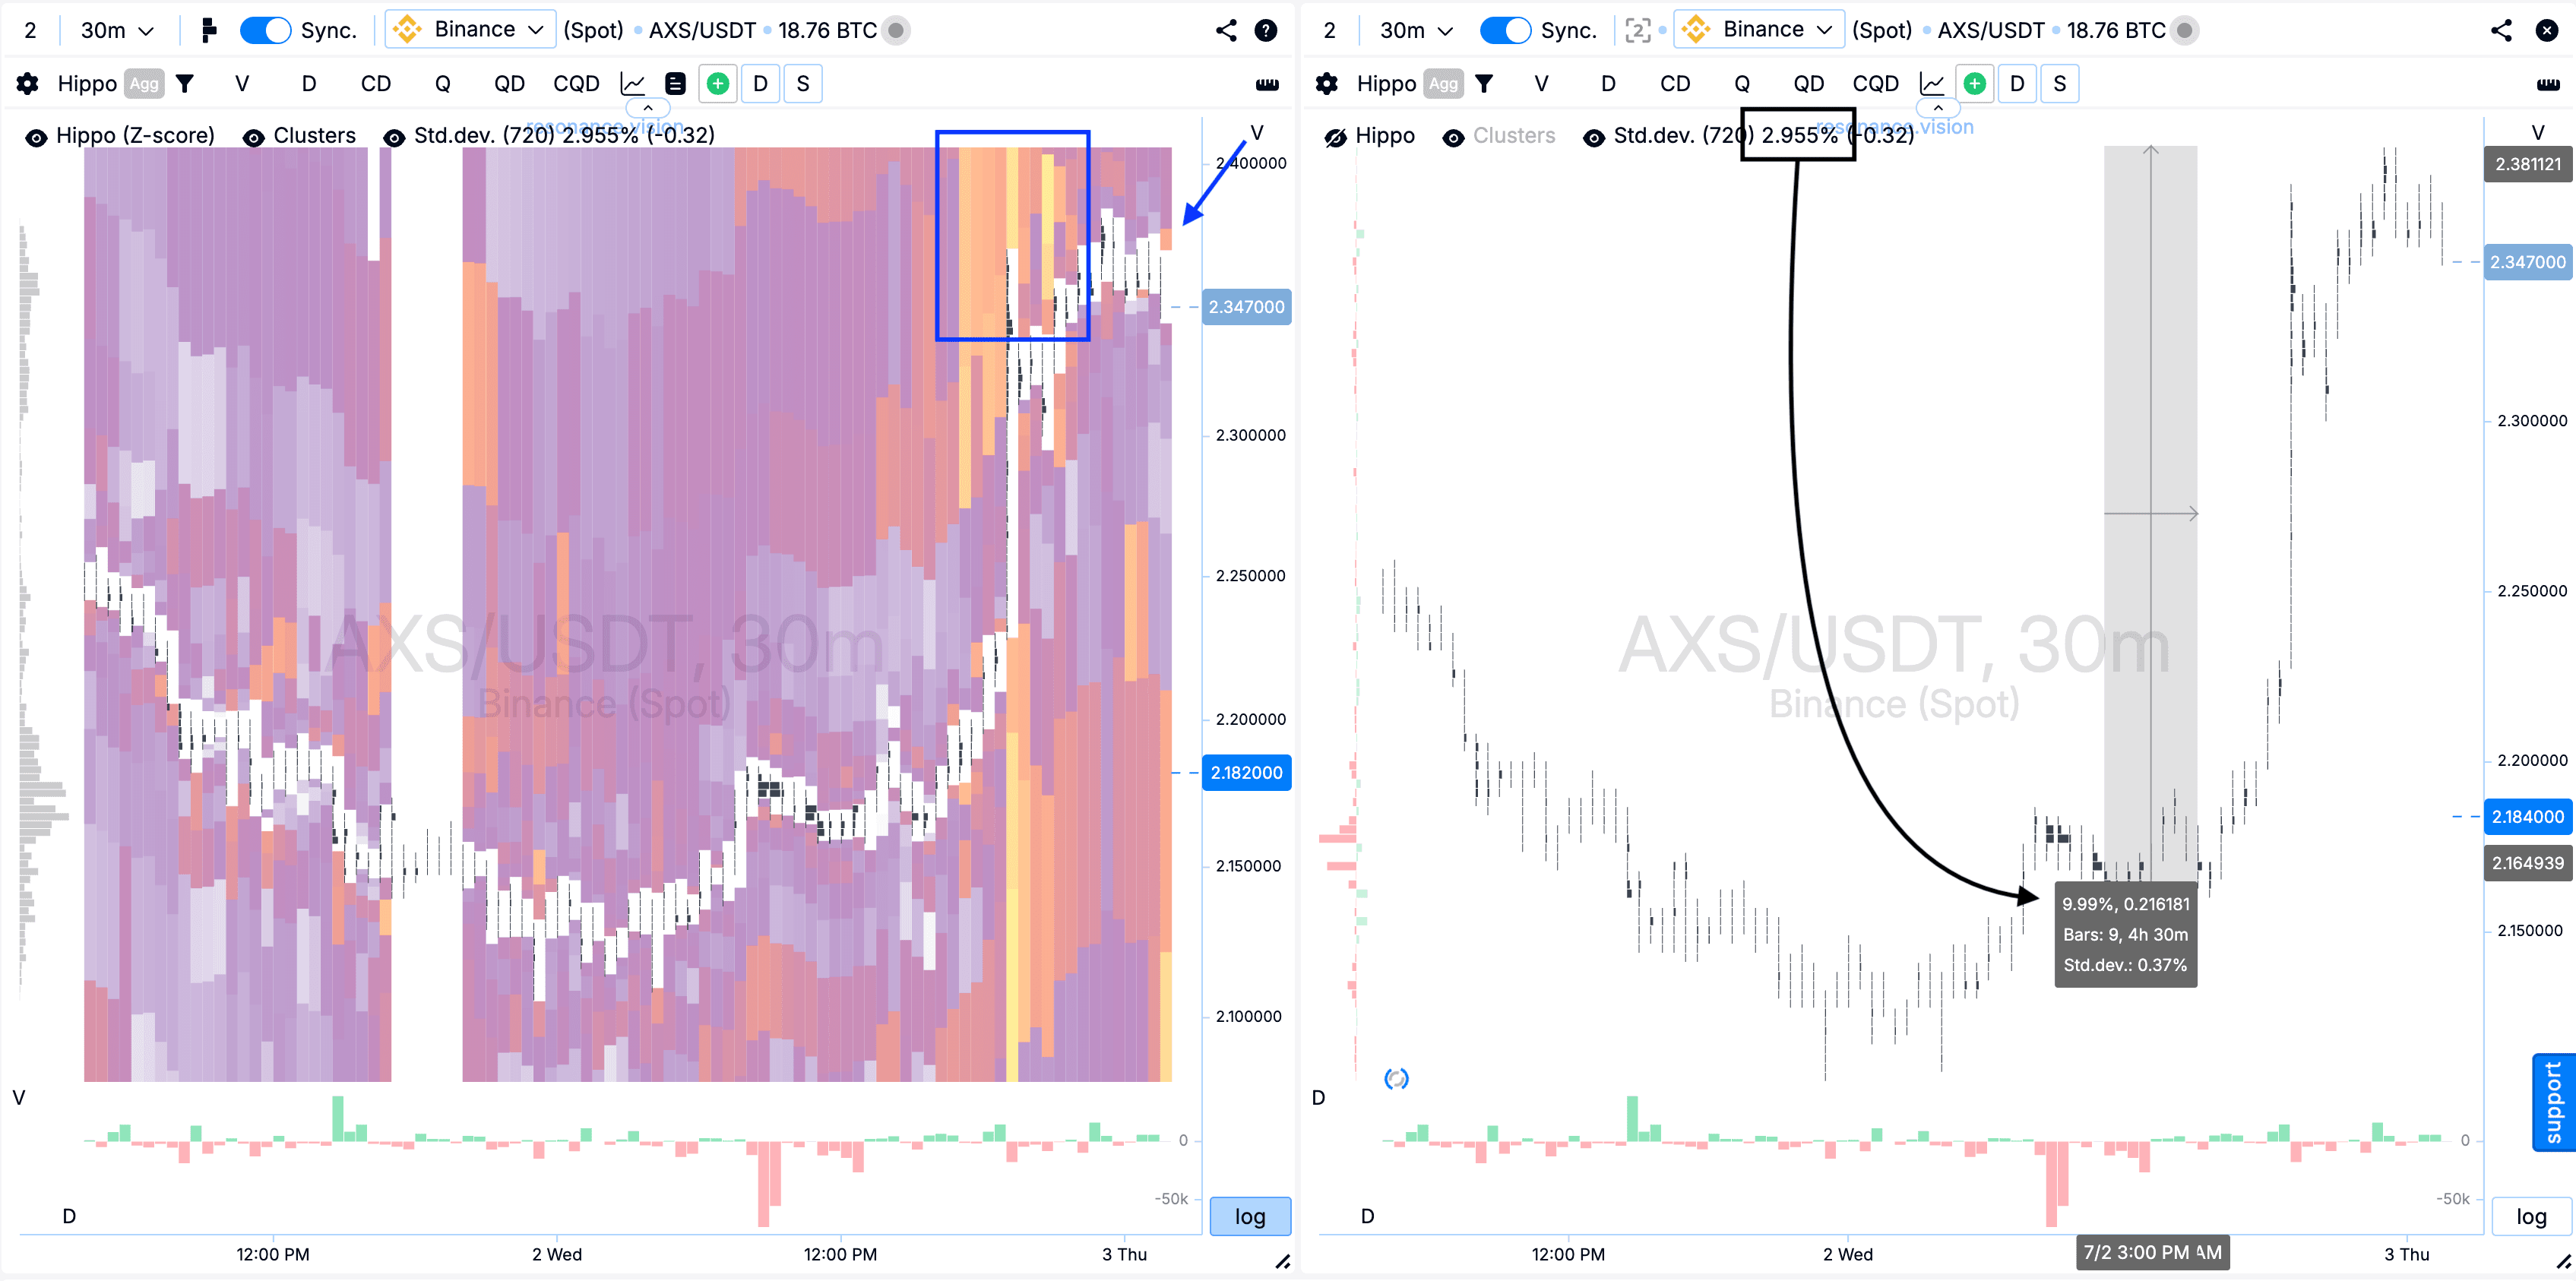
Heat map in Z-Score mode: A clearly defined limit density formed above, which market purchases ran into (blue rectangle). Also, new local limit clusters began to appear above the current price (indicated by the blue arrow), which increases the likelihood of local resistance formation.
From the entry point, the price went up by more than 10%, which exceeds 3 standard movements (one is 2.955%), which confirms the abnormality of the movement (black rectangle with an arrow).
The moment became an excellent basis for fixing the position, which was done.
Result
As a result, I fixed a profit of +160.85%.

Conclusion
In this deal, the key role was played by the ability to assess the behavior of market participants and understand where market pressure is ineffective. Despite aggressive sales, the price held steady, which allowed us to form a hypothesis about a local deficit.
At the exit, the opposite picture: the price ran into limit resistance, and an abnormal movement of more than 3 standard deviations was also achieved. Timely fixation allowed us to fix a confident profit and avoid a possible reversal. The deal highlights the importance of assessing volume, market reaction and limit activity in combination.
Follow new articles in our telegram channel.
No need to invent complex schemes and look for the "grail". Use the Resonance platform tools.
Register via the link — get a bonus and start earning:
OKX | BingX | KuCoin.
Promo code TOPBLOG gives you a 10% discount on any Resonance tariff plan.
Recommended articles


