BIO +1870.24% (Resonance Directional Strategy)

Analysis of the BIO/USDT trade using cluster analysis, delta and Z-Score. It is shown how the imbalance between buyers and sellers helped to form a trading hypothesis, and the increase in volatility and the formation of large clusters became a signal to take profits. A practical example of complex analysis, ending with a result of +1870.24%.
Table of contents

Coin: BIO/USDT
Risk: High
Skill level: Beginner
Entry reasons
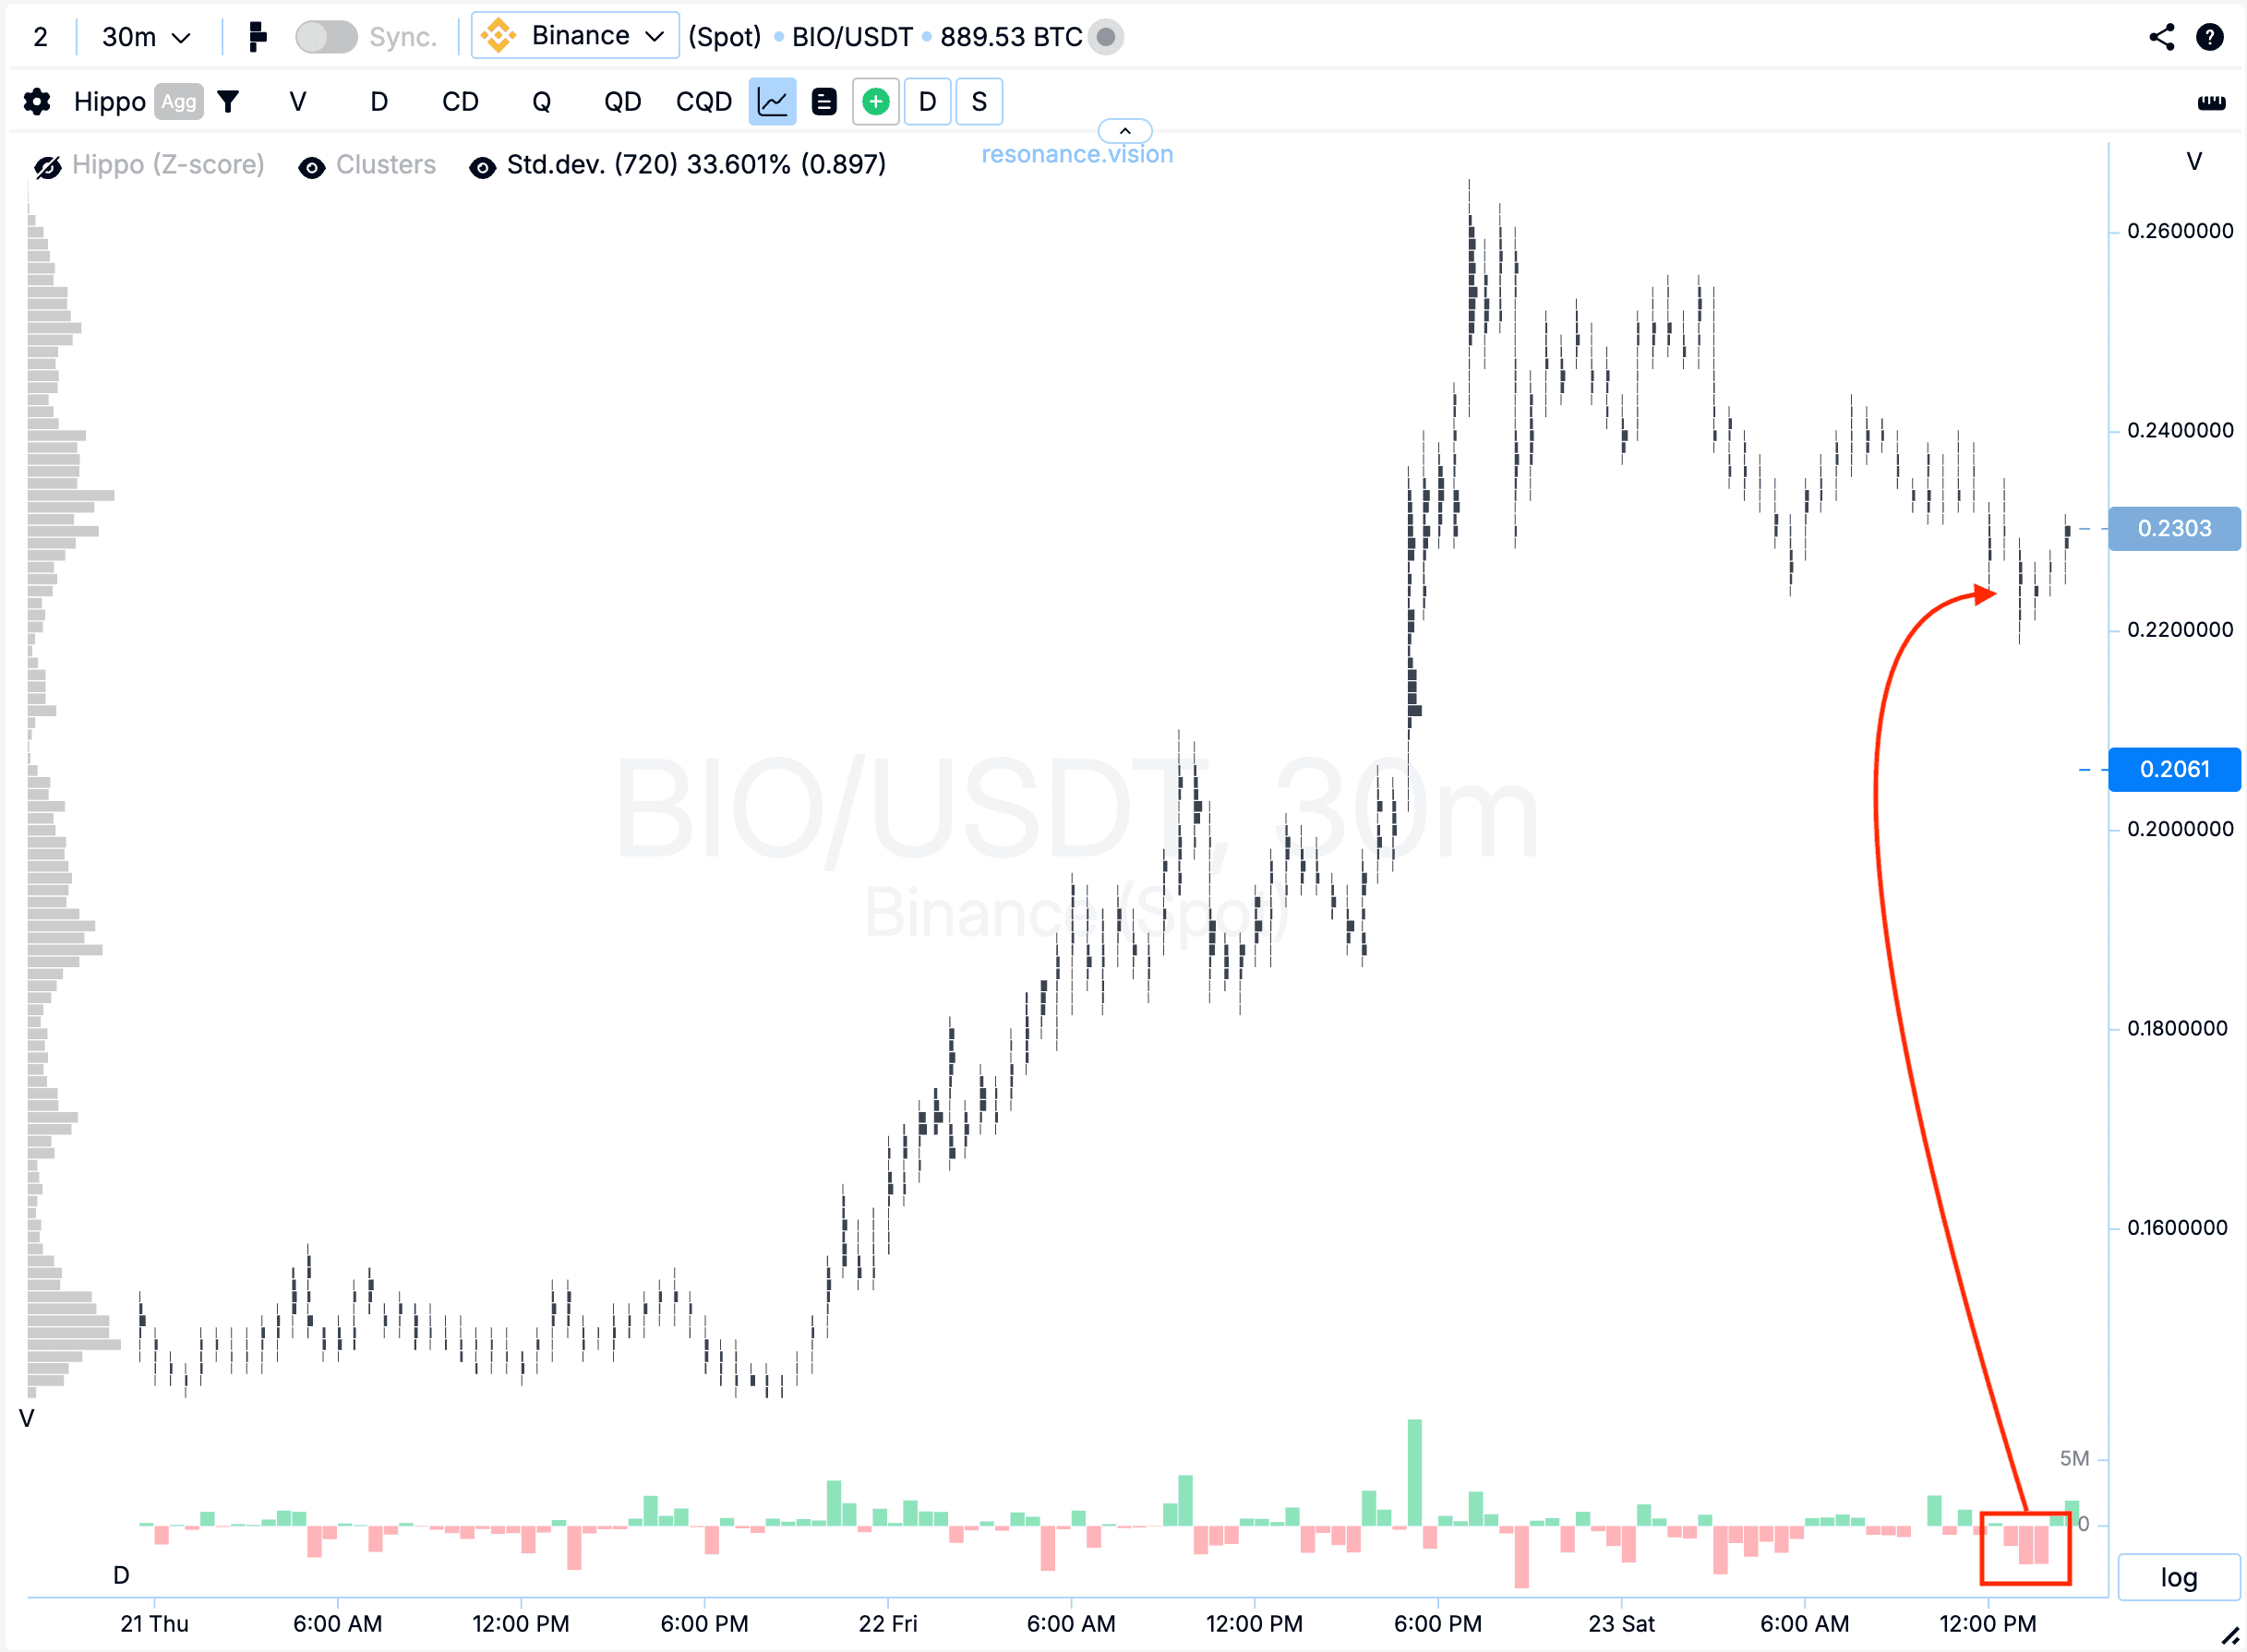
Cluster chart: Despite the high risk and elevated volatility, it was noticeable that large selling did not put significant pressure on price (red rectangle and arrow). This suggests continued buyer interest and signs of a local shortage.
In the Dashboard
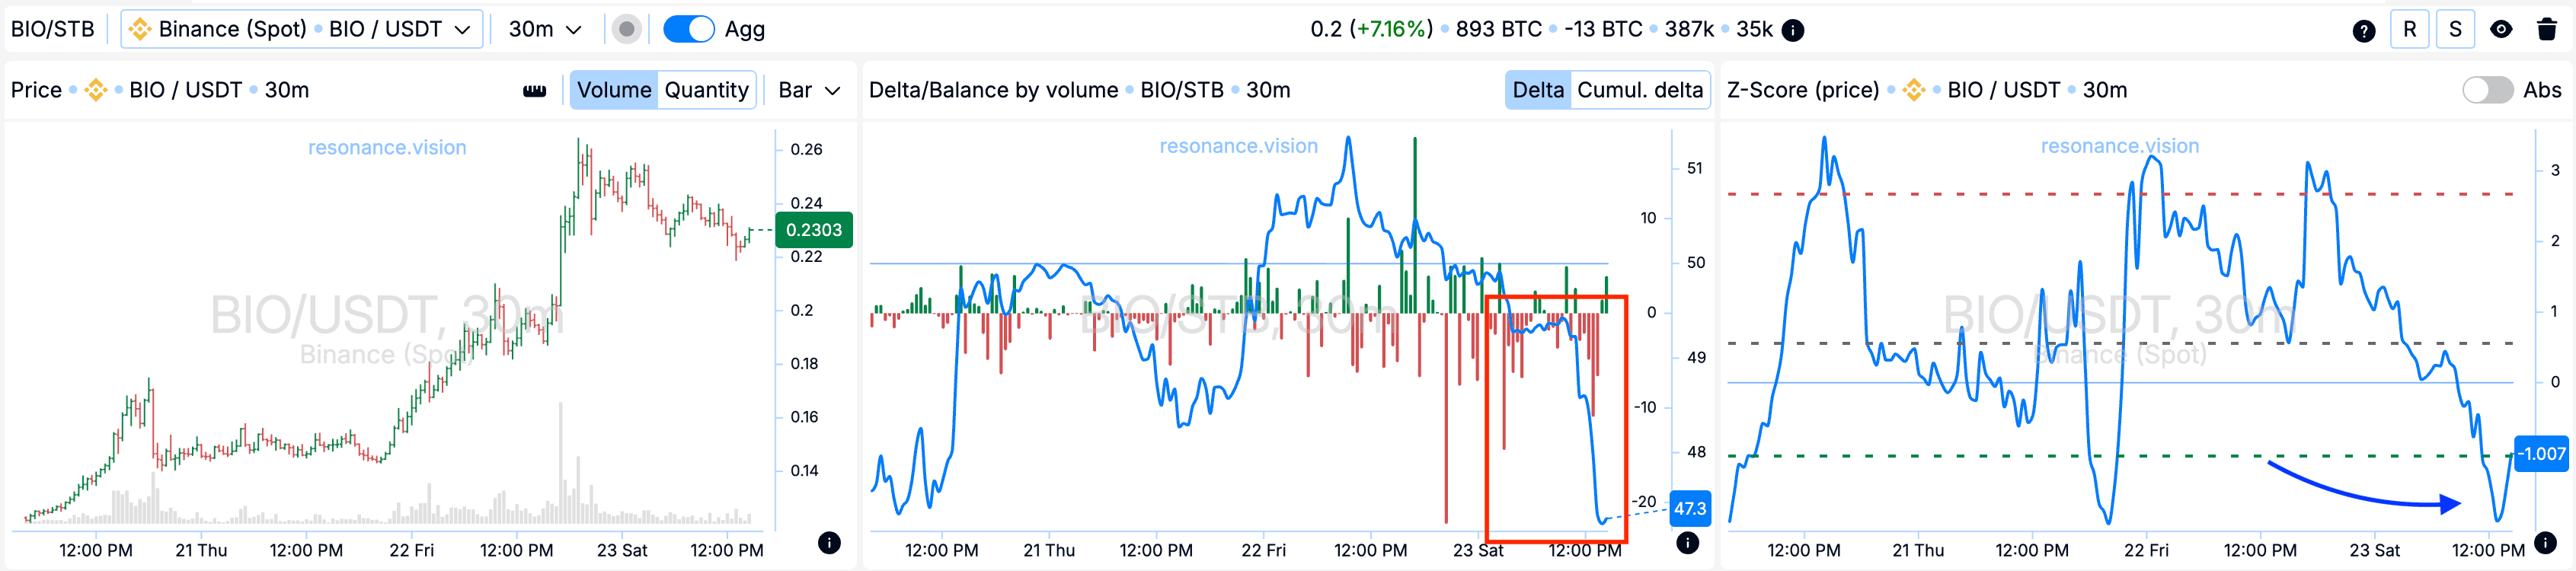
Delta / Volume balance: Aggregated data confirmed what was seen on the cluster chart. Despite selling dominance and balance shifting toward sellers (red rectangle), the price was no longer showing significant declines.
Z-Score (price): Additionally, a downward price deviation beyond the lower percentile zone was recorded — a rare occurrence for this asset (blue arrow).
Exit reasons
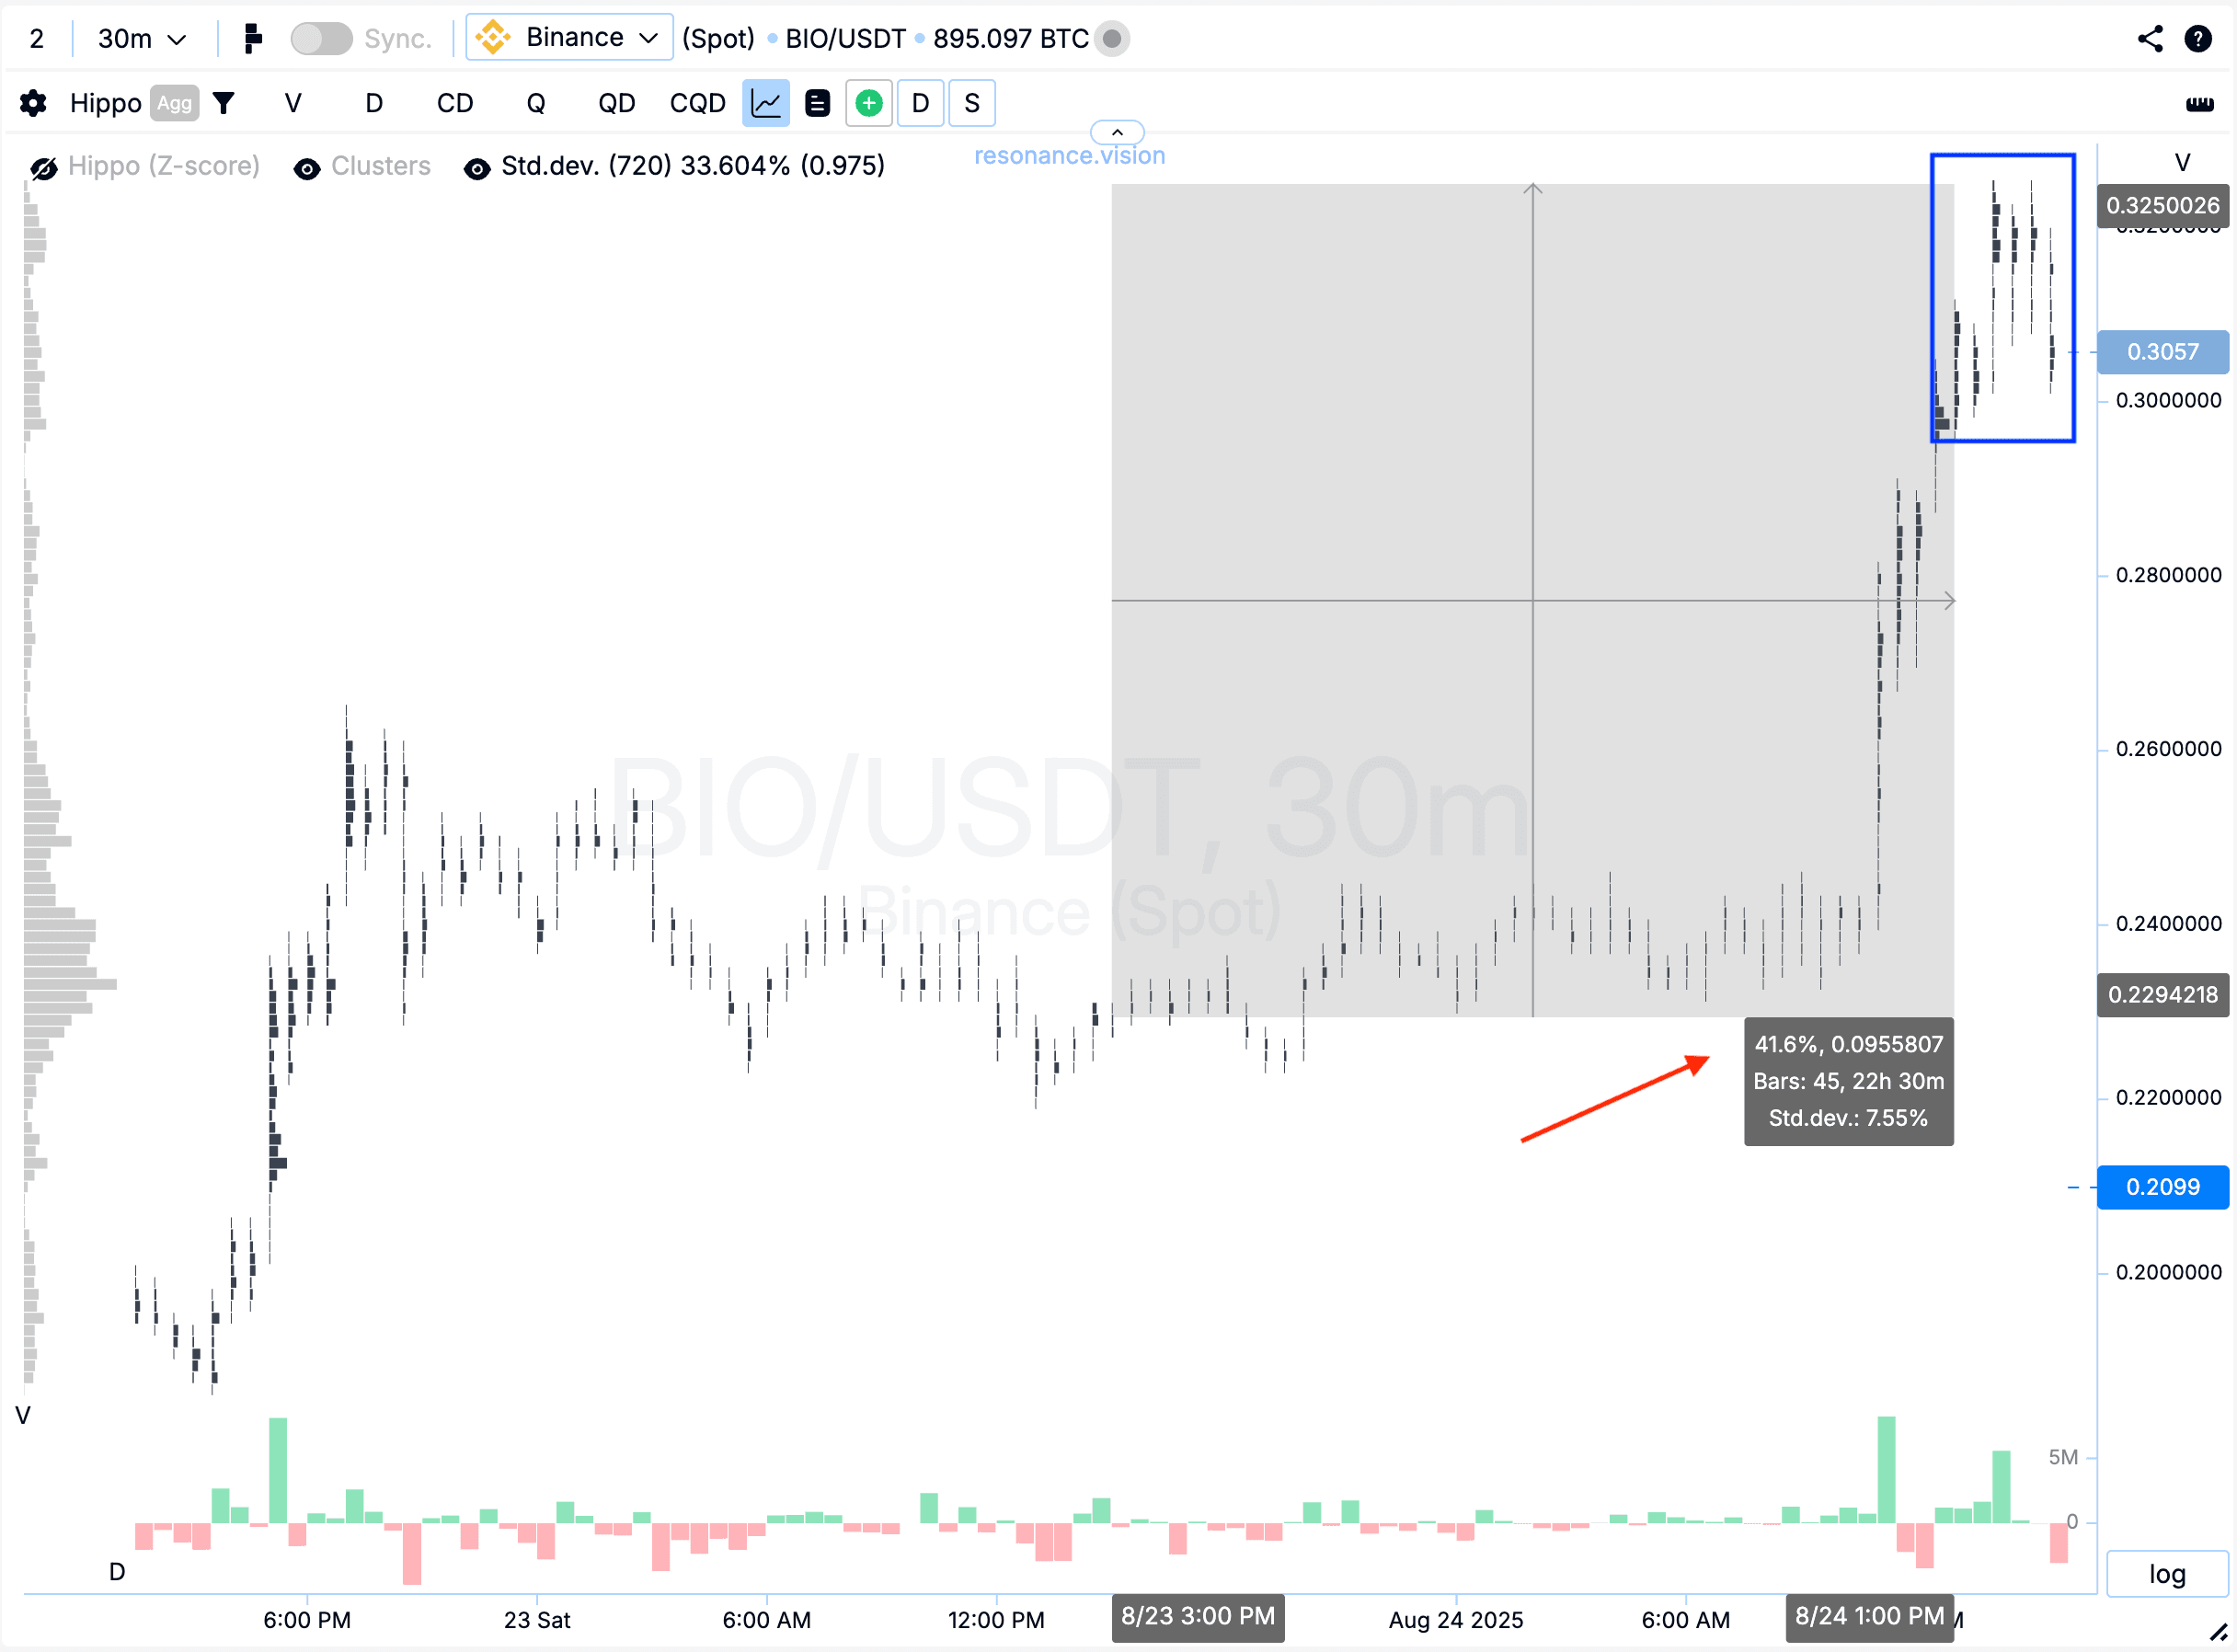
Cluster chart: Noticeable volume clusters formed at the top, and volatility increased in the trading range (blue rectangle). There was also a strong price move (red arrow). In such a situation, fixing the position becomes a rational decision, since further holding carries increasing risk.
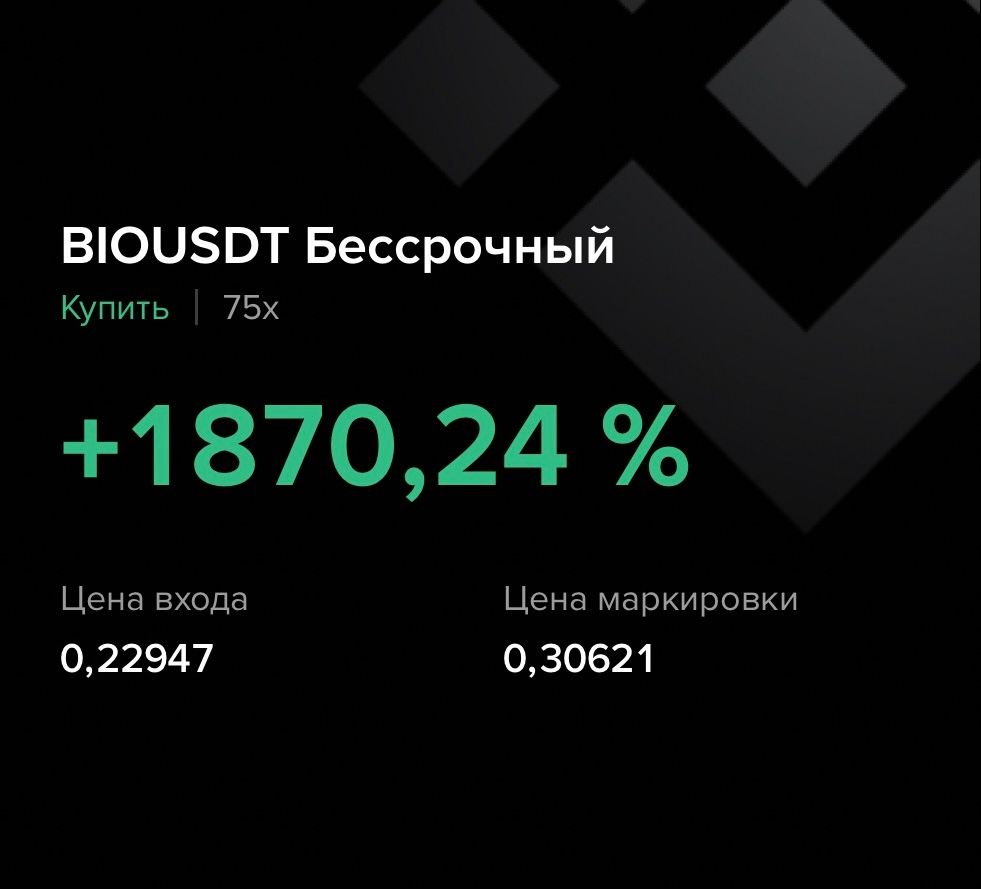
Result: +1870.24% profit.
Conclusion
This trade is a clear example of how careful observation of the imbalance between buyers and sellers can shape a strong trading hypothesis. Despite heavy selling, the price did not show significant declines, pointing to buyer interest and the presence of shortage. An additional factor was the rare Z-Score deviation beyond the lower percentile zone, which strengthened the case for a long entry.
On exit, the key factors were the formation of volume clusters at the top and growing volatility, which together with the impulsive move signaled it was time to lock in gains.
This approach emphasizes the value of a comprehensive analysis: combining cluster charts, aggregated data, and statistical indicators makes it possible to find quality entry and exit points while managing risk effectively.
Follow new insights in our telegram channel.
No need to invent complex schemes and look for the "grail". Use the Resonance platform tools.
Register via the link — get a bonus and start earning:
OKX | BingX | KuCoin.
Promo code TOPBLOG gives you a 10% discount on any Resonance tariff plan.
Recommended articles


