CFX +53.5% (Directional Strategy Resonance)

CFX/USDT is a clear example of how demand works with a local deficit. In this analysis:
🔹 What the cluster chart showed
🔹 Why market sales were ineffective
🔹 How limit orders held the price
🔹 Where the exit was and why it is important
Learn to see such scenarios and take the movement before the reversal. The analysis is suitable for both beginners and those who want to enter and exit more accurately.
Table of contents

Pair: CFX/USDT
Risk: Low
Skill Level: Beginner
Entry Reasons
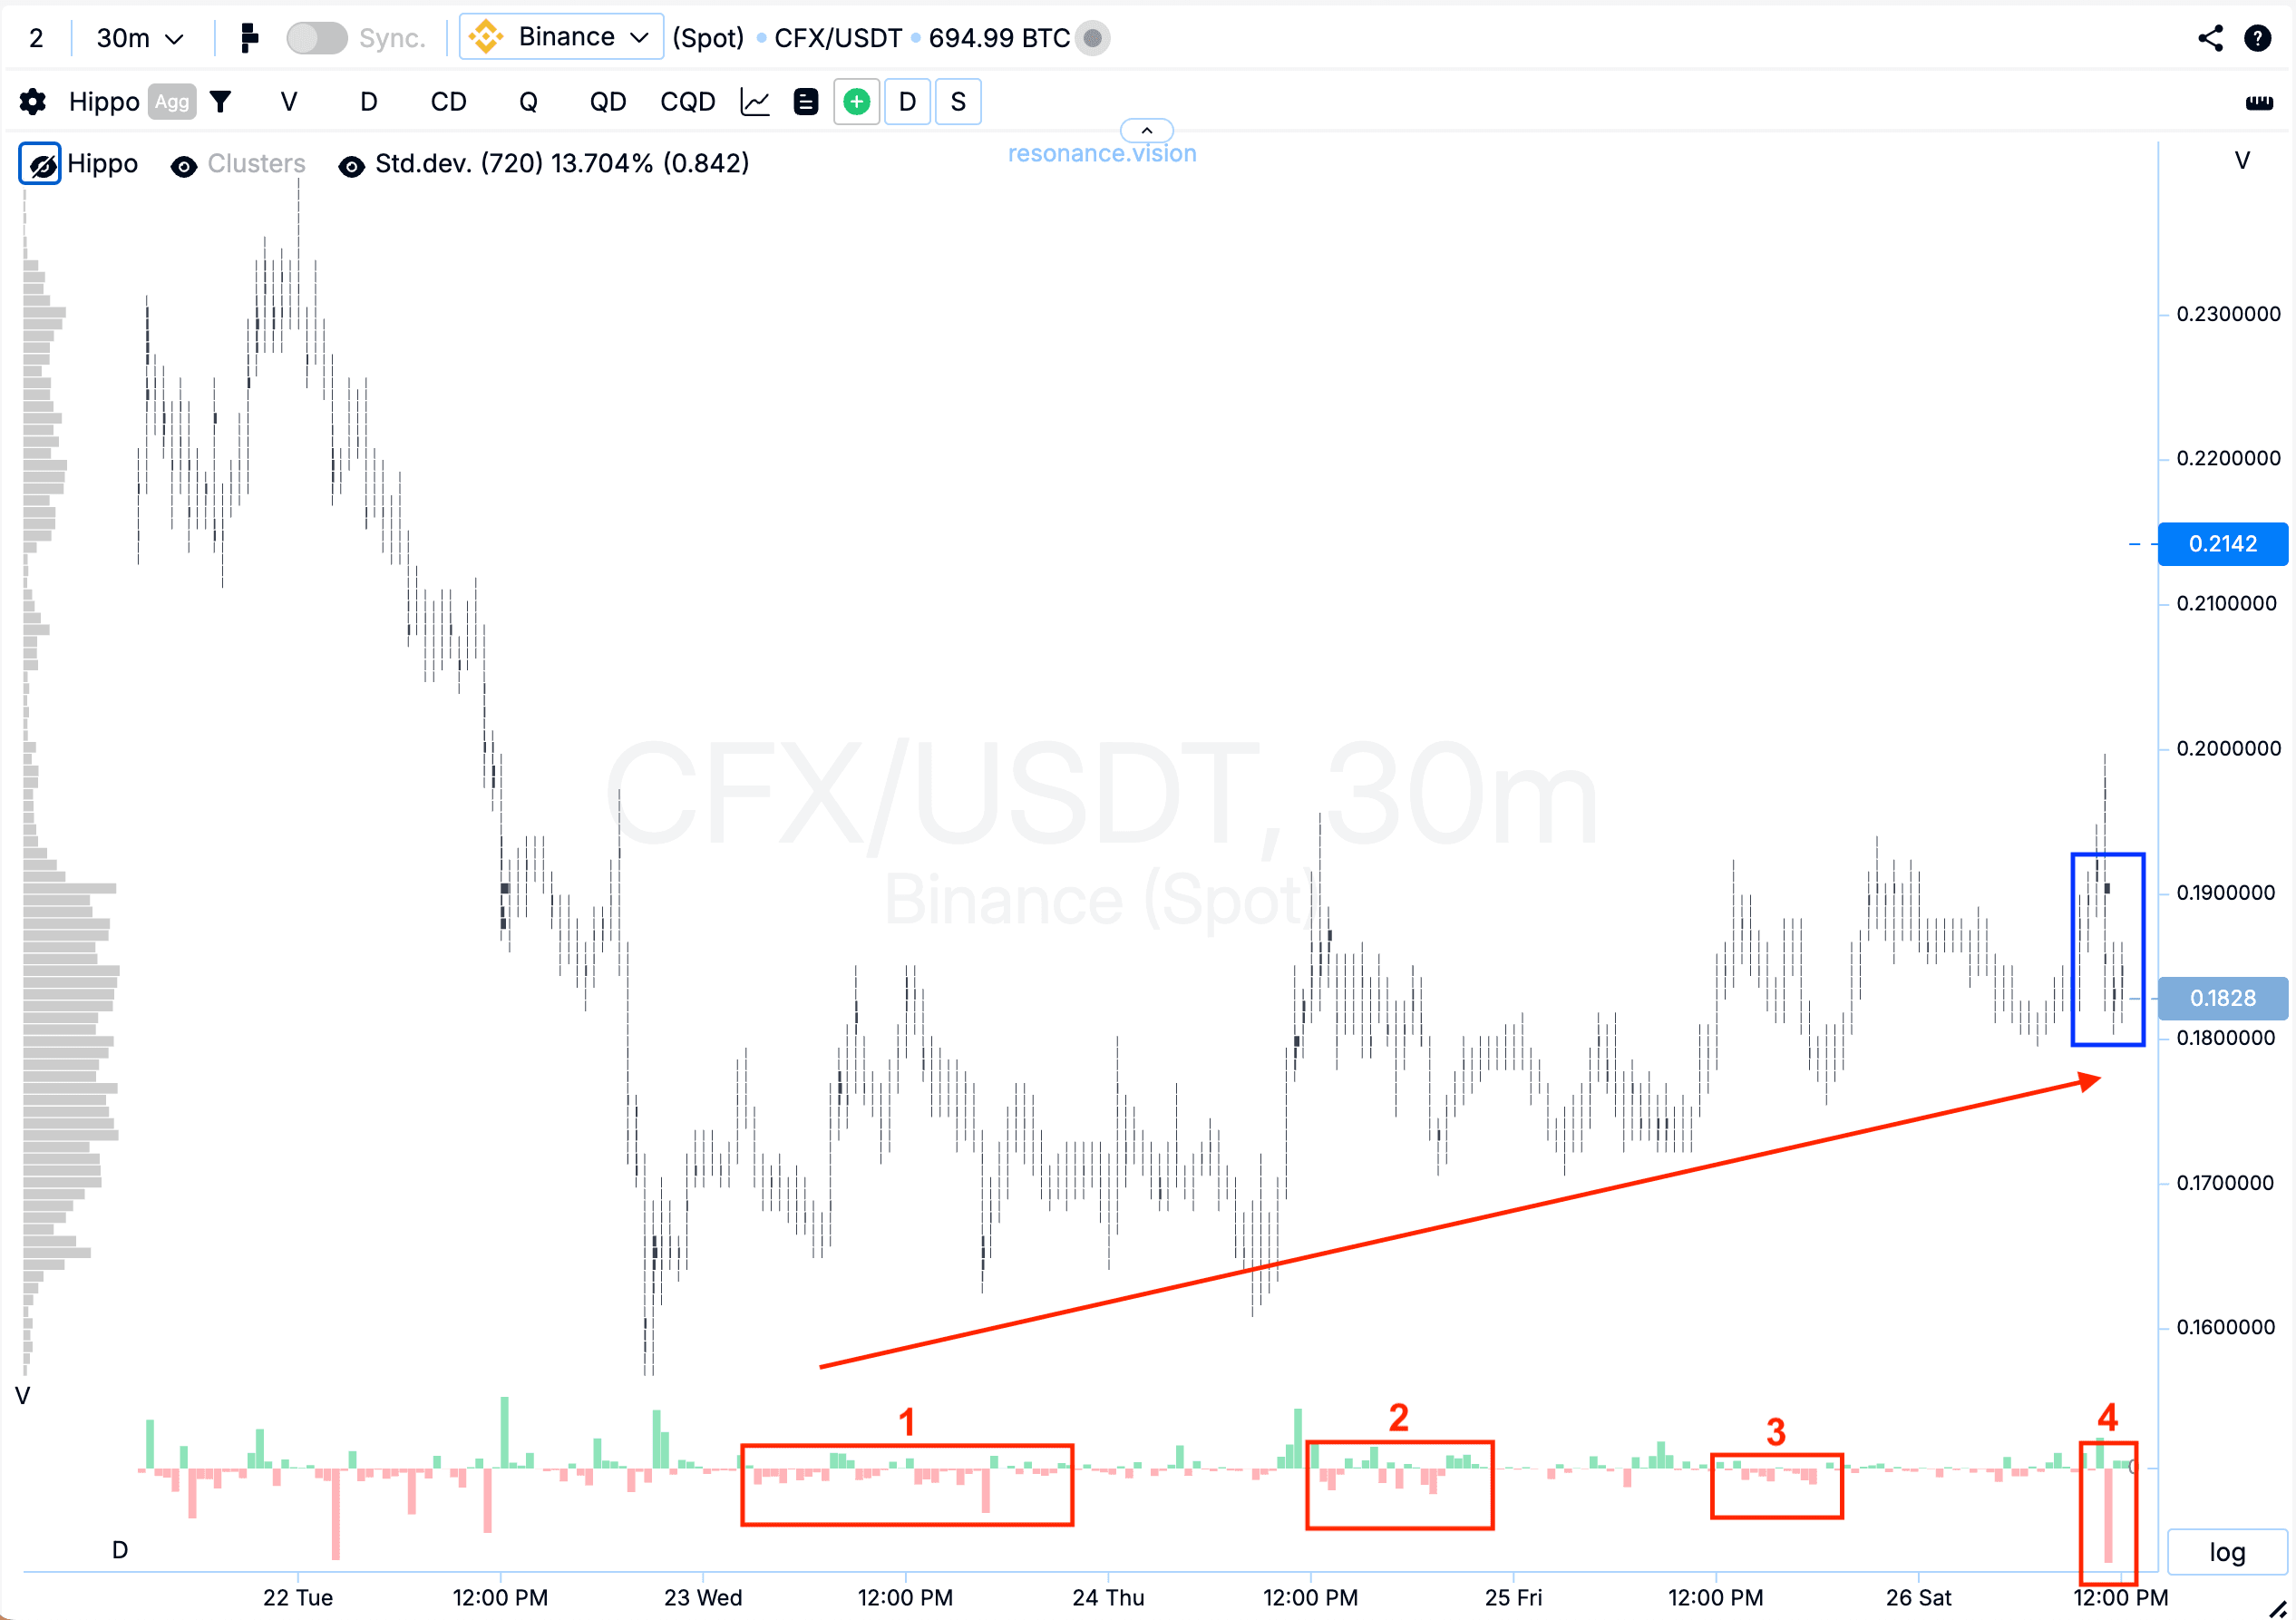
Cluster Chart: In the highlighted areas (rectangles #1, 2, 3), we observe behavior typical of a local supply shortage. During periods of market buying, the price gradually moves higher, while market selling fails to push the price to new local lows within the marked range (red arrow). This suggests signs of a local deficit.
Additionally, a zone with relatively significant volume clusters (blue rectangle) was highlighted, dominated by market selling (red rectangle #4). This further supports the overall picture and confirms the presence of deficit signs.
On the Dashboard
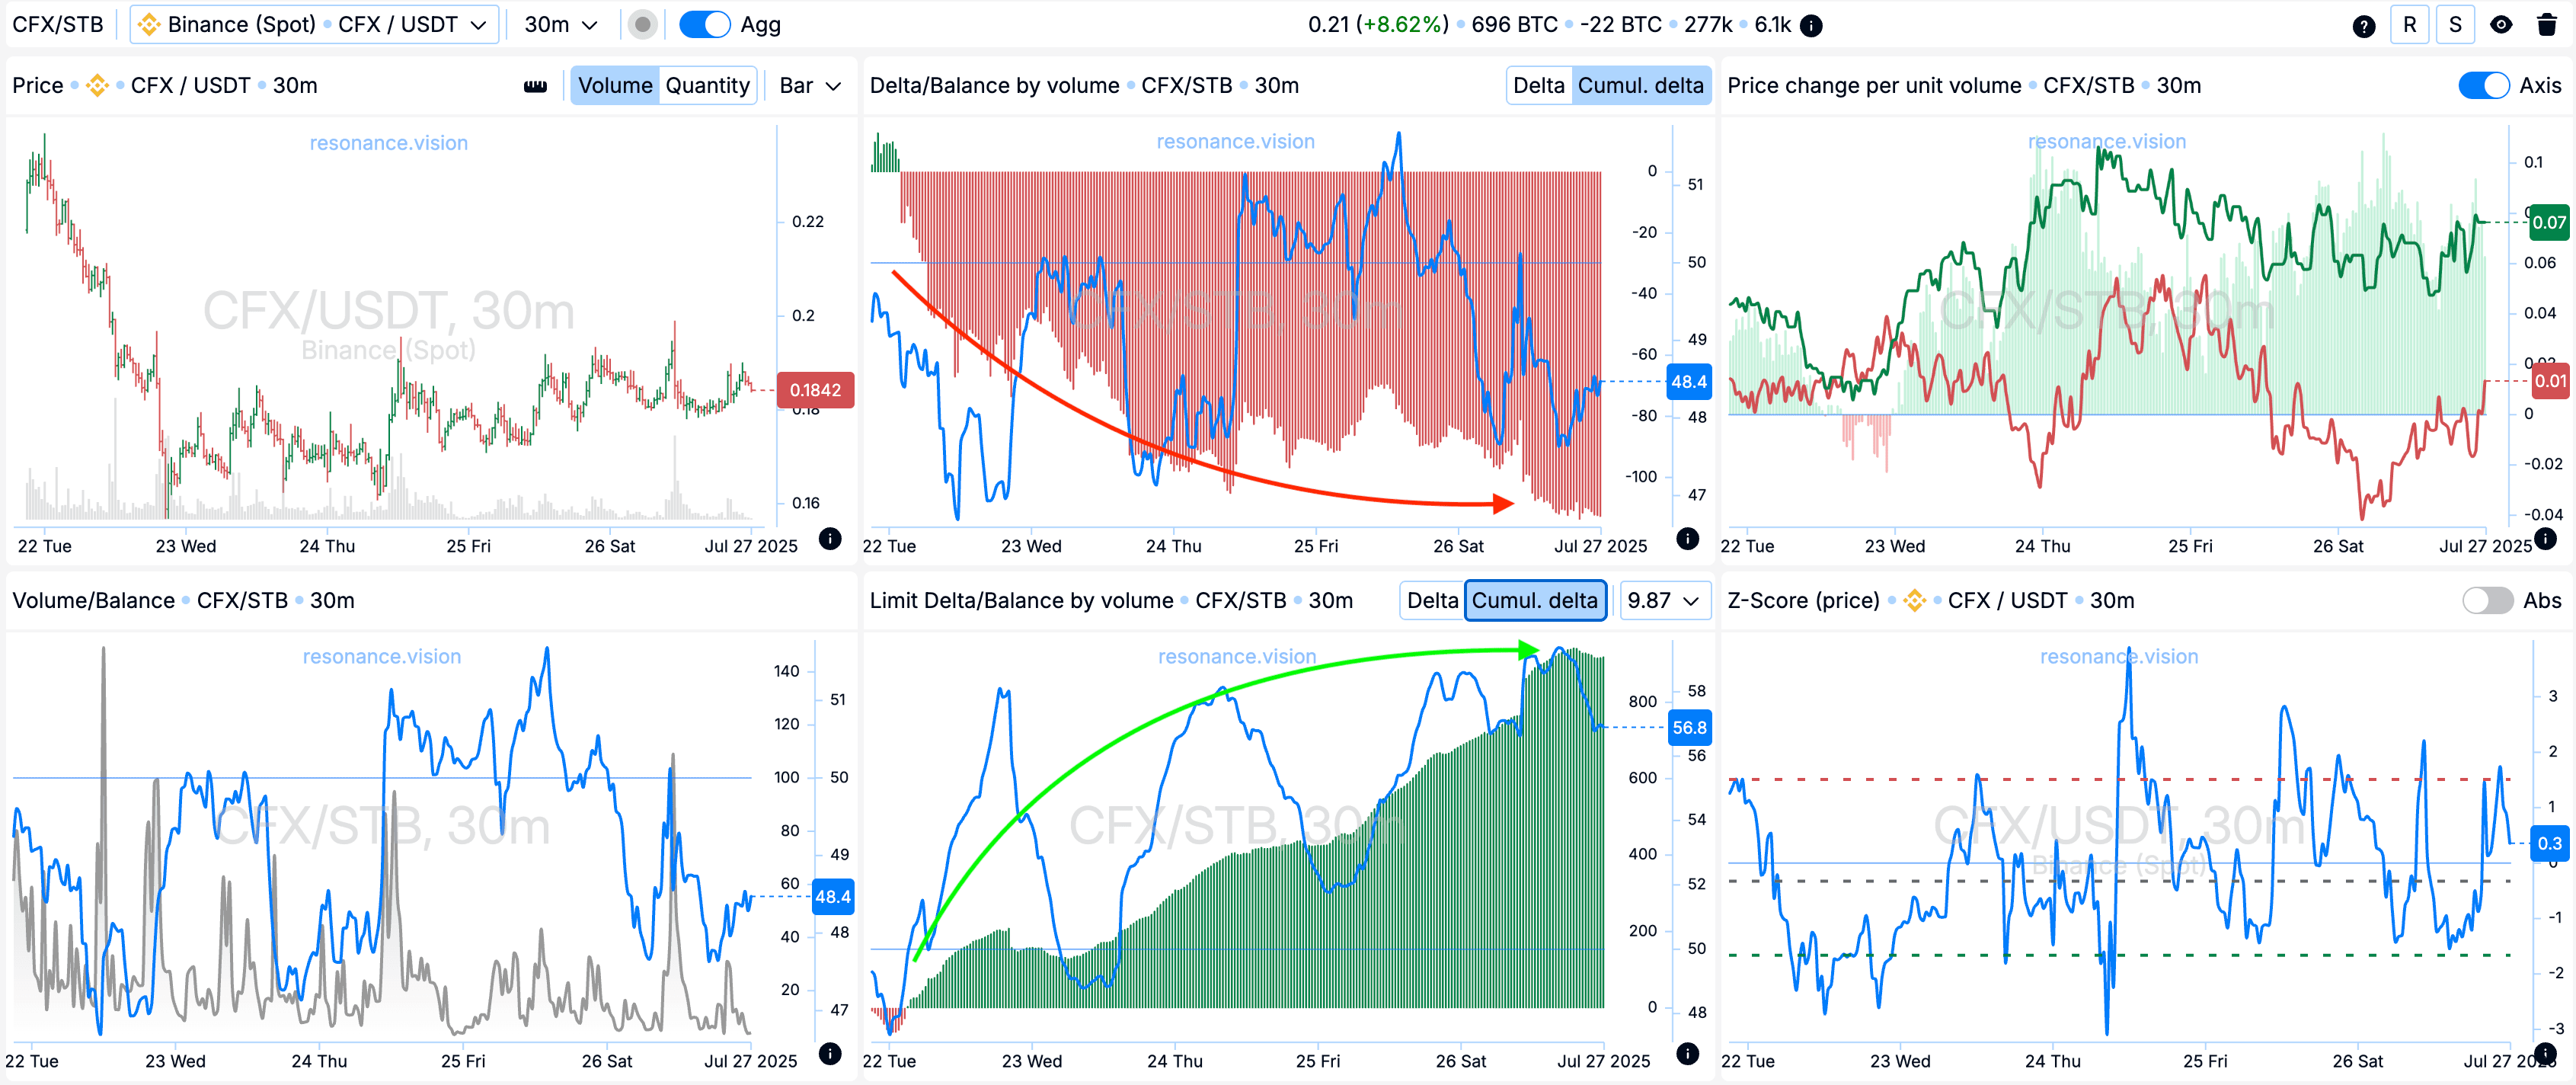
Delta / Volume Balance and Limit Delta: Aggregated data shows a steady dominance of market selling — clearly visible from the cumulative delta histogram (red arrow). However, buy limit orders continue to absorb all incoming volume actively, with more bids constantly being added (green arrow), preventing the price from dropping lower.
This behavior points to inefficient market selling and dominance of limit buyers, strengthening the case for a long position — demand holds the initiative despite selling pressure.
Exit Reasons
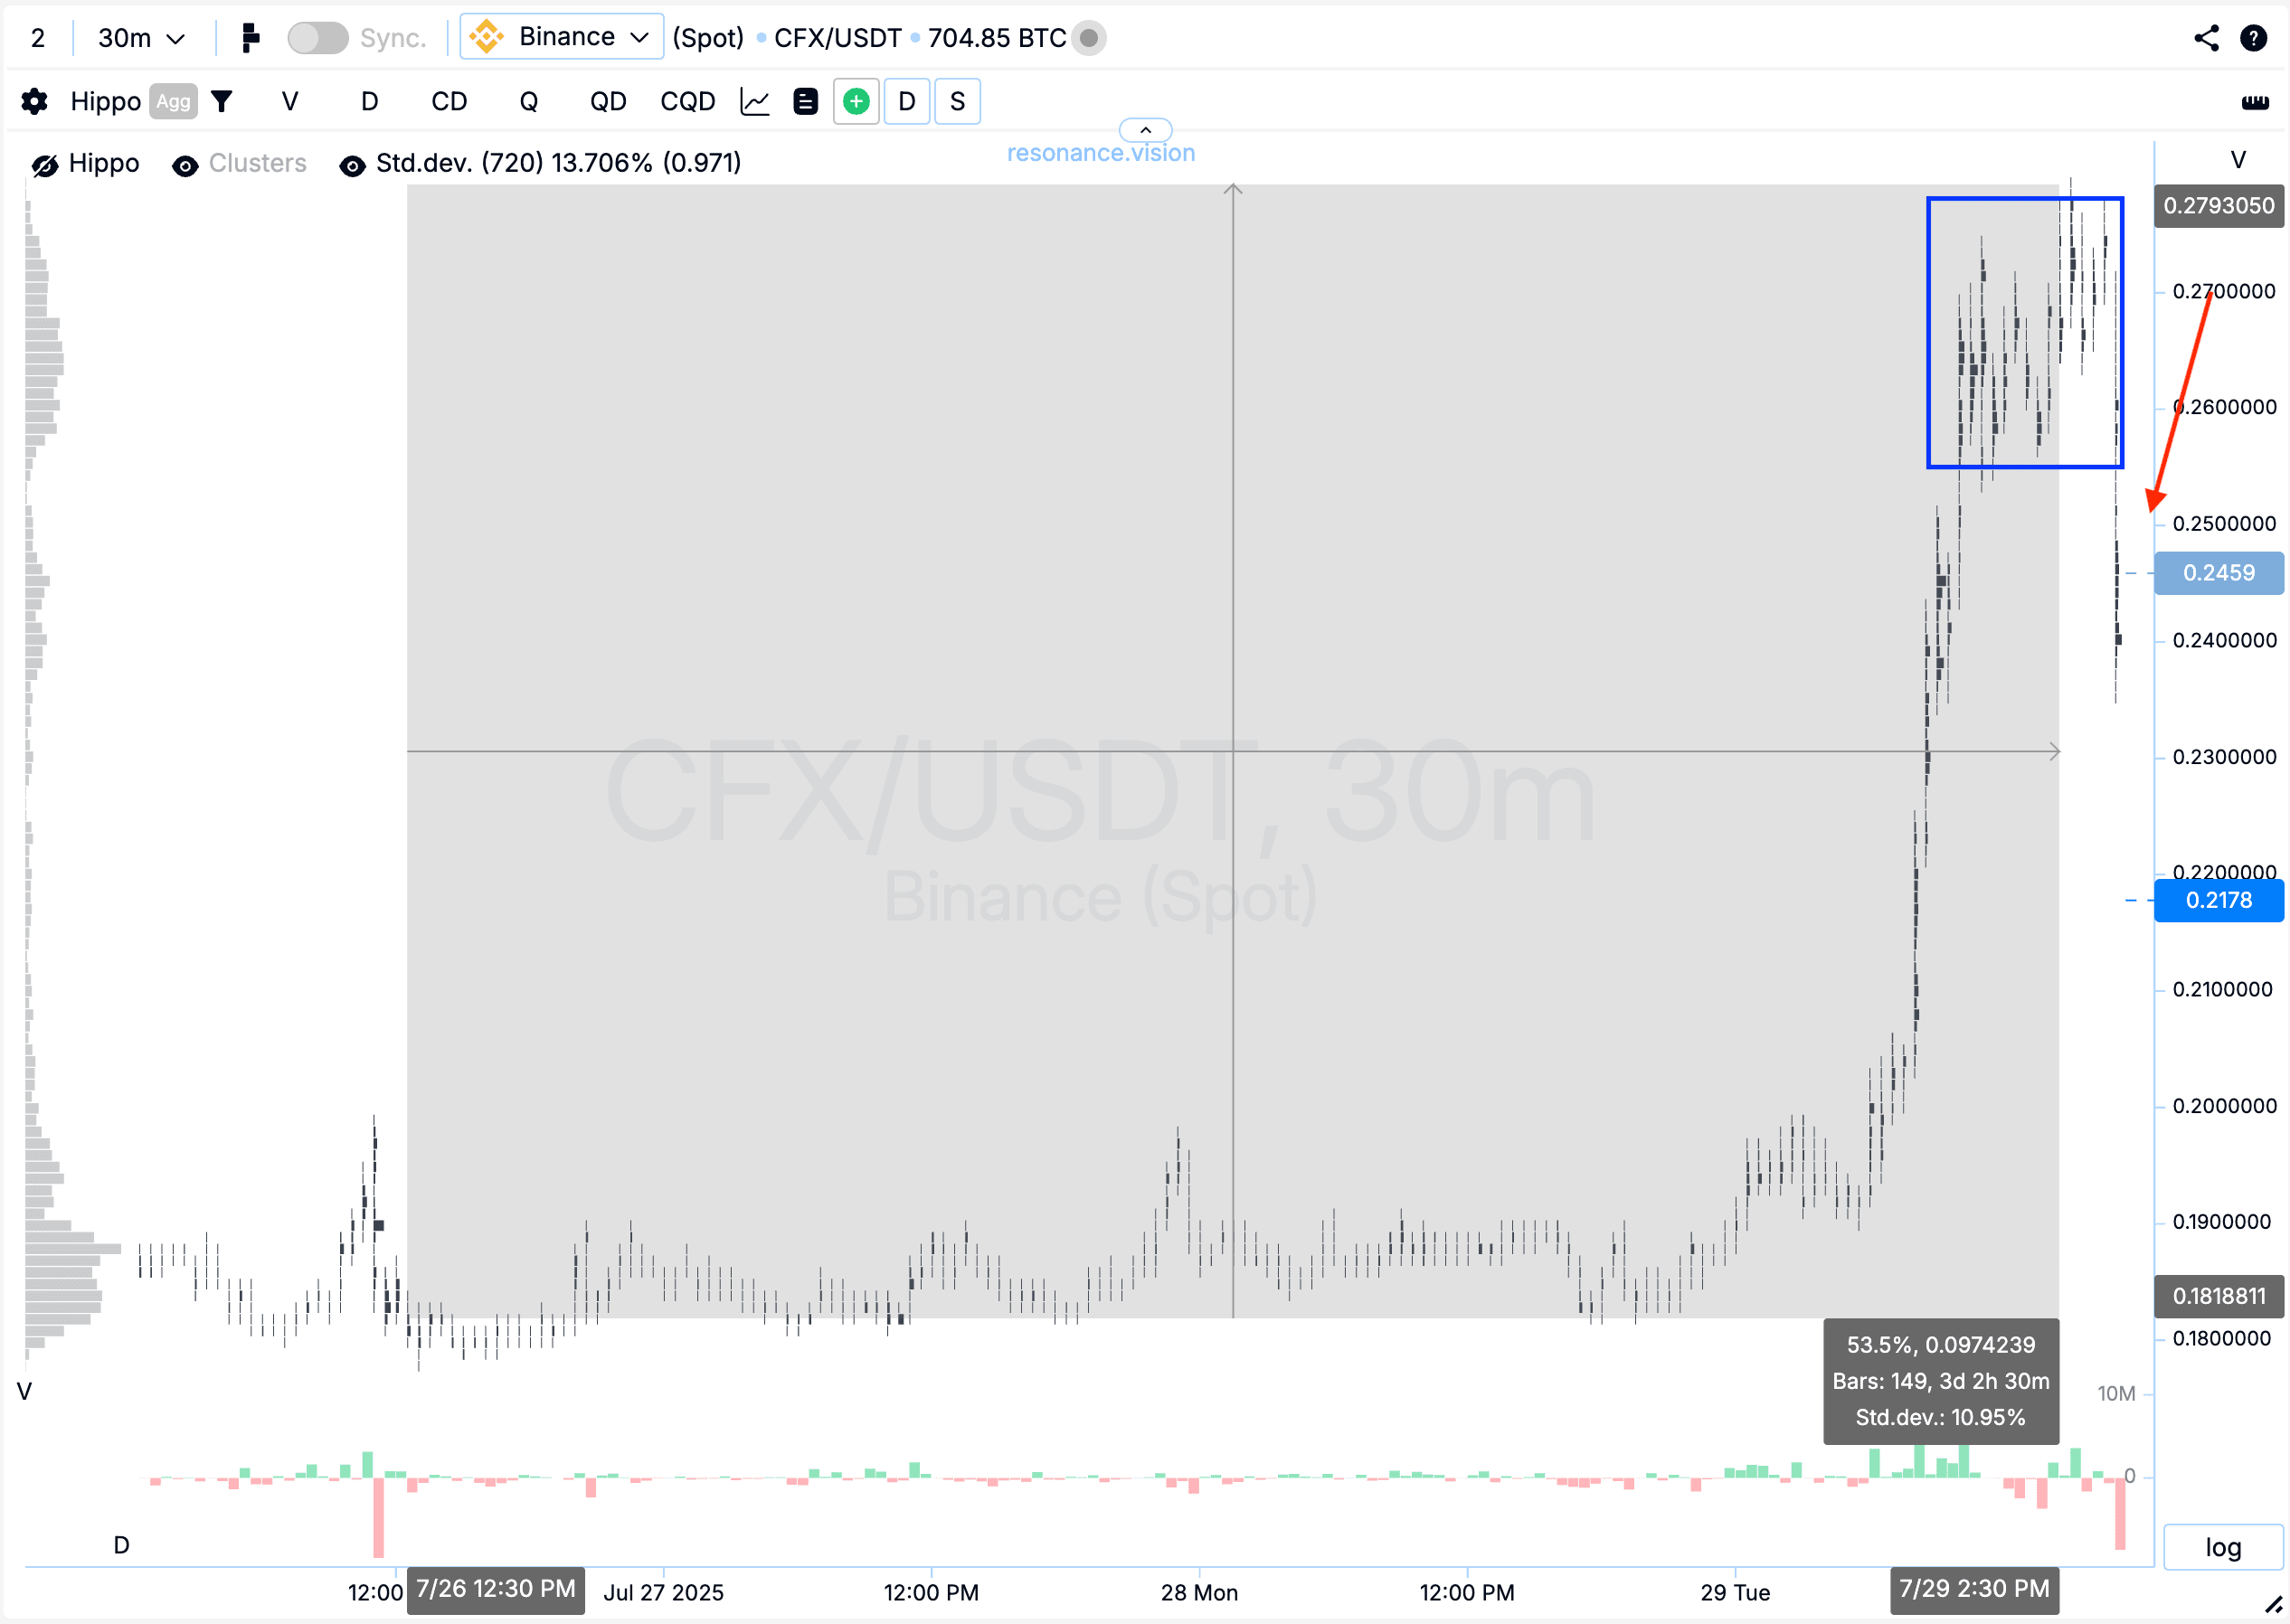
Cluster Chart: After a strong impulse, the price entered a consolidation phase with high volatility (area marked with a blue rectangle). From the entry point, the price has already moved over 50%, which on its own is a solid result.
In such zones, it’s expected that large players begin locking in profits — and that’s exactly what we’re seeing. Sellers gradually start to take control, leading to a noticeable pullback (shown by red arrow).
Conclusion
Despite dominant market selling, the price held due to strong demand and active absorption by limit buyers. This indicated a local supply shortage and ineffective sellers.
After the impulse move, price showed a gain of more than 50% from the entry point, then shifted into a volatile uncertainty phase — typical behavior when large players begin exiting positions.
This approach helps capture the bulk of the move while minimizing risks during a potential reversal.
Follow new insights in our telegram channel.
No need to invent complex schemes and look for the "grail". Use the Resonance platform tools.
Register via the link — get a bonus and start earning:
OKX | BingX | KuCoin.
Promo code TOPBLOG gives you a 10% discount on any Resonance tariff plan.
Recommended articles


