ENA: классический сетап для входа в лонг

Кейс локального дефицита и отличный лонг-сетап. Продавец давит объёмом, но цена не обновляет лои — продажи становятся неэффективными, появляется поддержка покупателя. Дальше — импульс и логичный выход там, где сила покупок слабеет и возникает лимитное сопротивление. Наглядный пример, как анализ спроса/предложения даёт реальный результат — можно брать как шаблон.
Содержание

Если вы ищете понятный пример, как находить торговые идеи не по “индикаторам”, а по реальному взаимодействию спроса и предложения, этот кейс для вас. Это практический разбор, который можно повторять как шаблон при анализе крипторынка через объёмы, кластеры и лимитную активность.
Где искали: Поиск актива происходил в скринере на 30м таймфрейме.
Базовая логика: на фоне преобладания рыночных продаж цена перестала снижаться. Это типична ситуация “неэффективности продаж”: давления объемами много, а результата в виде продолжения снижения нет. Такая ситуация указала на формирование локального дефицита и дала основание для входа в сделку.
Также хочу отметить, что во время скрининга рынка похожие следы дефицита были замечены на большинстве монет. Это стало дополнительным аргументом для входа в позицию.
Причины входа
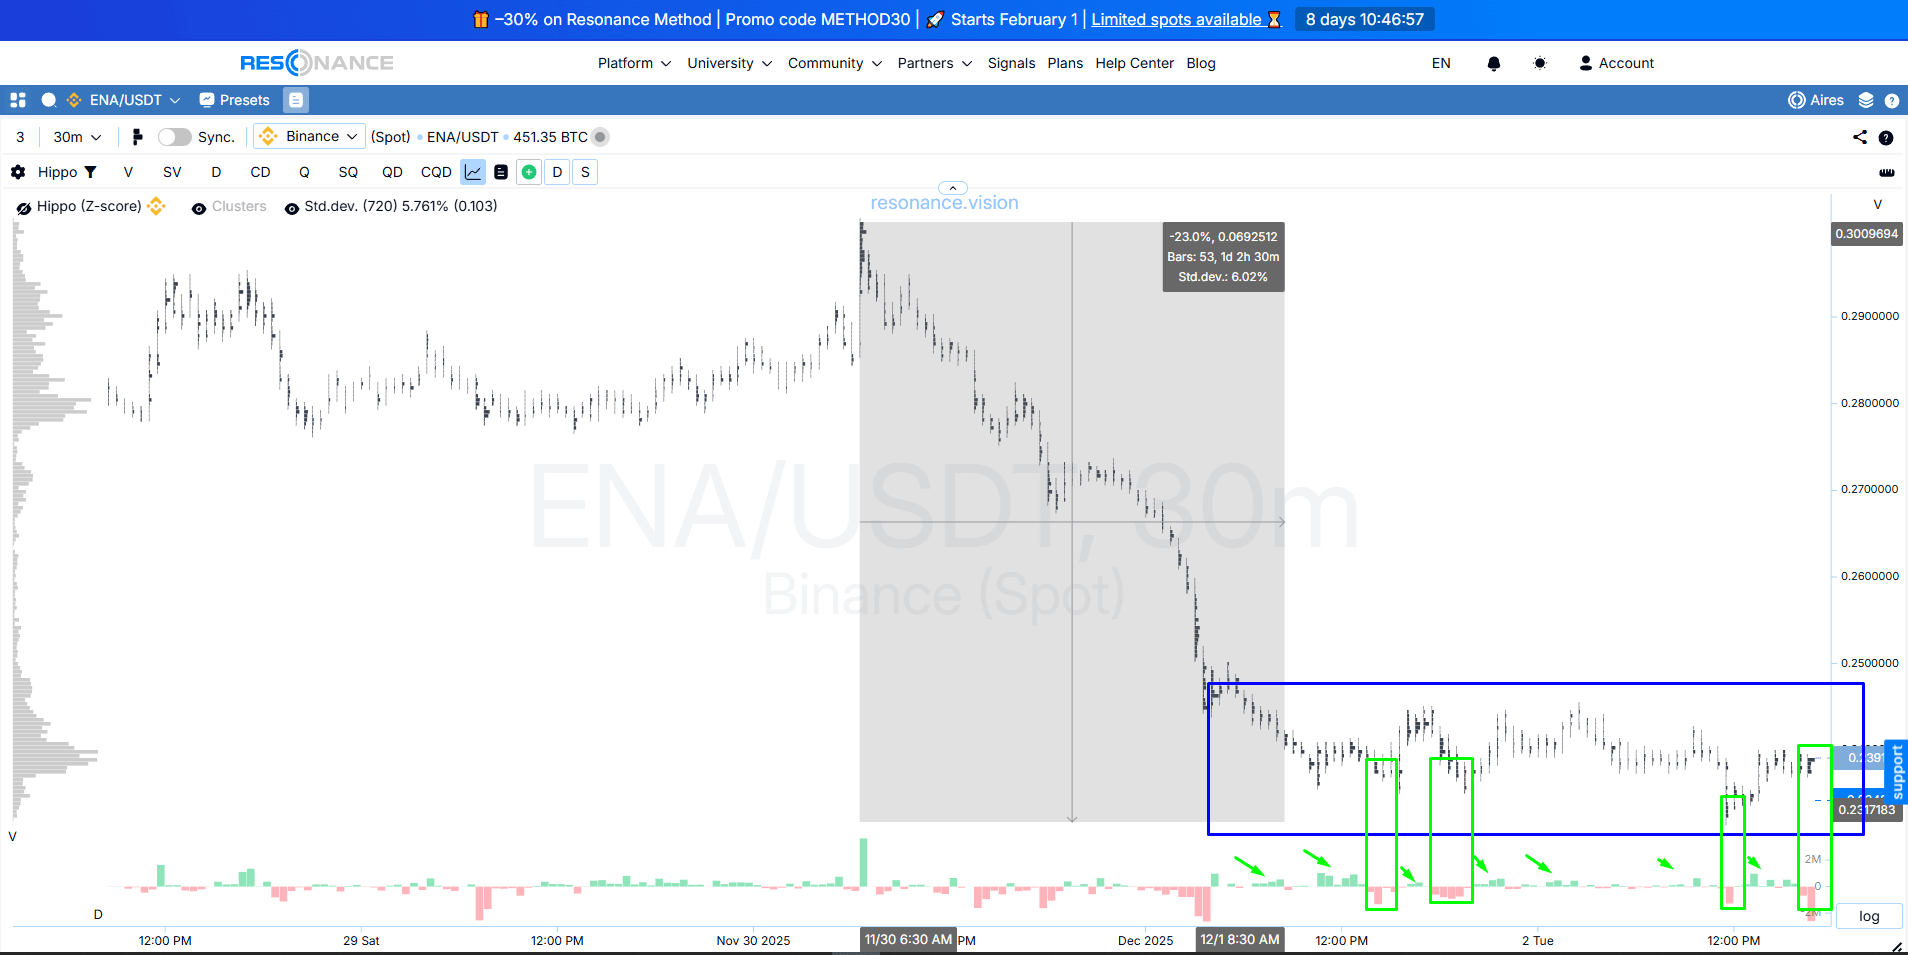
1. Кластерный график: продажи перестали обновлять локальные минимумы
После сильного снижения образовался устойчивый боковик (синий прямоугольник),- зона консолидации. Внутри диапазона продажи перестали приводить к существенному обновлению локальных минимумов (зеленые прямоугольники): продавец есть, но его усилия не эффективны. Также мы можем увидеть, что и покупатель стал активней. Это видно по зеленым столбикам гистограммы дельты (зеленые стрелки).
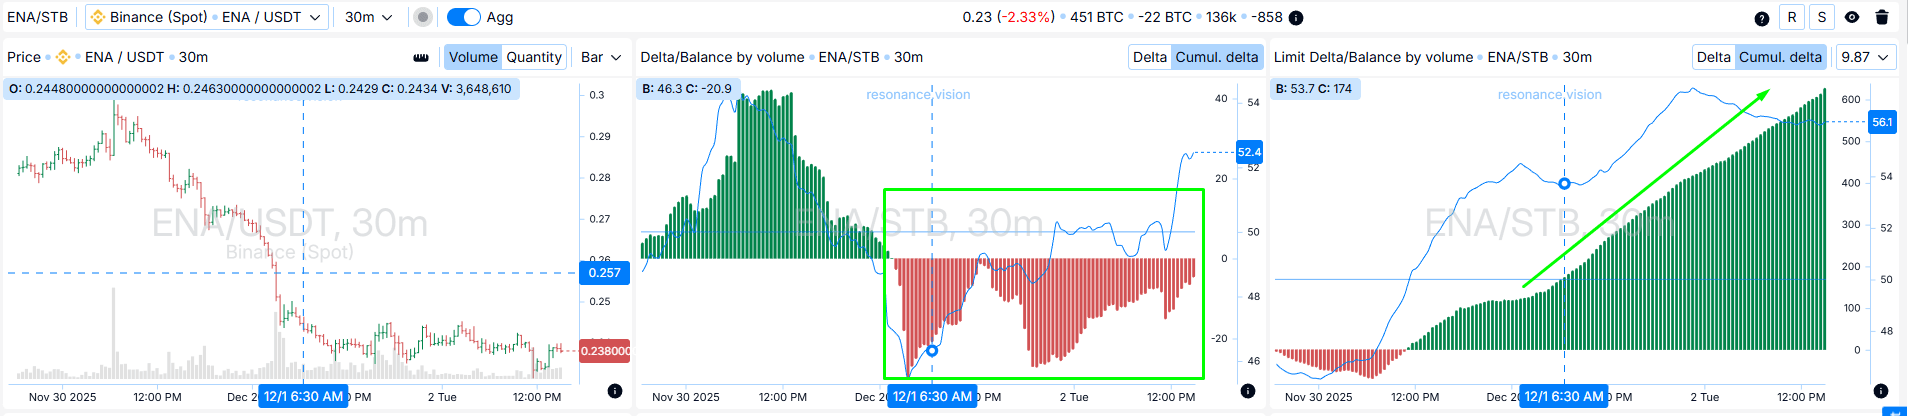
2. Дешборд: подтверждение агрегированными метриками
Дельта/баланс по объему:
Агрегированные данные по всем парам и биржам подтверждают неэффективность рыночных продаж (зеленый прямоугольник). Кумулятивно преобладают продажи, а существенного снижения цены нет.
Лимит Дельта/Баланс по объему:
В стакане на всех биржах мы видим, что растут лимитные заявки на покупку (зеленая стрелка). Это важная деталь: покупатель наращивает лимитную поддержку, что повышает шанс удержания диапазона и последующего импульса. Как раз за этот диапазон мы и выставляем стоп-лосс
Причины выхода
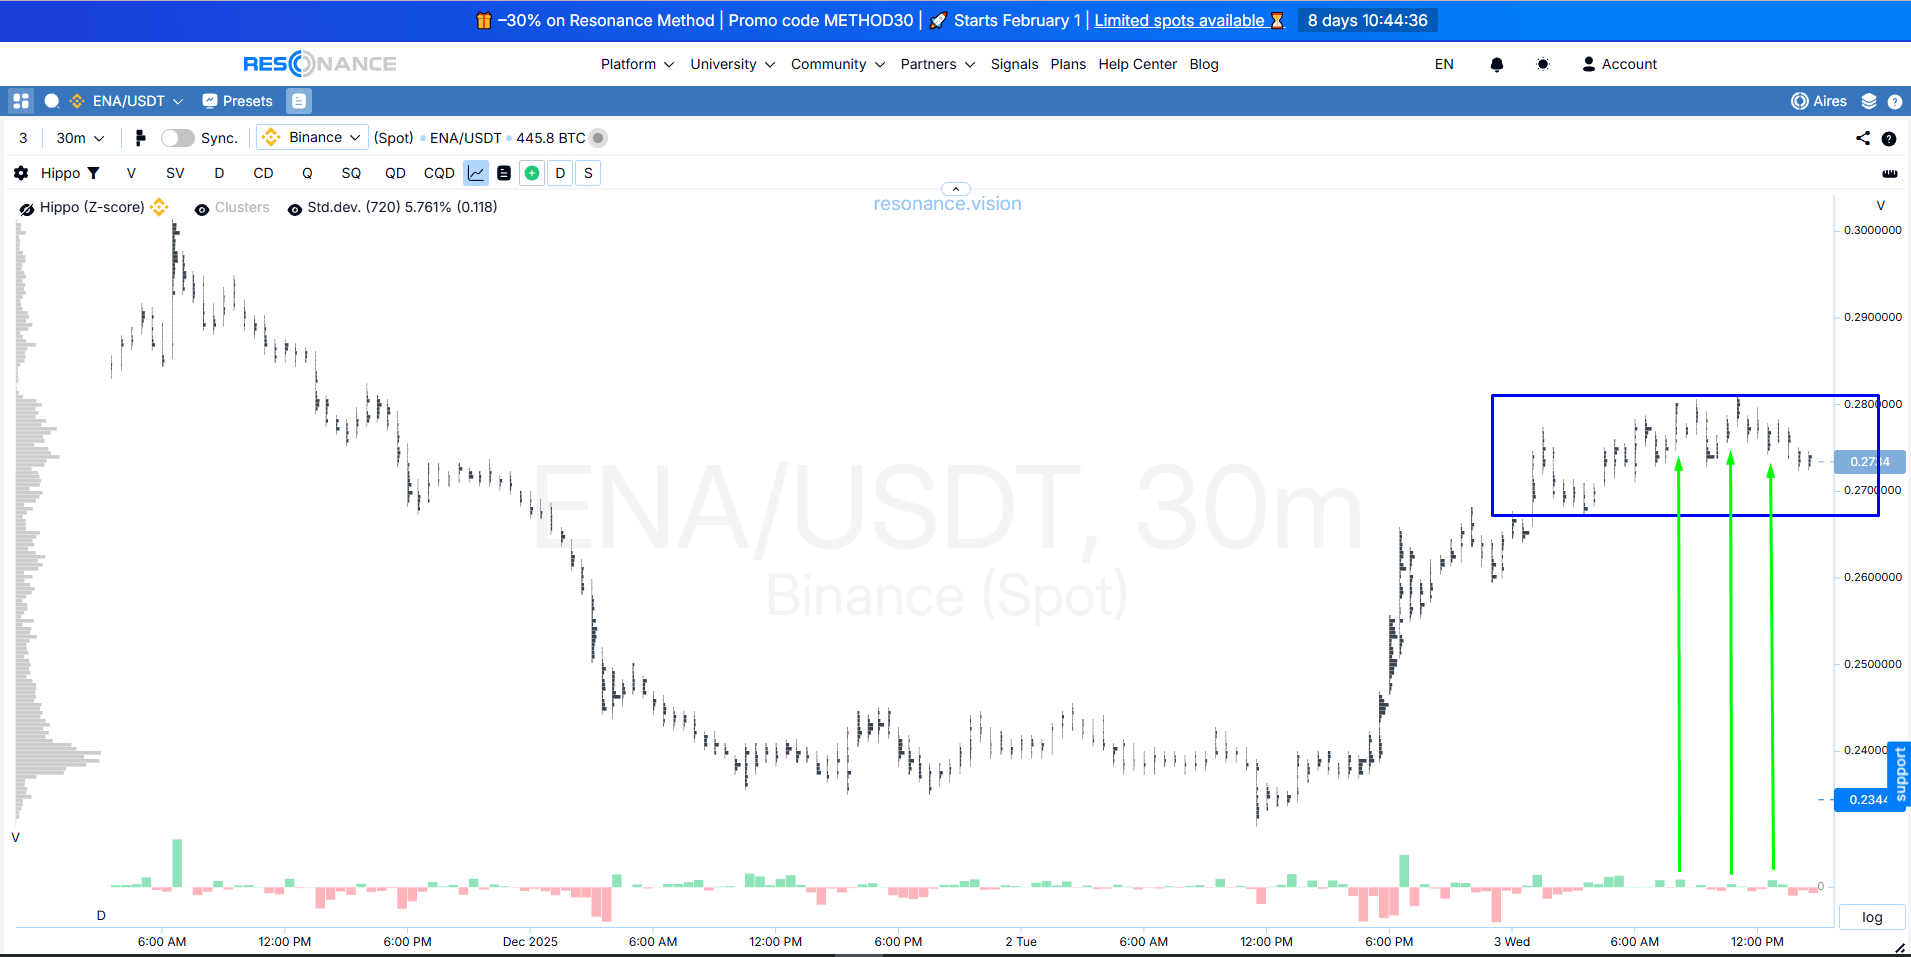
1. Кластерный график: ослабление ценовой реакции на рыночные покупки
После формирования дефицитного состояния цена сделала существенное движение и начал формироваться боковик (синий прямоугольник). Реакция на рыночные покупки стала слабее (зеленые стрелки). Цена даже демонстрирует небольшой откат. Это свидетельствует о возможном переходе инициативы к продавцам.
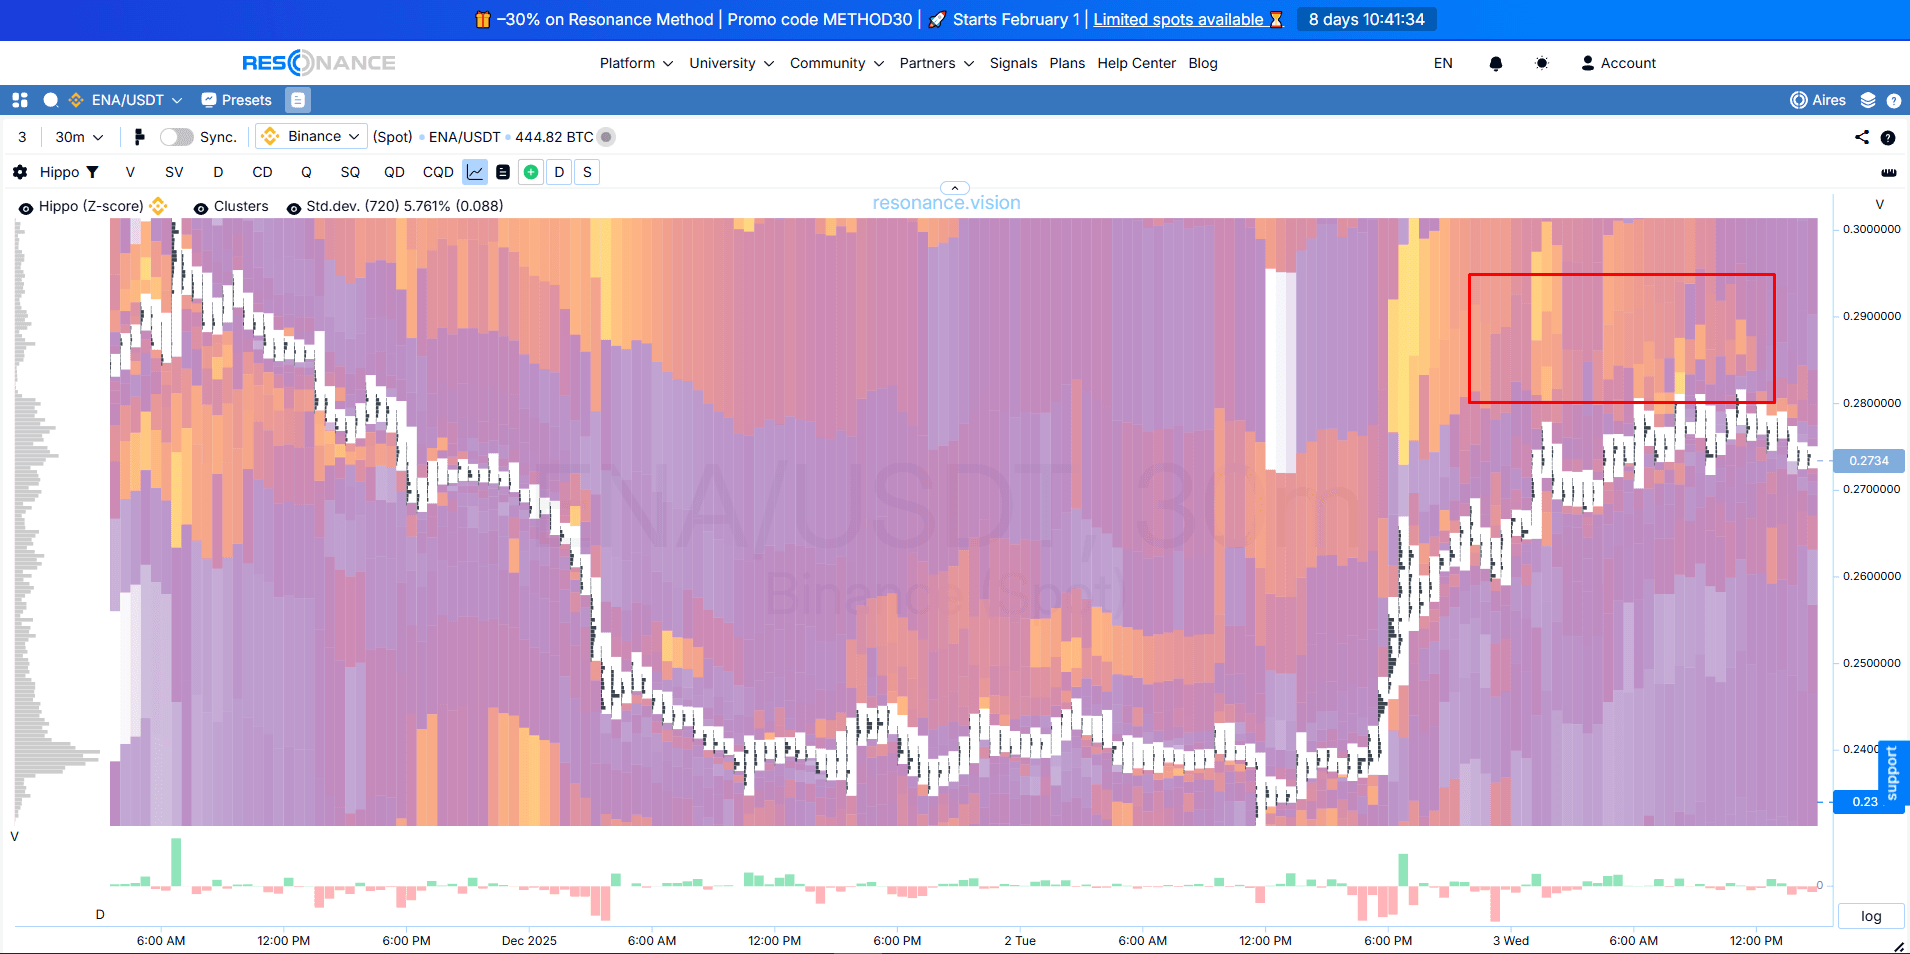
2. Тепловая карта: зона лимитного сопротивления
На тепловой карте зафиксировано большое скопление лимитных ордеров на продажу (красный прямоугольник). Это создает дополнительный барьер для продолжения роста. В этой зоне “качество” продолжения движения ухудшается, поэтому закрытие позиции становится логичным.
Вывод по сделке
Этот кейс прекрасно демонстрирует как анализ кластерного графика и лимитных заявок в связке с агрегированными метриками помогают определить формирование локального дефицита. Вход был осуществлен на признаках неэффективных продаж, а выход - после сильного ценового движения, признаков ослабления силы покупателя и сопротивления со стороны лимитных продавцов.

Следи за новыми статьями в нашем телеграм канале.
Не нужно выдумывать сложных схем и искать “грааль”. Используй инструменты платформы Resonance.
Регистрируйся по ссылке — получай бонус и начинай зарабатывать:
OKX | BingX | KuCoin.
Промокод TOPBLOG дает тебе 10% скидки на любой тарифный план Resonance.
Рекомендуемые статьи


