COTI +21.4% (Направленная стратегия Resonance)

В этом разборе мы рассмотрели ситуацию по COTI/USDT.
Несмотря на заметные покупки и крупные кластера на росте, цена не смогла обновить максимум, что указывало на ослабление покупателей. Позднее последовало резкое снижение более чем на 20% — почти в 5 раз выше стандартного движения для этой монеты. Такая динамика говорит о повышенной волатильности и рисках удержания позиции, поэтому фиксация выглядела оптимальным решением.
Содержание

Монета: COTI/USDT
Риск: средний
Уровень понимания: новичок
Причины входа
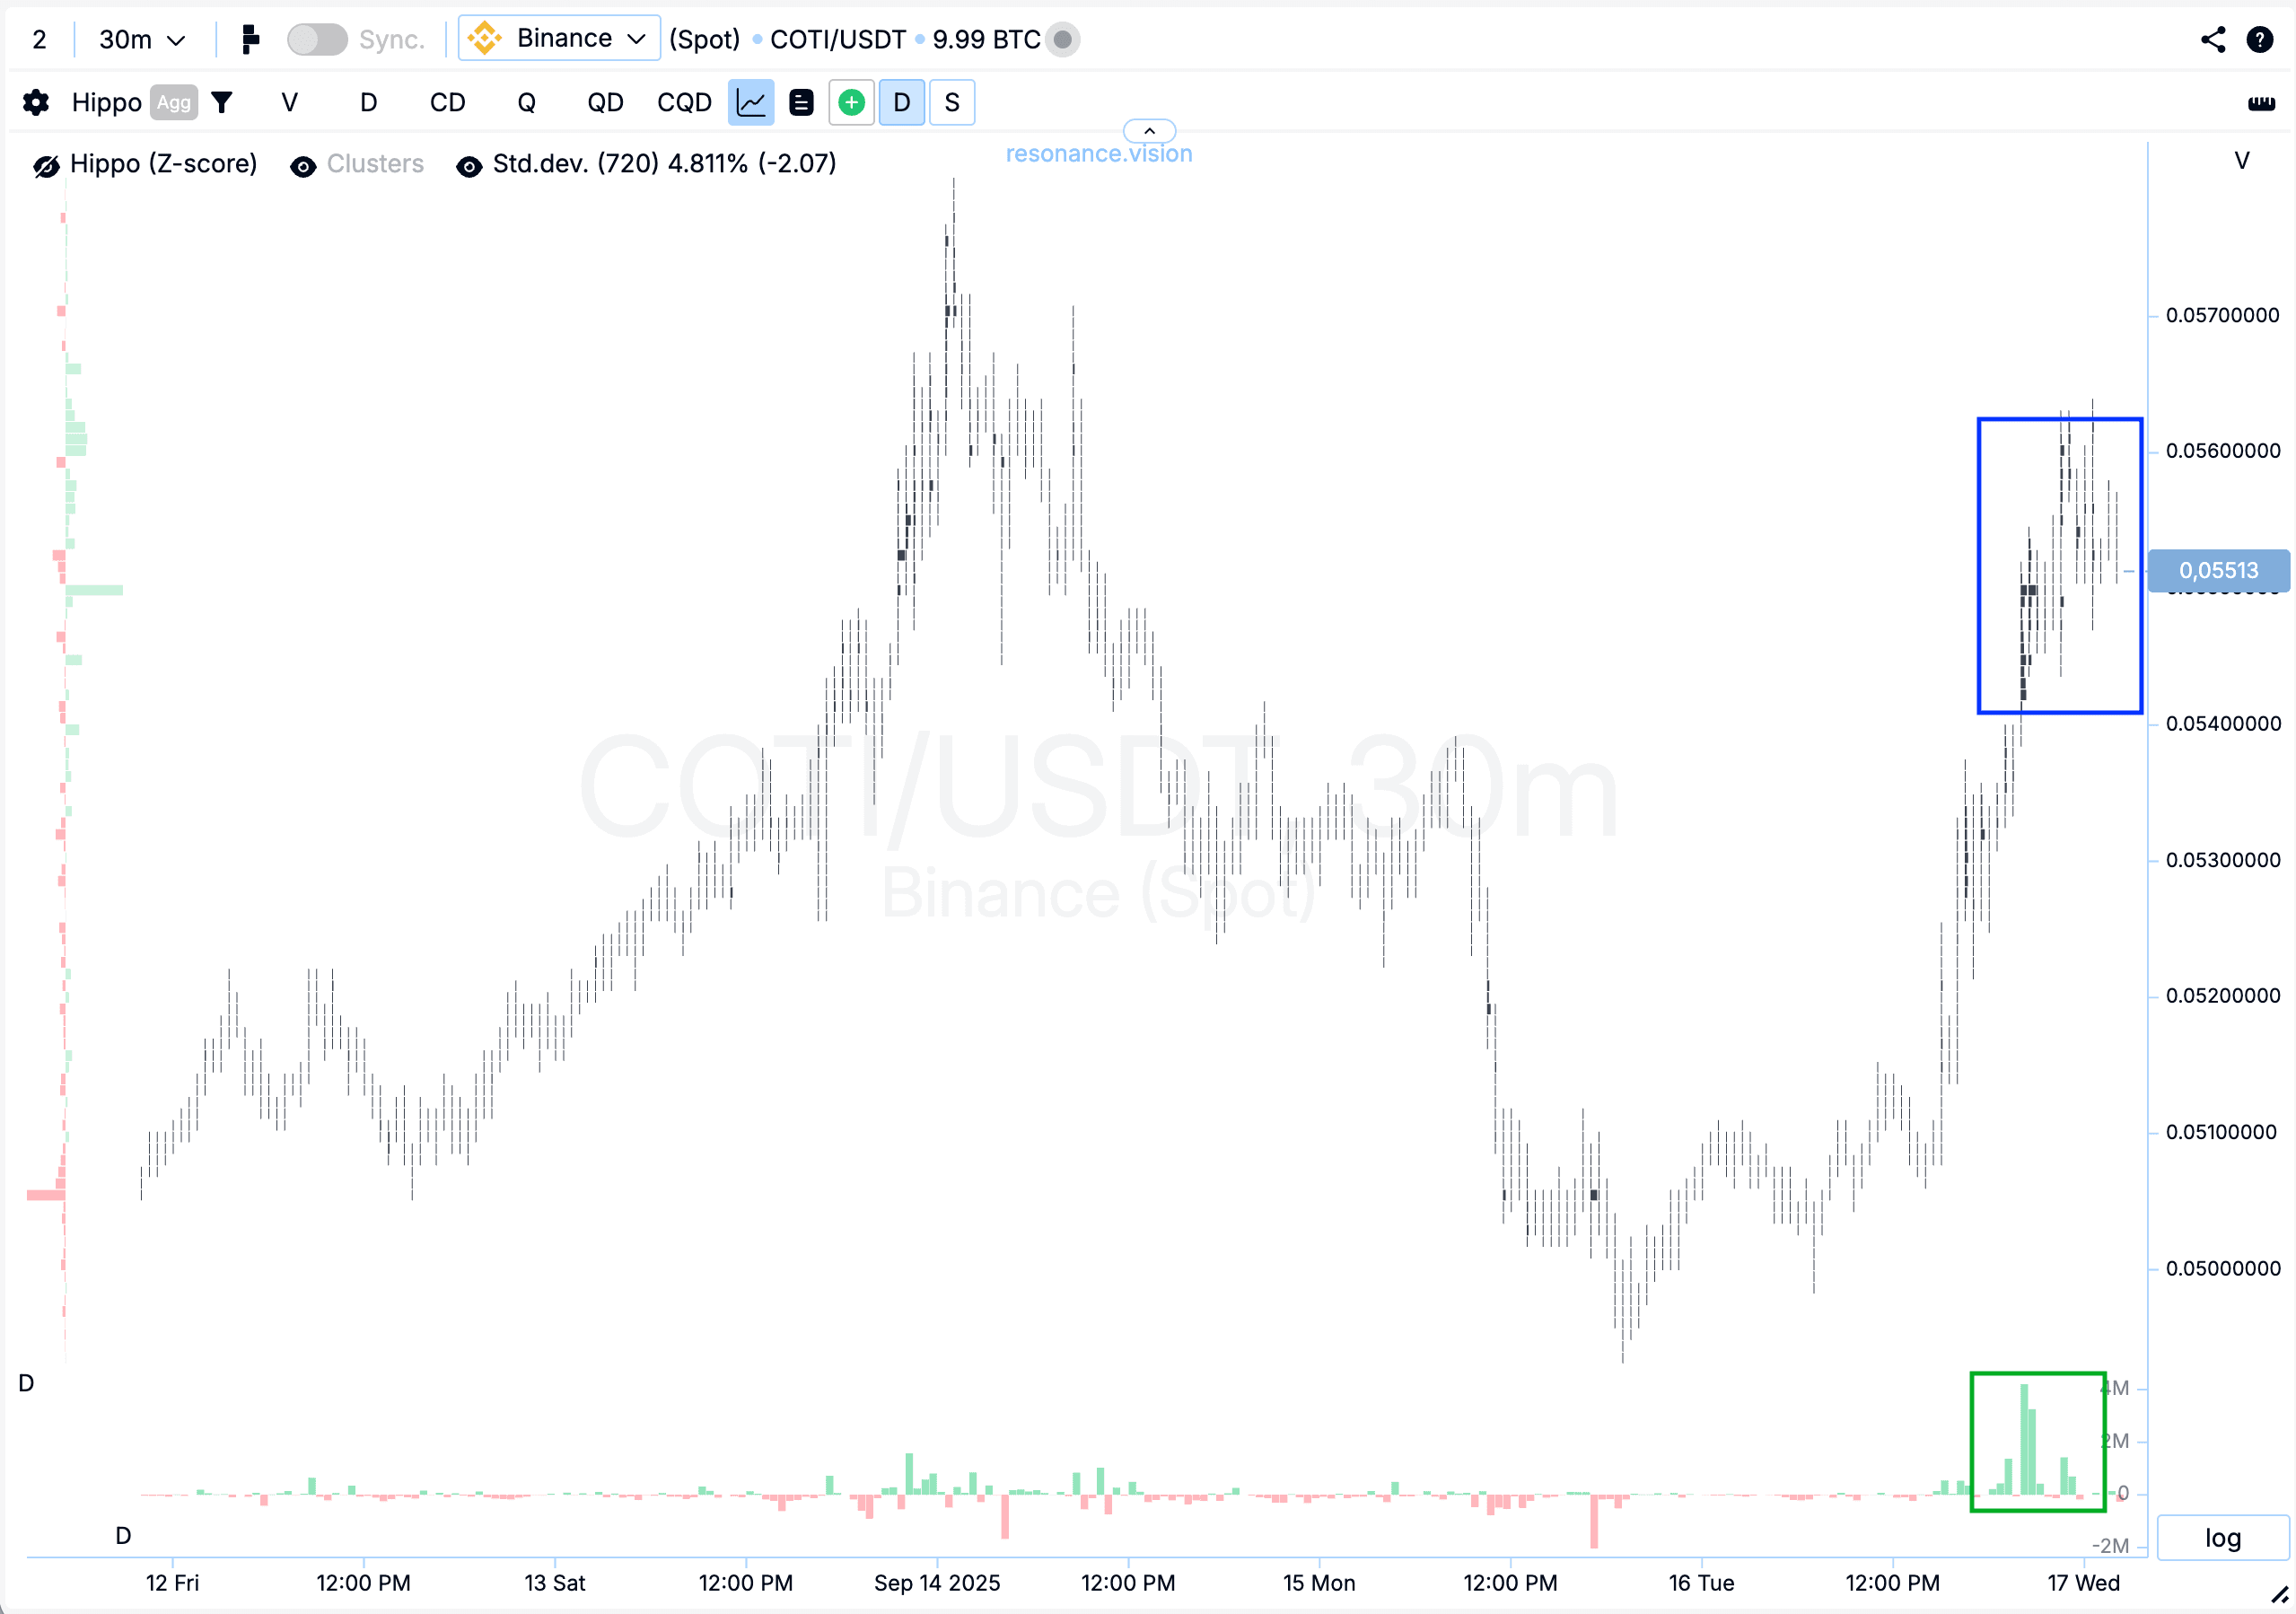
Кластерный график: на росте сформировались крупные кластера по объёму (синий прямоугольник). Внутри них заметно преобладали покупки (зелёный прямоугольник), однако цена не смогла обновить локальный максимум. Подобная динамика может сигнализировать о локальном профиците и снижении силы покупателей.
В Дешборде
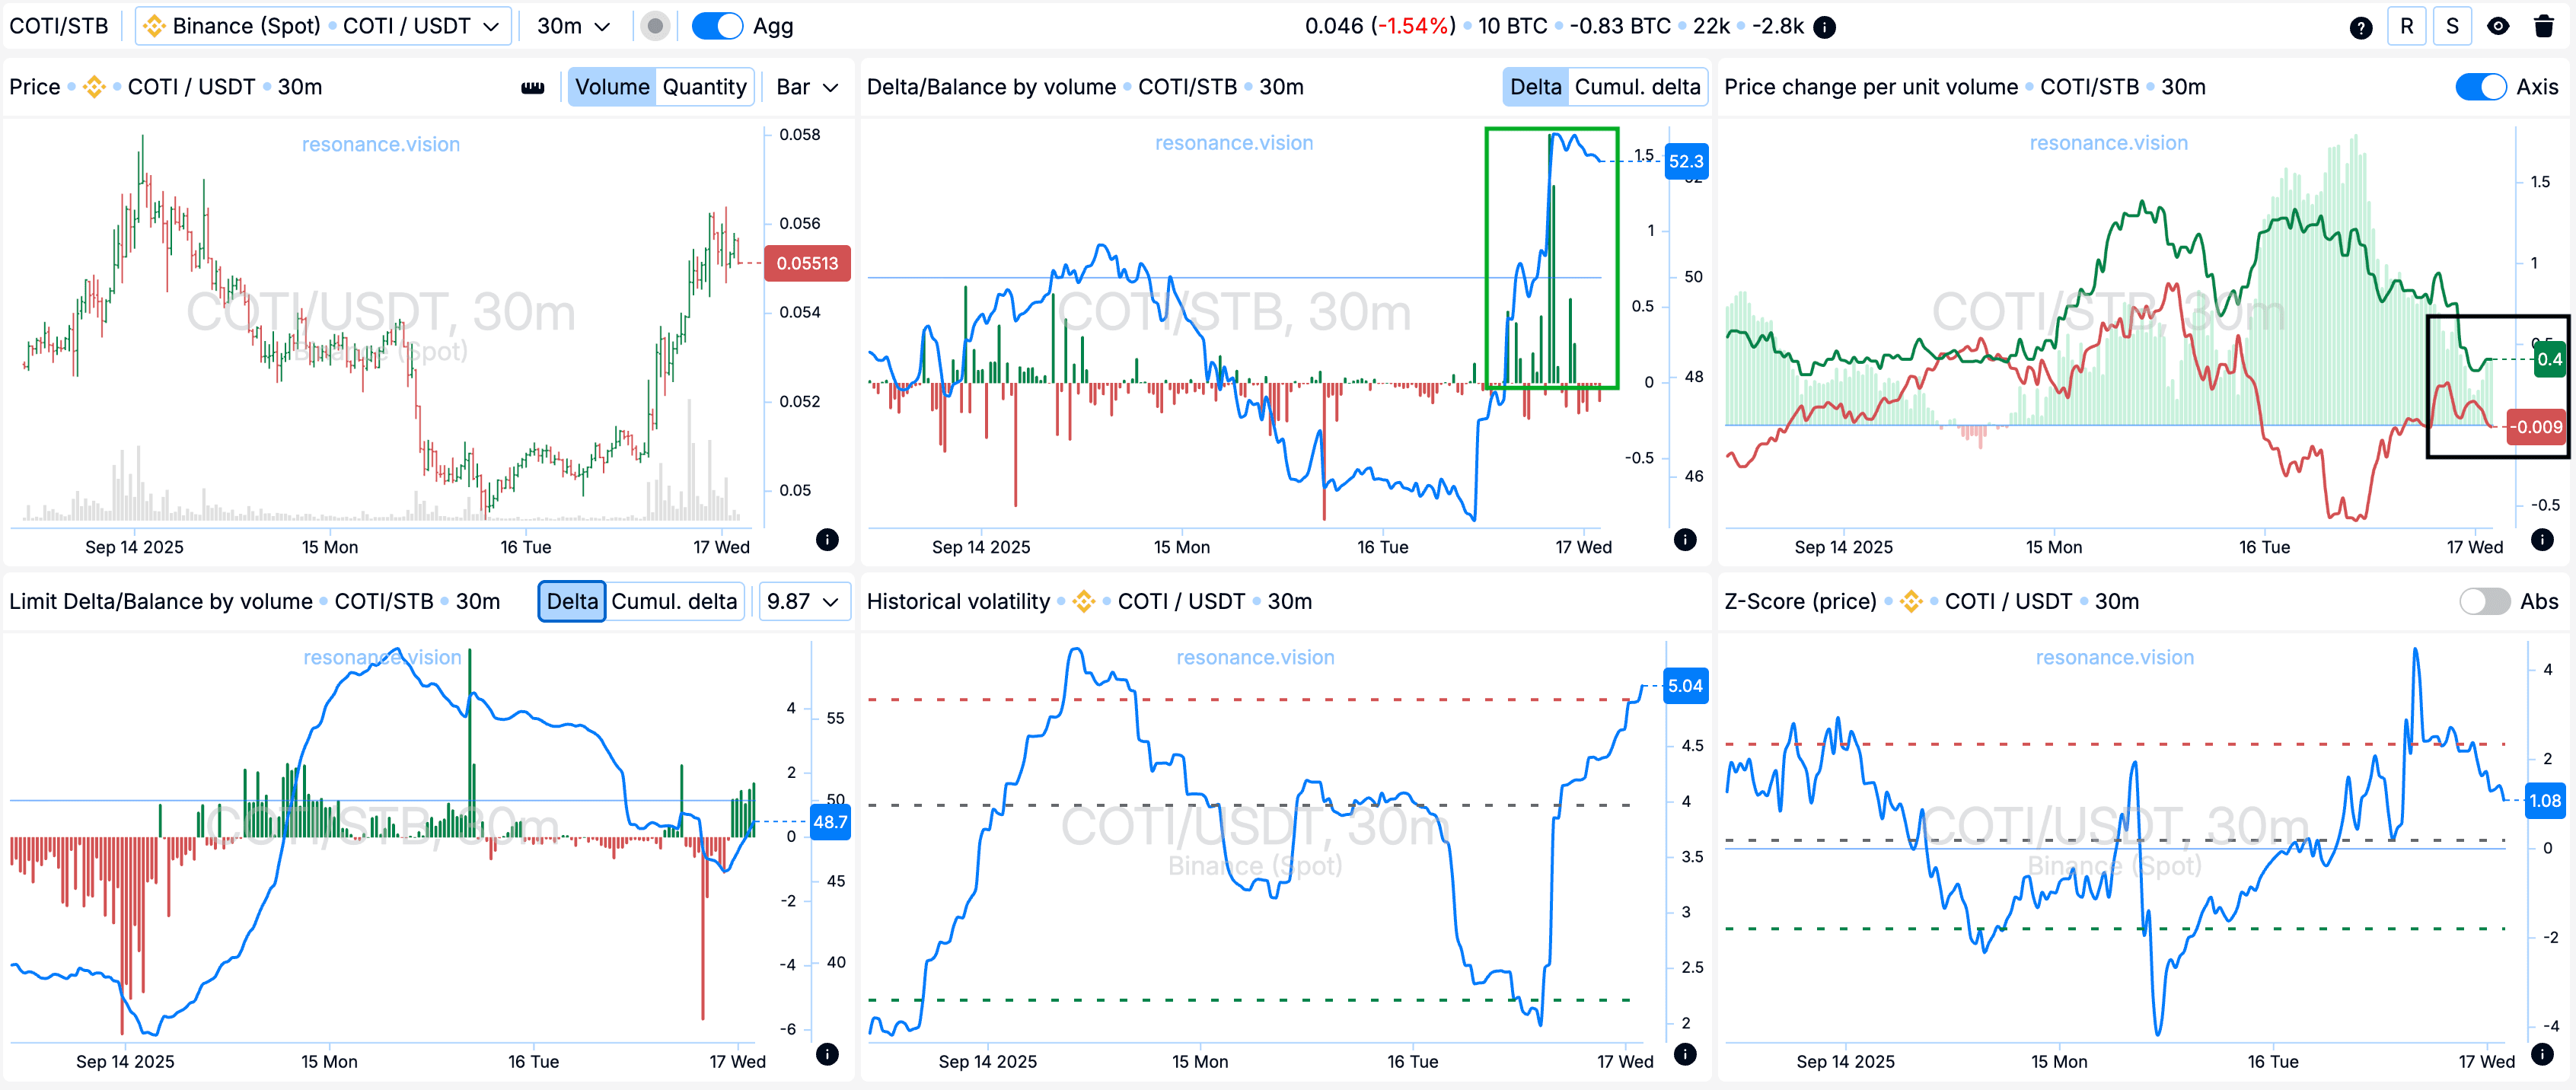
Дельта/Баланс по объёму: агрегированные данные показывают, что по всем парам и биржам проходили значительные покупки, что отчётливо видно по гистограмме дельты (зелёный прямоугольник). Однако, несмотря на выраженное давление со стороны покупателей, цена не демонстрирует ожидаемого роста, как отмечалось ранее.
Изменение цены на единицу объёма: дополнительно видно, что эффективность воздействия рыночных ордеров начала сходиться к примерно одинаковым значениям (чёрный прямоугольник), что указыватет на снижение эффективности покупателей.
Причины выхода
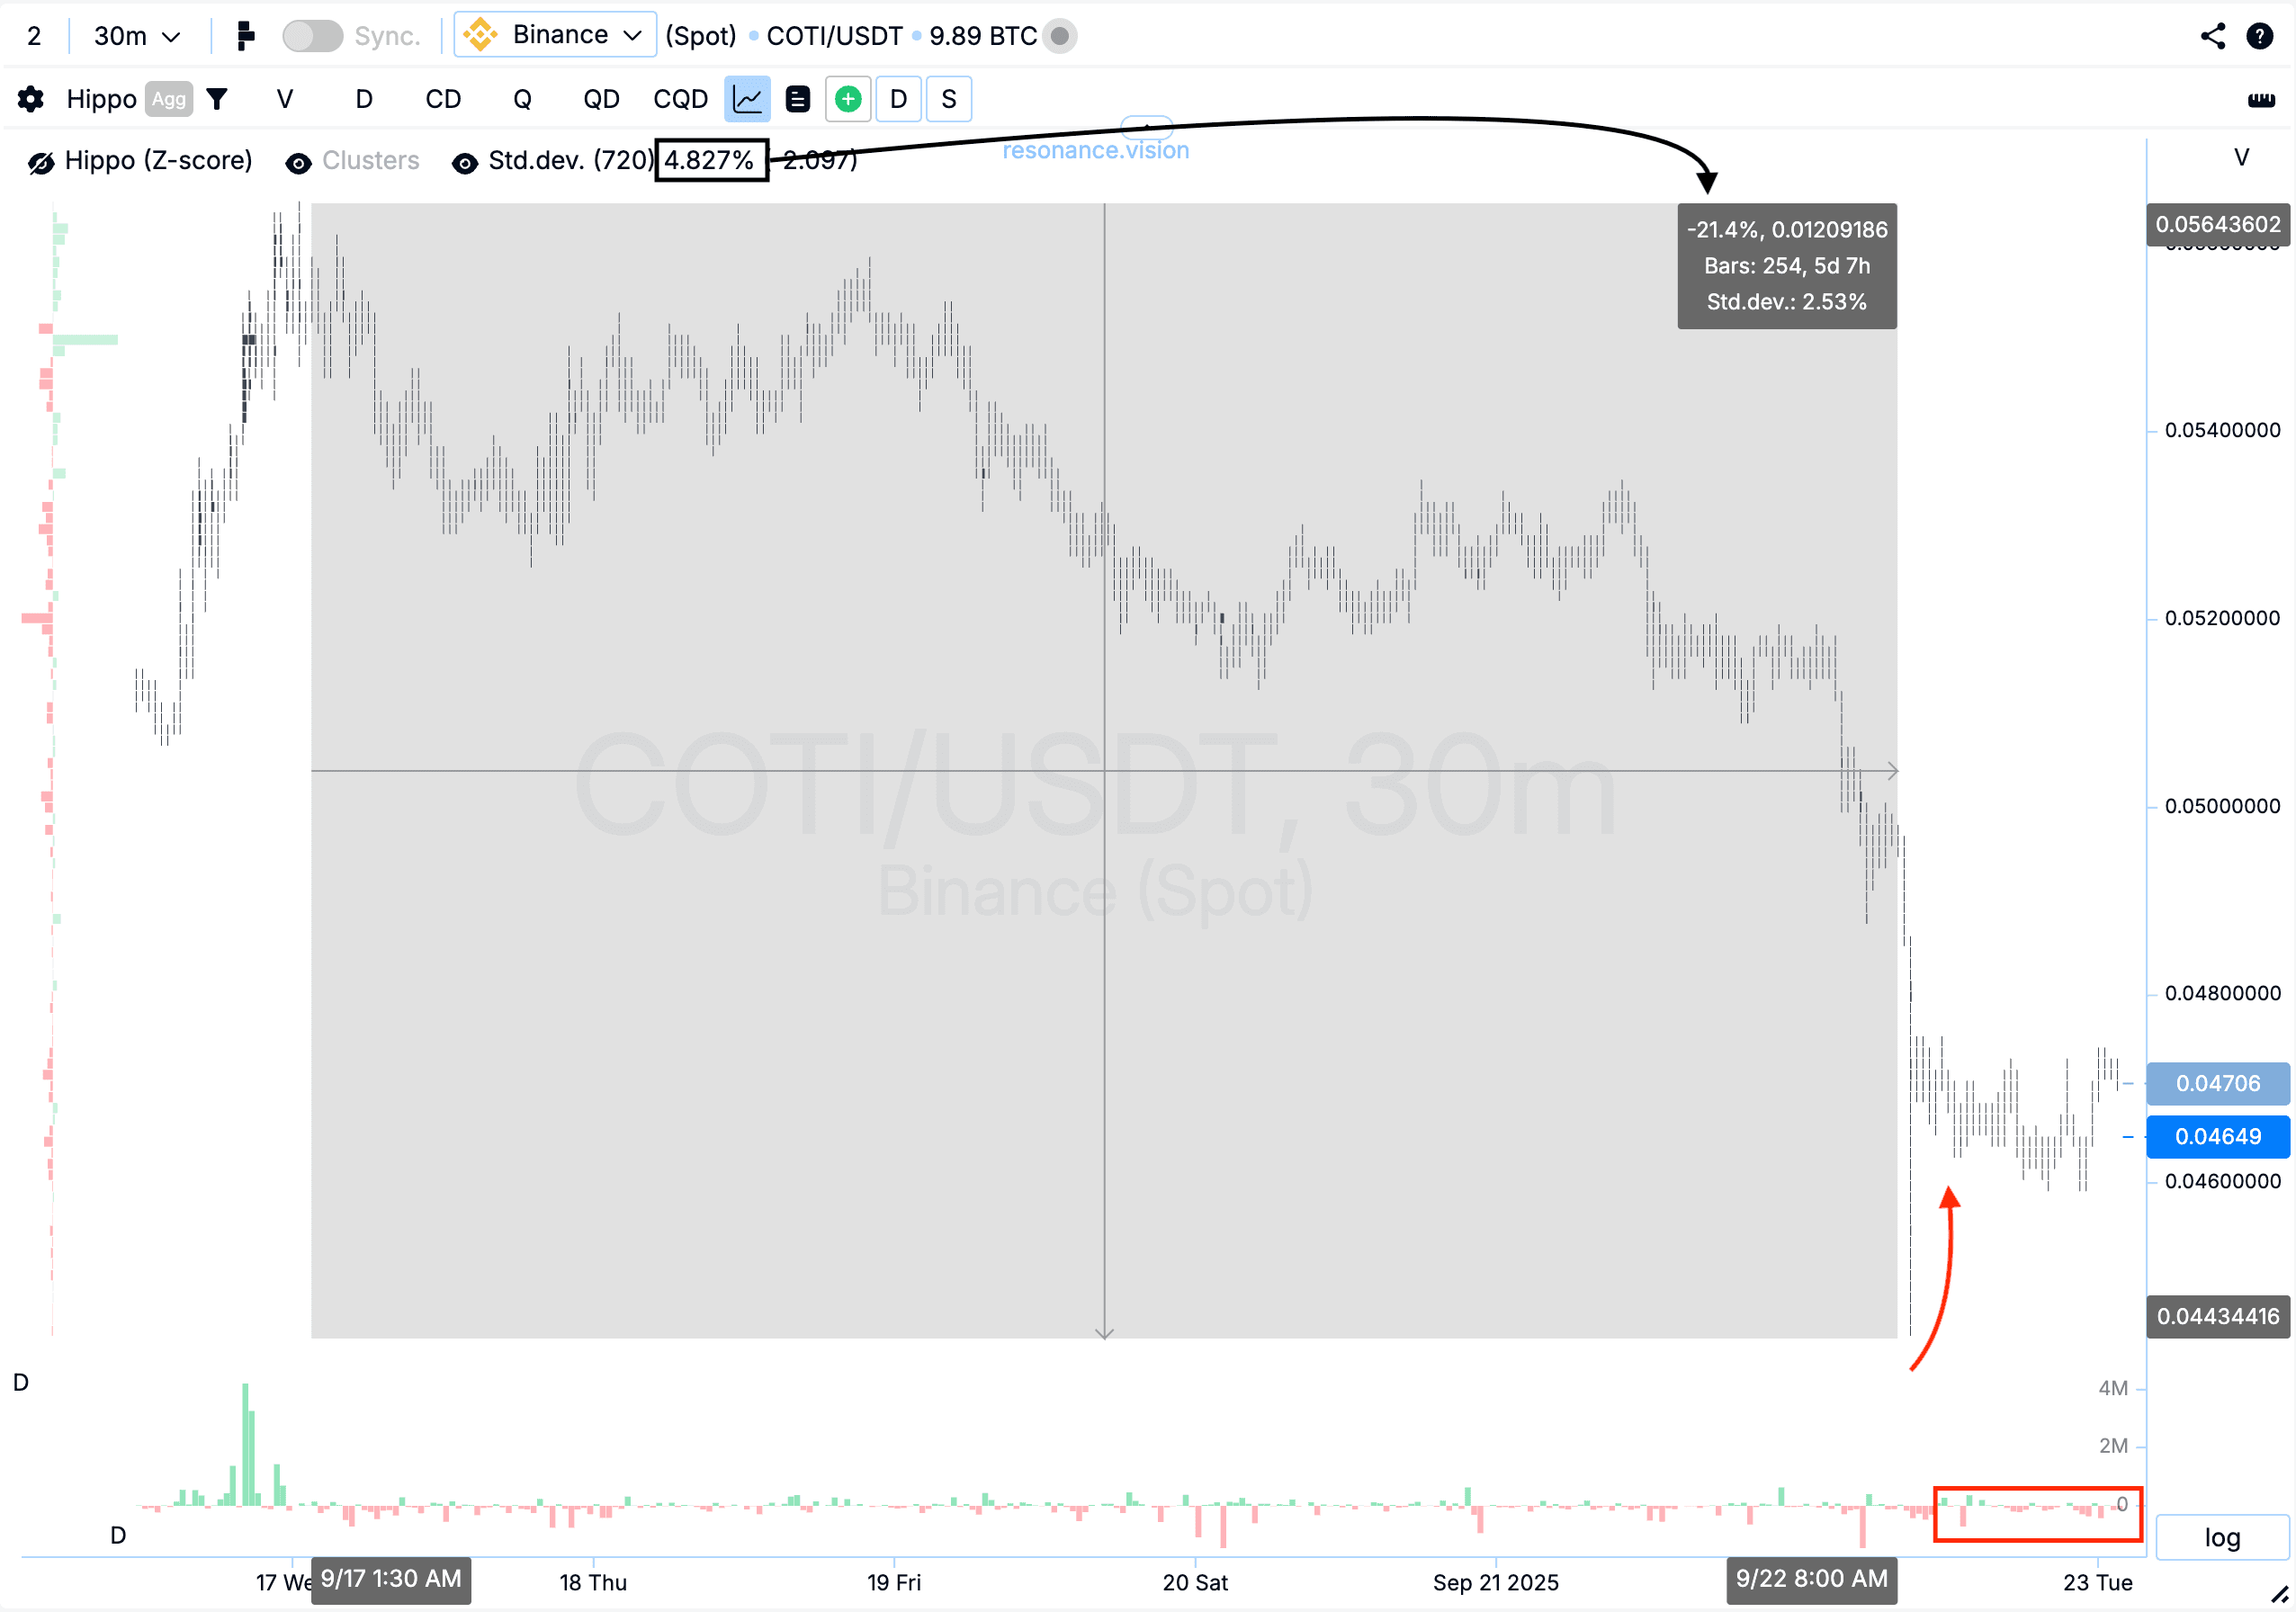
Кластерный график: после импульсного снижения цена показала откат, при котором рыночные продажи уже не оказывают давления (красный прямоугольник и стрелка) — цена не продолжает снижаться. Дополнительно стоит отметить, что движение от локального максимума до минимума составило более 20%. Для данной монеты одно стандартное движение равно 4,427%, то есть текущее падение сопоставимо почти с пятью стандартными движениями. Такое отклонение считается аномальным и добавляет рисков к удержанию позиции.
Заключение
Изначальная картина указывала на локальное ослабление покупателей — крупные кластера с преобладанием покупок не дали обновления максимума, а в агрегированных данных дельты значительные покупки не сопровождались ростом цены. Это стало сигналом о возможном профиците и снижении эффективности спроса.
После импульсного снижения последовал откат, но рыночные продажи уже не давили на цену, что указывает на баланс спроса и предложения в новом диапазоне. При этом падение более чем на 20% — почти пять стандартных движений — выглядит аномальным для актива. В такой ситуации фиксация позиции выглядит оправданным решением, так как удержание сопровождалось бы повышенным риском.
Следи за новыми статьями в нашем телеграм канале.
Не нужно выдумывать сложных схем и искать “грааль”. Используй инструменты платформы Resonance.
Регистрируйся по ссылке — получай бонус и начинай зарабатывать:
OKX | BingX | KuCoin.
Промокод TOPBLOG дает тебе 10% скидки на любой тарифный план Resonance.
Рекомендуемые статьи


