CVX +54.7% (Напрямкова стратегія Резонанс)

Розбір угоди з CVX/USDT з акцентом на кластерний аналіз та агреговані дані. На тлі домінування ринкових продажів ціна перестала знижуватися, що вказало на формування локального дефіциту та дало підставу для входу. Вихід виконаний після сильного цінового руху та появи ознак ослаблення купівельної ініціативи.
Зміст

Монета: CVX/USDT
Ризик: низький
Рівень розуміння: новачок
Причини входу
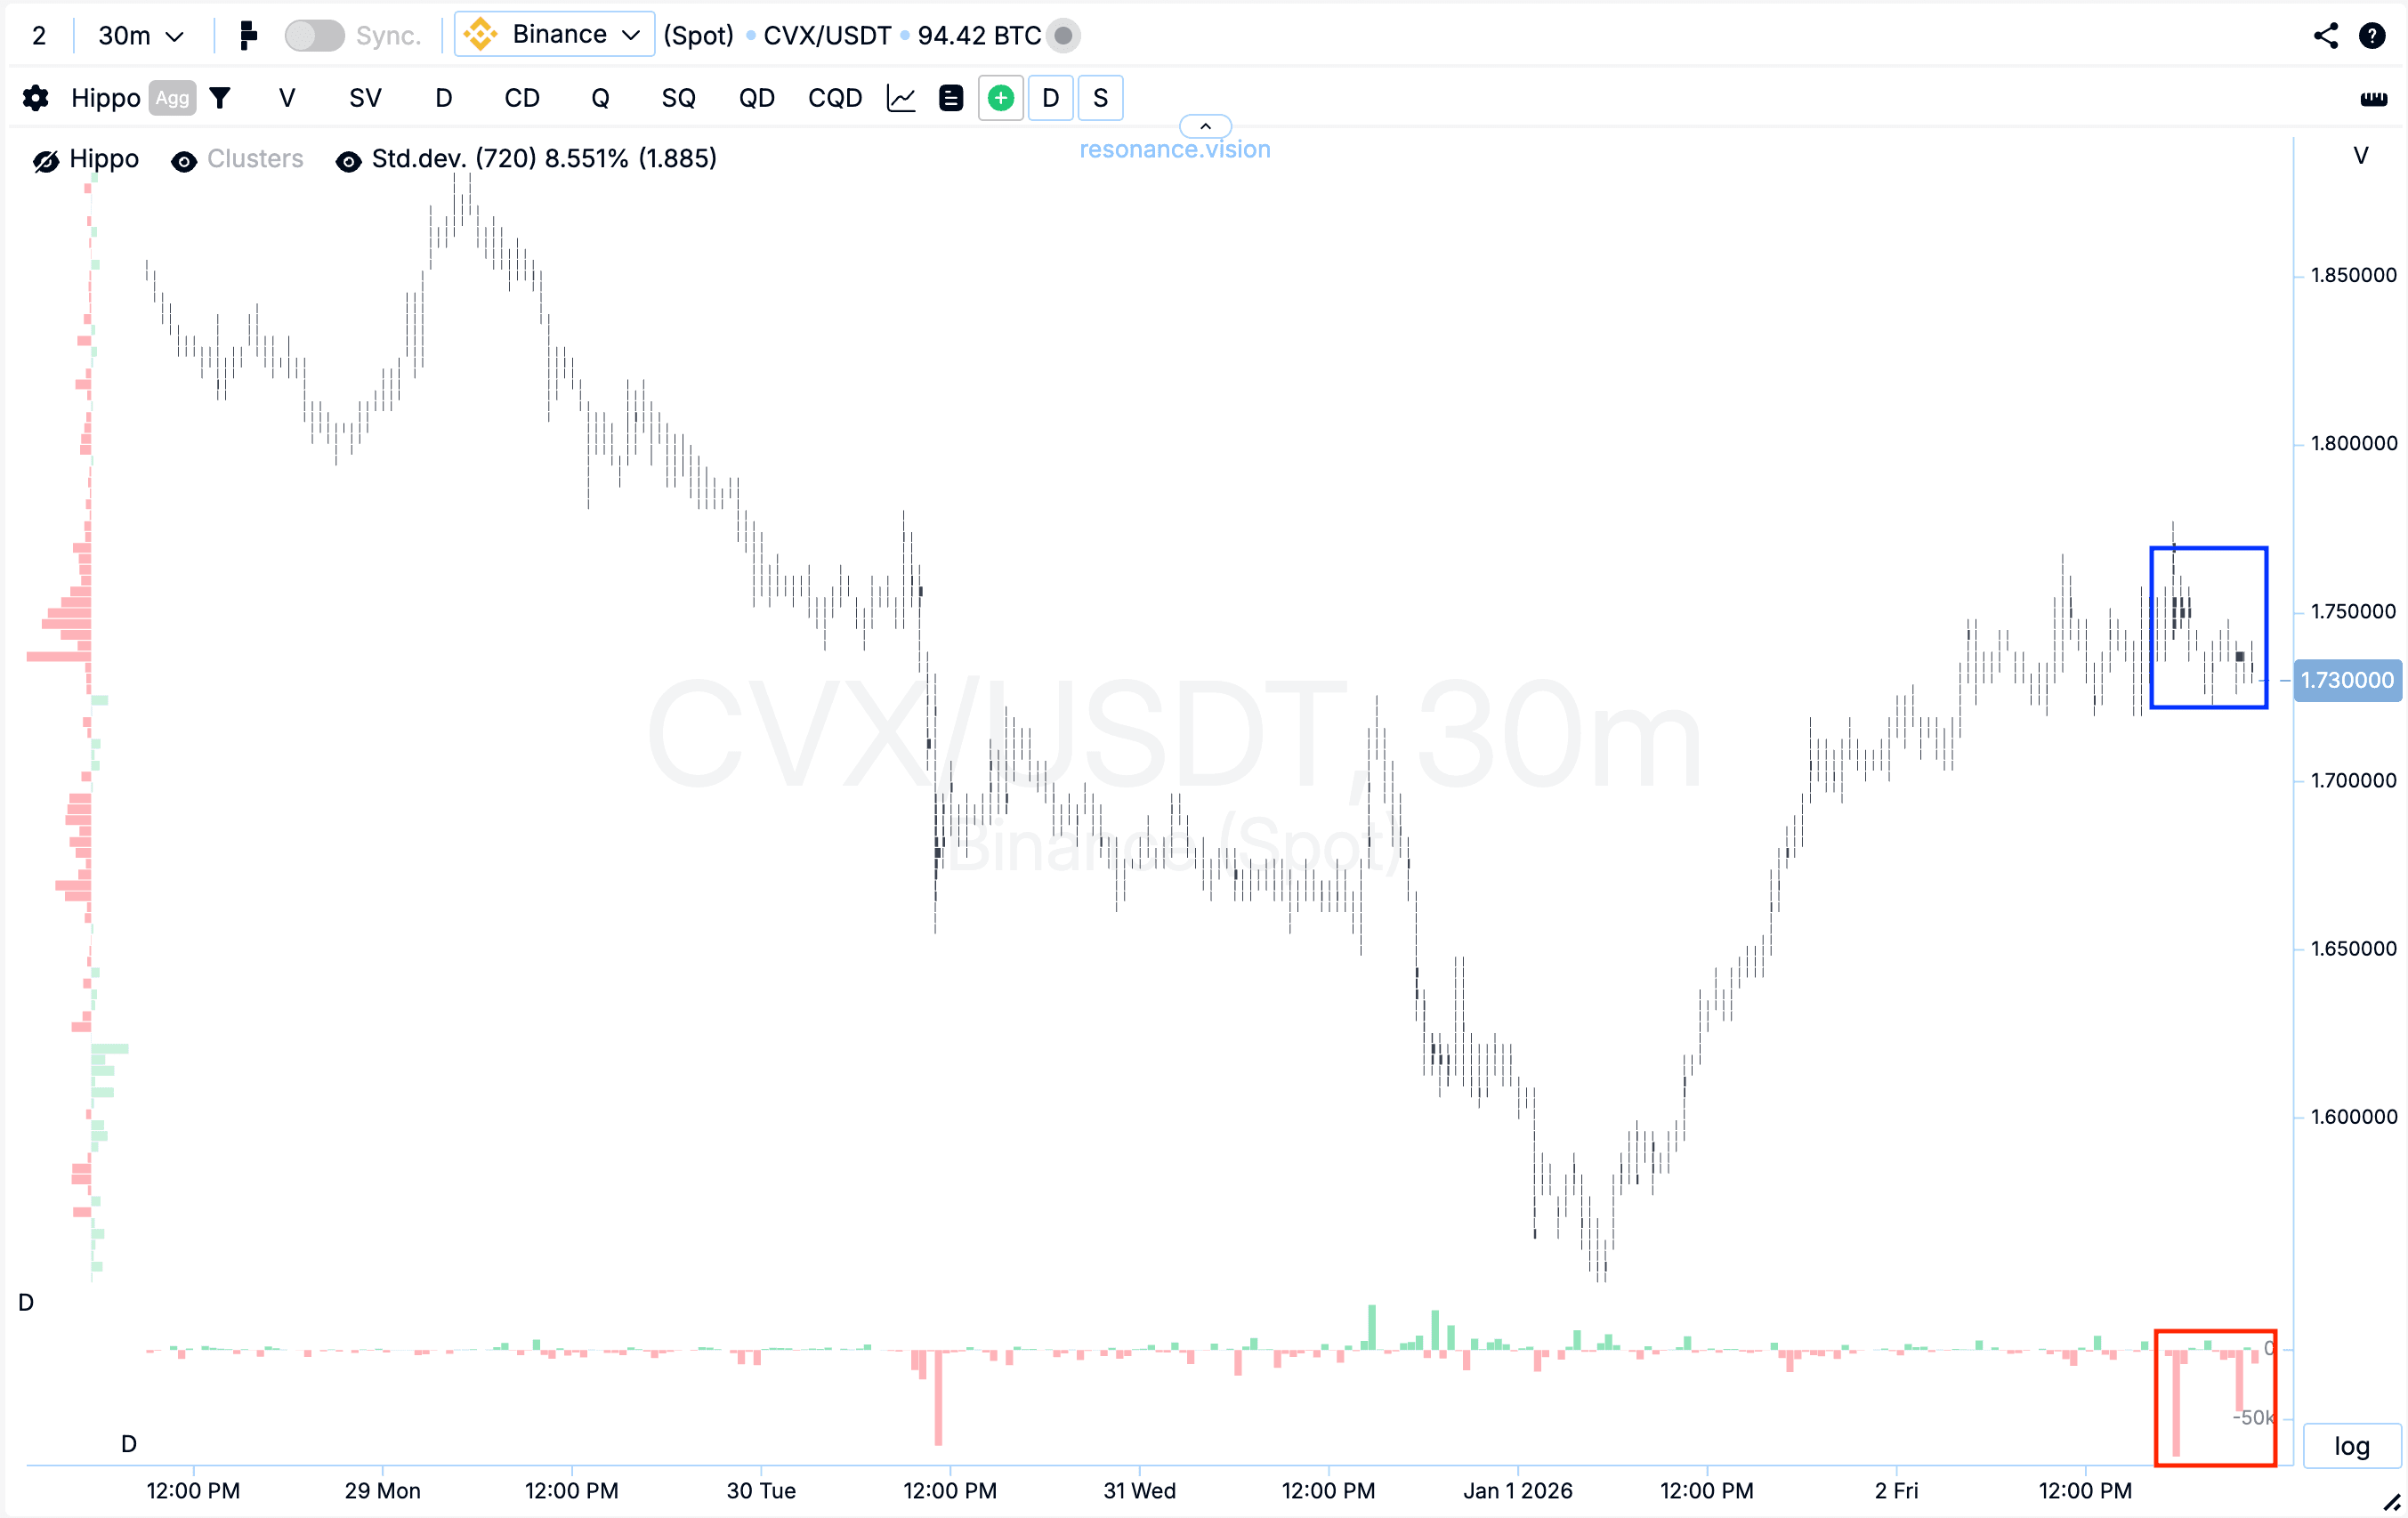
Кластерний графік: почали формуватися суттєві кластери за об’ємом (синій прямокутник). При цьому всередині них переважали ринкові продажі (червоний прямокутник), проте їхня ефективність помітно знизилася - ціна перестала знижуватися. Така реакція ринку вказує на ознаки локального дефіциту продавців та ослаблення тиску, що часто стає першим сигналом до можливої зміни ініціативи чи розвороту.
У Дешборді
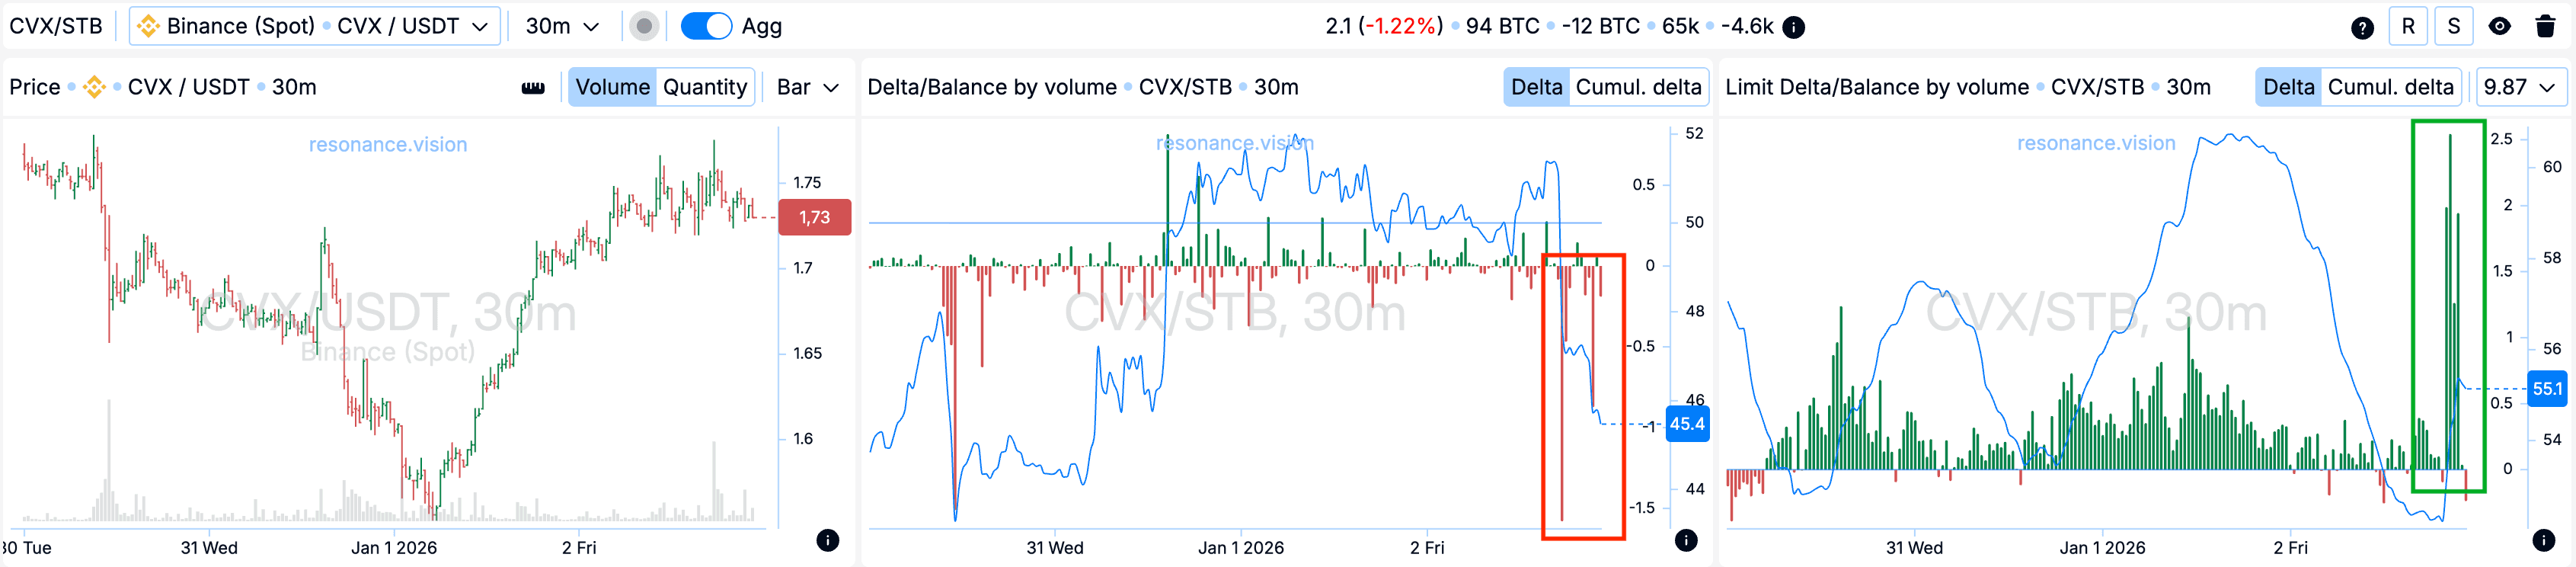
Дельта / Баланс за об’ємом та лімітна дельта: агреговані дані по всіх парах та біржах повністю підтверджують спостереження з кластерного графіка. У період, що розглядається, ринок перебував під вираженим тиском маркет-продажів, що виразно видно по гістограмі дельти (червоний прямокутник).
При цьому за лімітною дельтою зафіксовано сплеск заявок на покупку (зелений прямокутник). Така комбінація вказує на активне поглинання всього ринкового обсягу продажів, що входить, лімітними заявками на купівлю, що формує локальну підтримку в даному ціновому діапазоні.
Причини виходу
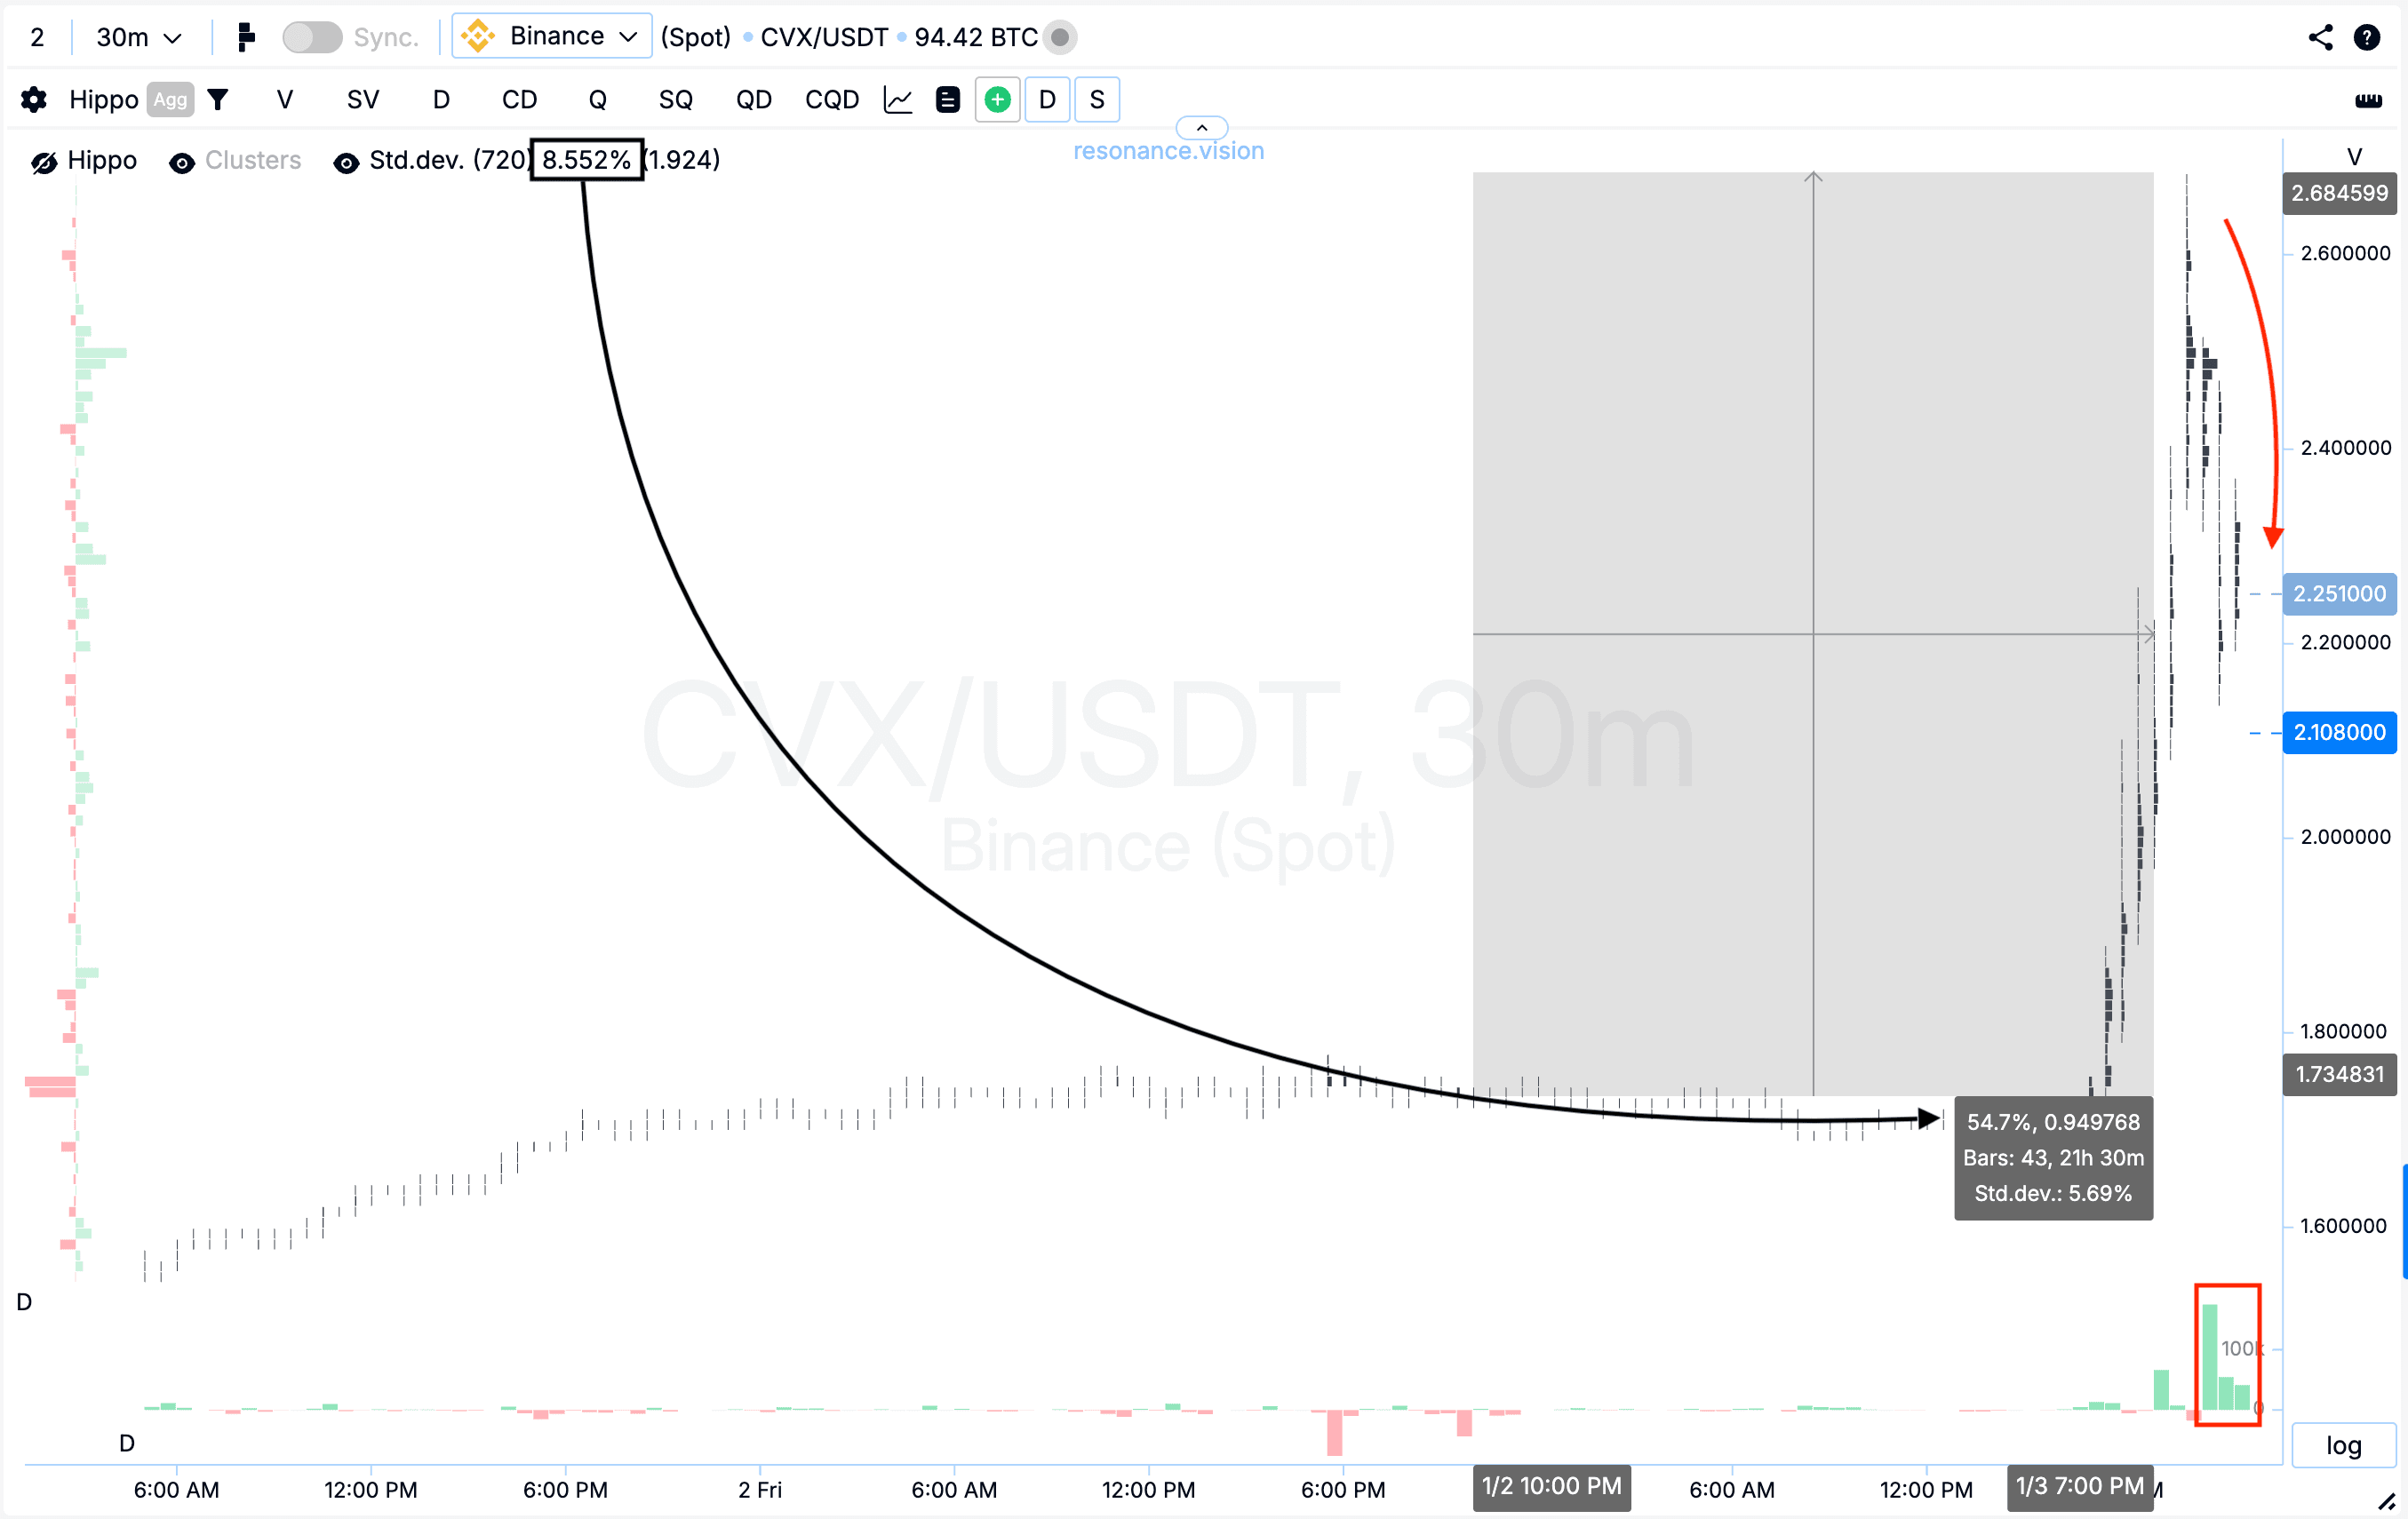
Кластерний графік: від точки входу ціна пройшла понад 50%, що відповідає понад шість стандартних рухів. На тлі покупок сформувався суттєвий відкат (червоний прямокутник і стрілка), що говорить про зниження ефективності покупців. Така структура свідчить про появу локального профіциту - покупці не здатні впевнено продавлювати ціну вище. У умовах фіксація позиції є найбільш зваженим і раціональним рішенням.
Висновок
У цьому вся аналіз ринку послідовно показав класичну картину переходу від тиску продавців до фази локального дефіциту. Незважаючи на переважання ринкового продажу, ціна перестала ефективно знижуватися, що вказувало на активне поглинання об’єму з боку лімітних заявок на покупку. Підтвердження цієї логіки одночасно на кластерному графіку та в агрегованих даних дельти дозволило об’єктивно визначити точку входу.
Подальший рух супроводжувався суттєвим зростанням, після якого з’явилися ознаки зниження ефективності покупців та формування локального профіциту. Такий підхід до аналізу об’єму та реакції ціни дає можливість вибудовувати угоди з чіткою логікою, зрозумілим сценарієм та контрольованим ризиком.
Стеж за новими статтями у нашому телеграм каналі.
Не треба вигадувати складних схем та шукати “грааль”. Використовуйте інструменти платформи Resonance.
Реєструйся за посиланням - отримуй бонус і починай заробляти:
OKX | BingX | KuCoin.
Промокод TOPBLOG дає тобі 10% знижки на будь-який тарифний план Resonance.
Рекомендовані статті


