DOGE +15.6% (Directional Strategy Resonance)

Analysis of a deal on DOGE/USDT, where despite strong pressure from sellers, the price held at local minimums, and buyers’ limit orders began to absorb volumes. I will show how, through the analysis of clusters, delta and Z-Score, it was possible to enter in time, strengthen the position with additional orders and fix +15.6% of the movement before a sharp rollback.
Table of contents

Coin: DOGE/USDT
Risk: Medium
Understanding level: Beginner
Entry reasons
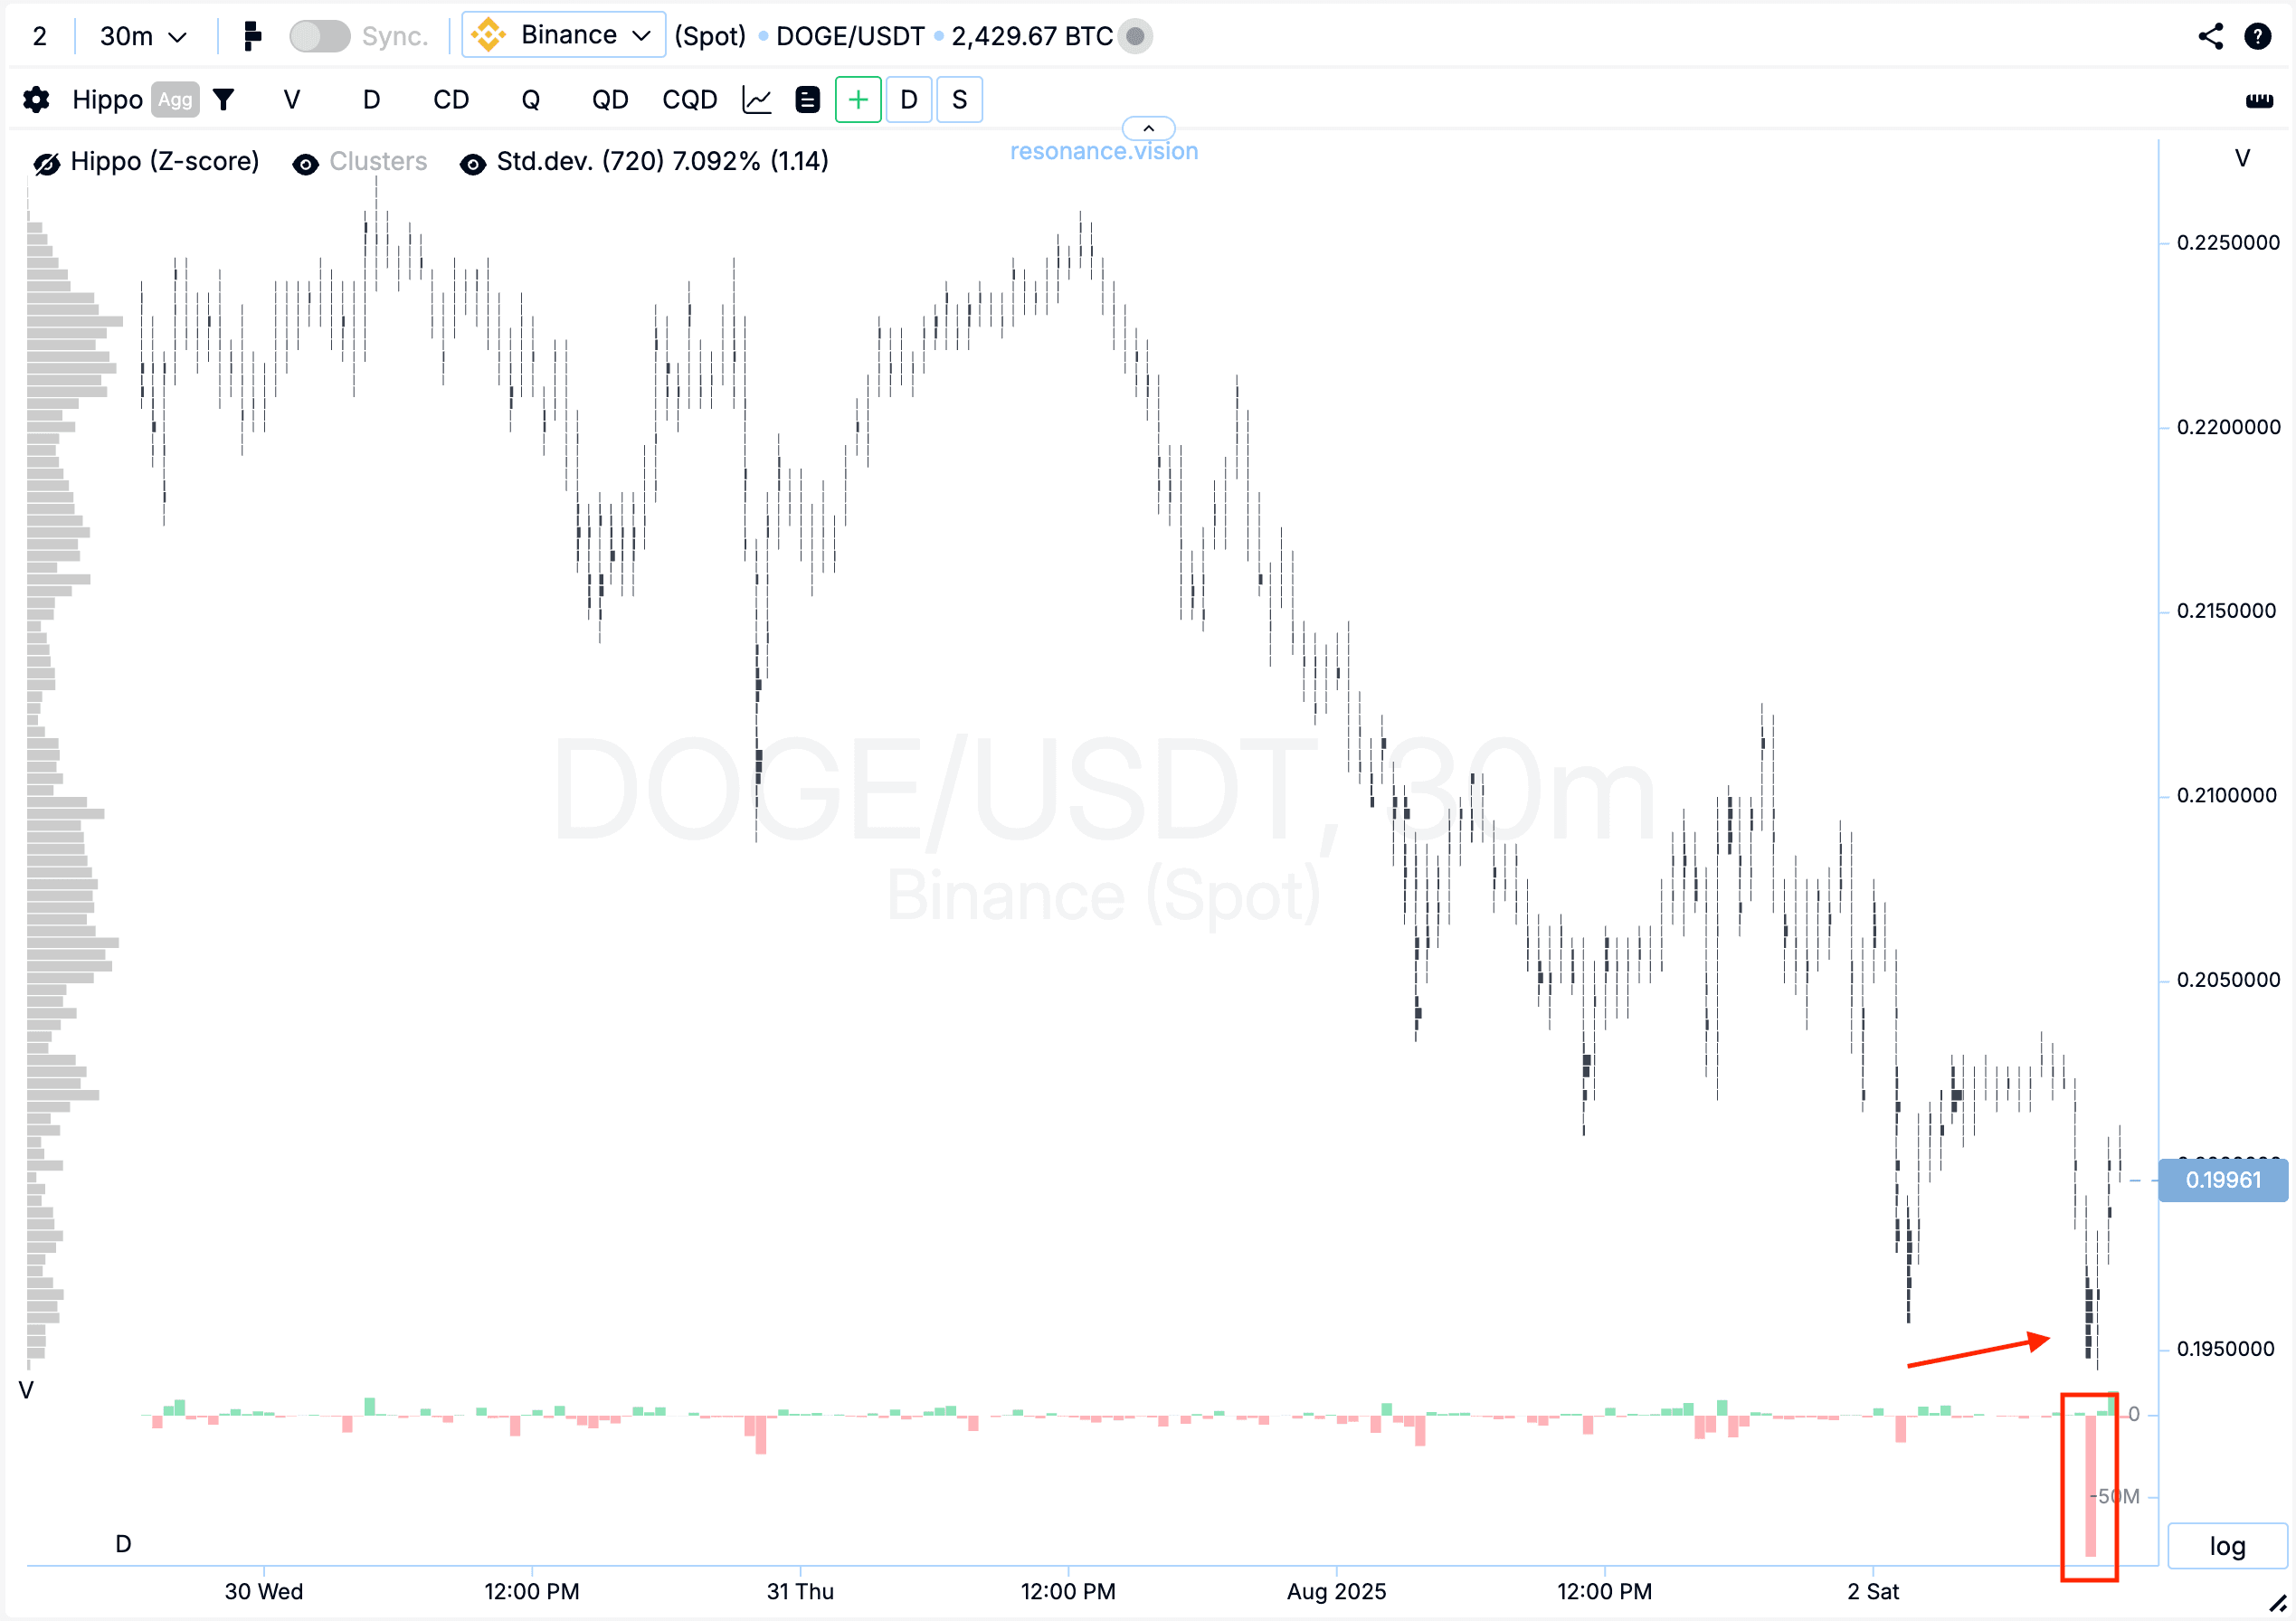
Cluster chart: In the lower part of the price range, volume clusters began to form with a clear dominance of sell orders (red rectangle and arrow). However, despite noticeable selling pressure, the price did not drop significantly and barely updated the local low. This may indicate weakening seller initiative and a potential shift of control to buyers.
In the Dashboard
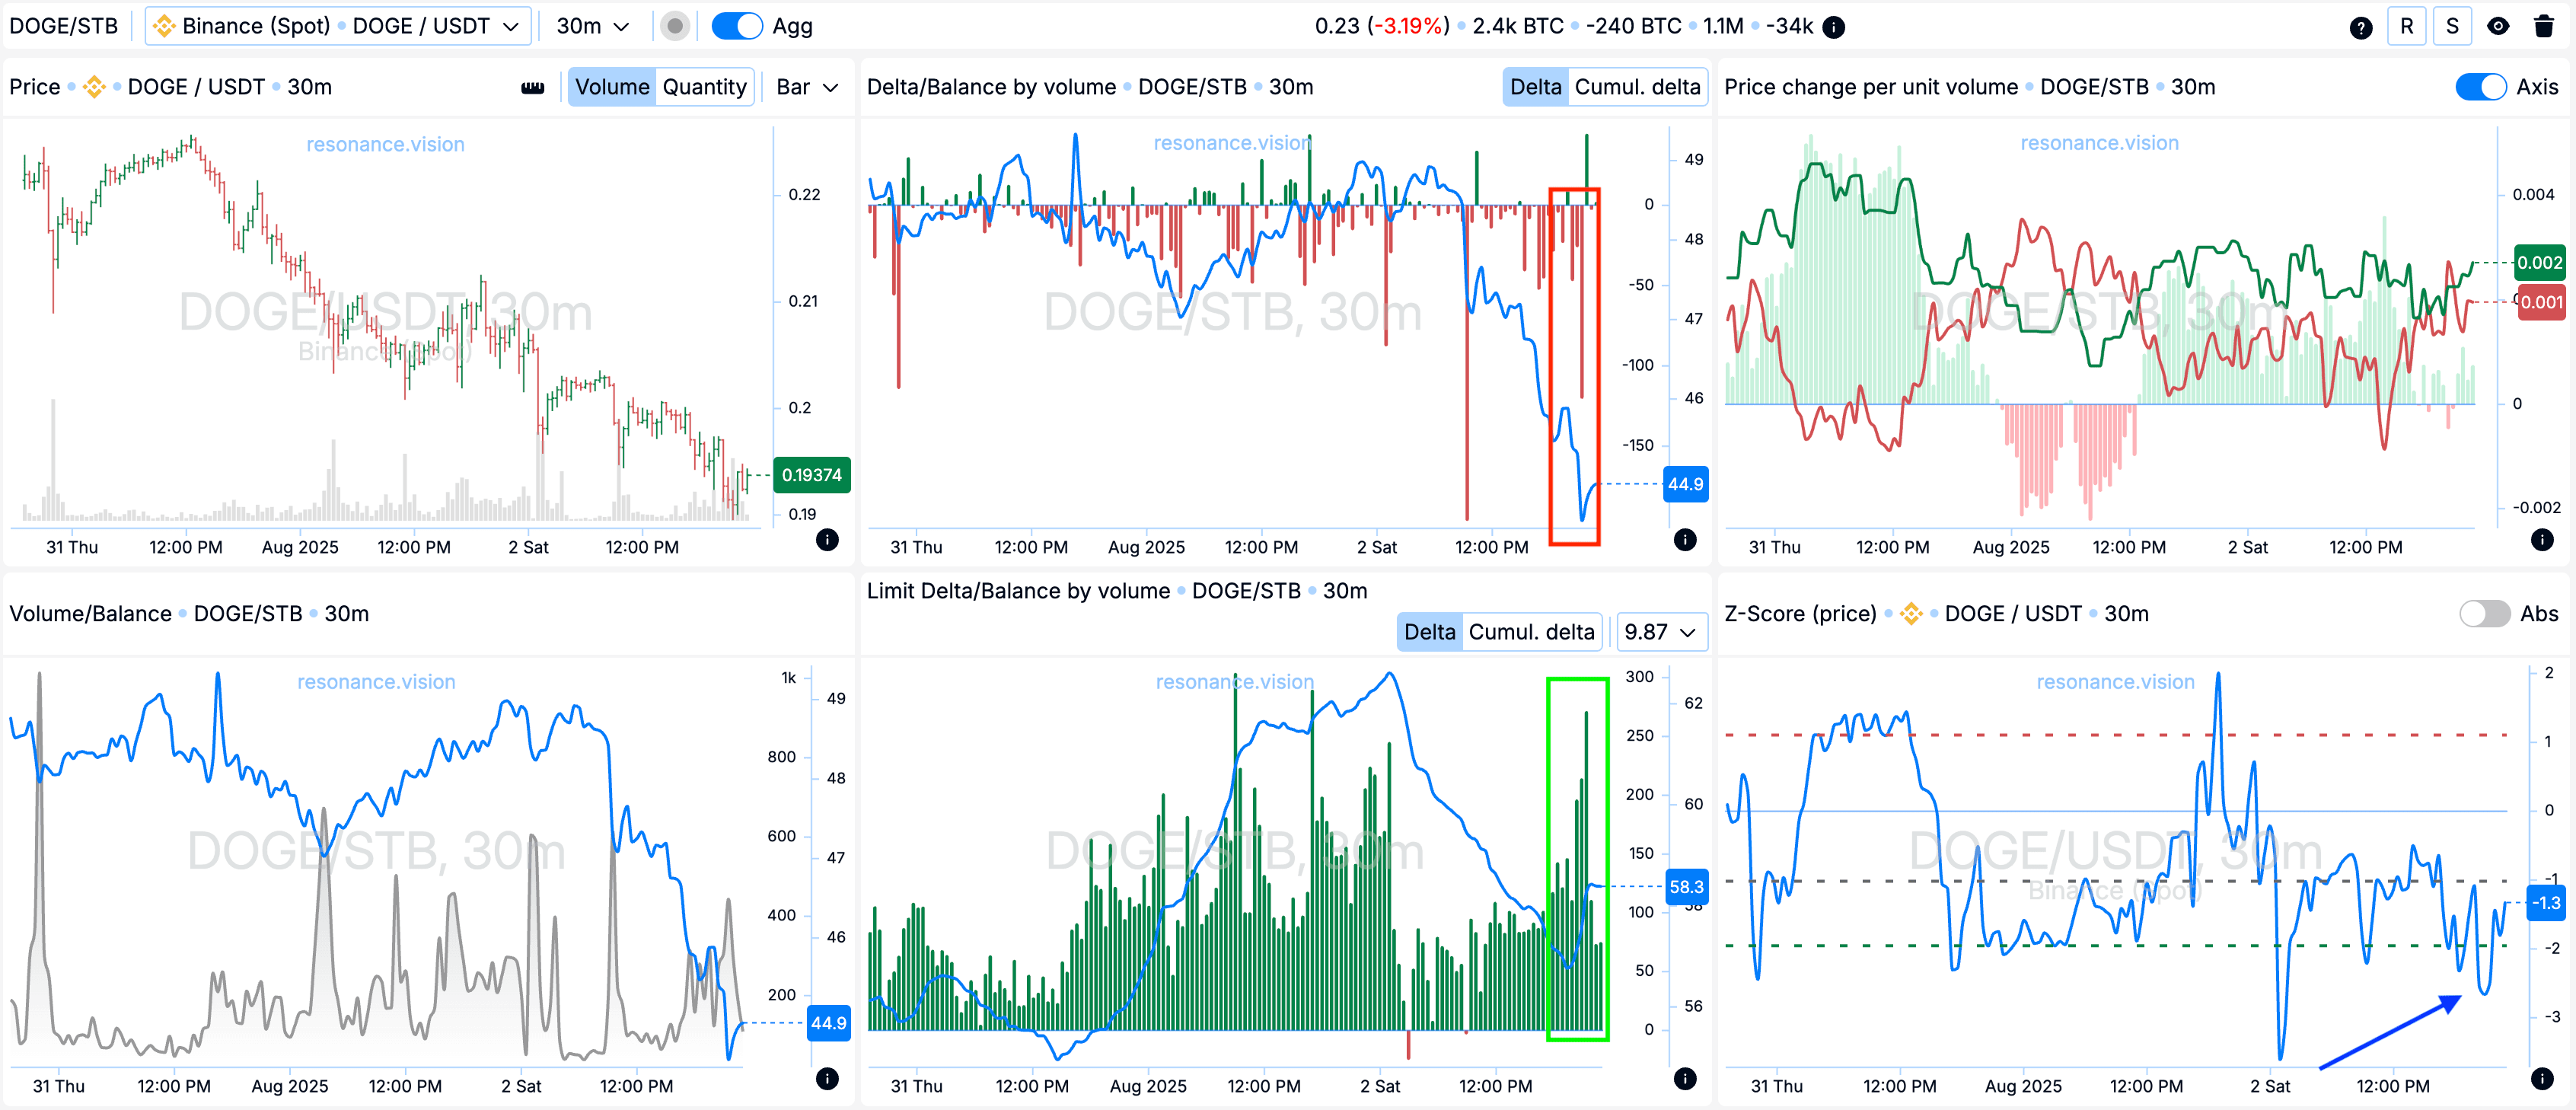
Delta / Volume balance & Limit delta: When analyzing aggregated data, there was a clear shift in market order balance toward selling, with sell delta bars showing significantly stronger readings (red rectangle).
At the same time, limit order data showed spikes indicating a clear dominance of buyers (green rectangle). This potentially suggests that participants were ready to absorb sell volumes at the current price range through limit orders.
Z-Score (price): Additionally, during the anomalous selling, the price was pushed down by more than 2 standard deviations (blue arrow). Such a deviation is statistically unusual and is often followed by a pause in movement or a potential reversal.
Position management
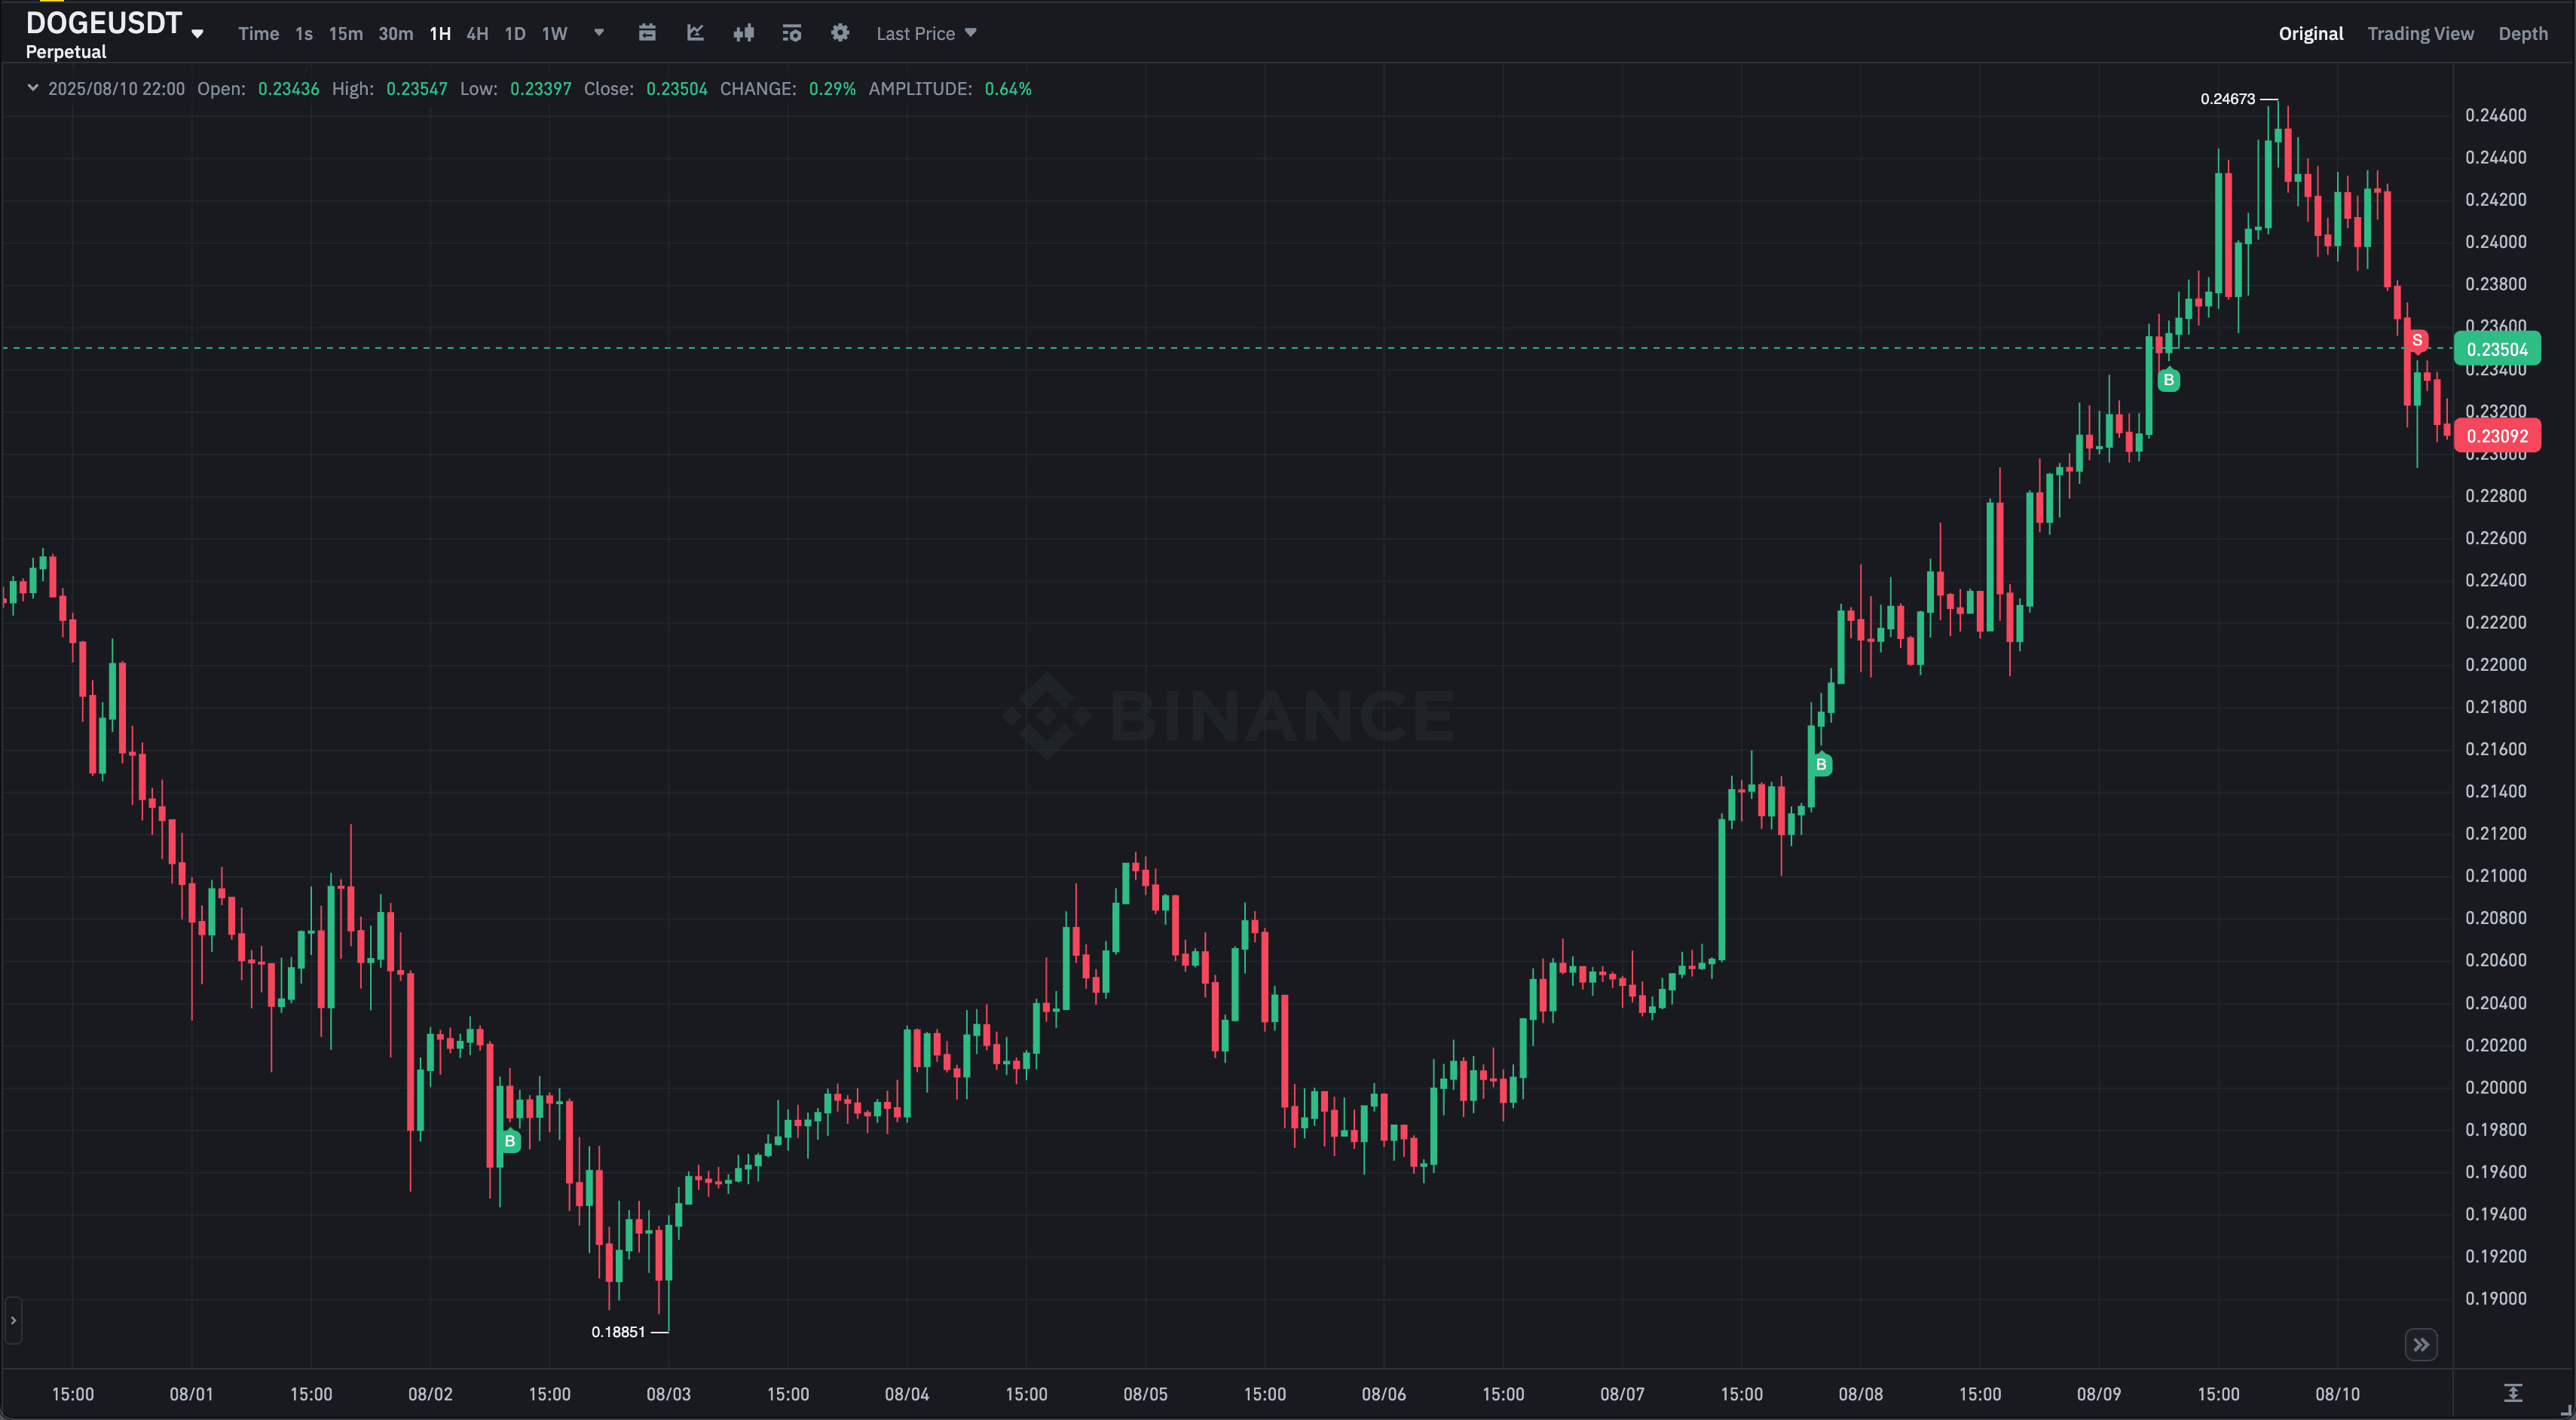
During the trade, 2 additional entries were made, as seen on the screenshot. Each one not only strengthened the overall position but also allowed the trading idea to be executed more effectively.
Exit reasons
Cluster chart: In the marked area (blue rectangle), the stop-loss was moved to the price level of the last additional entry. This decision was made to protect against a possible sharp pullback — which eventually happened.
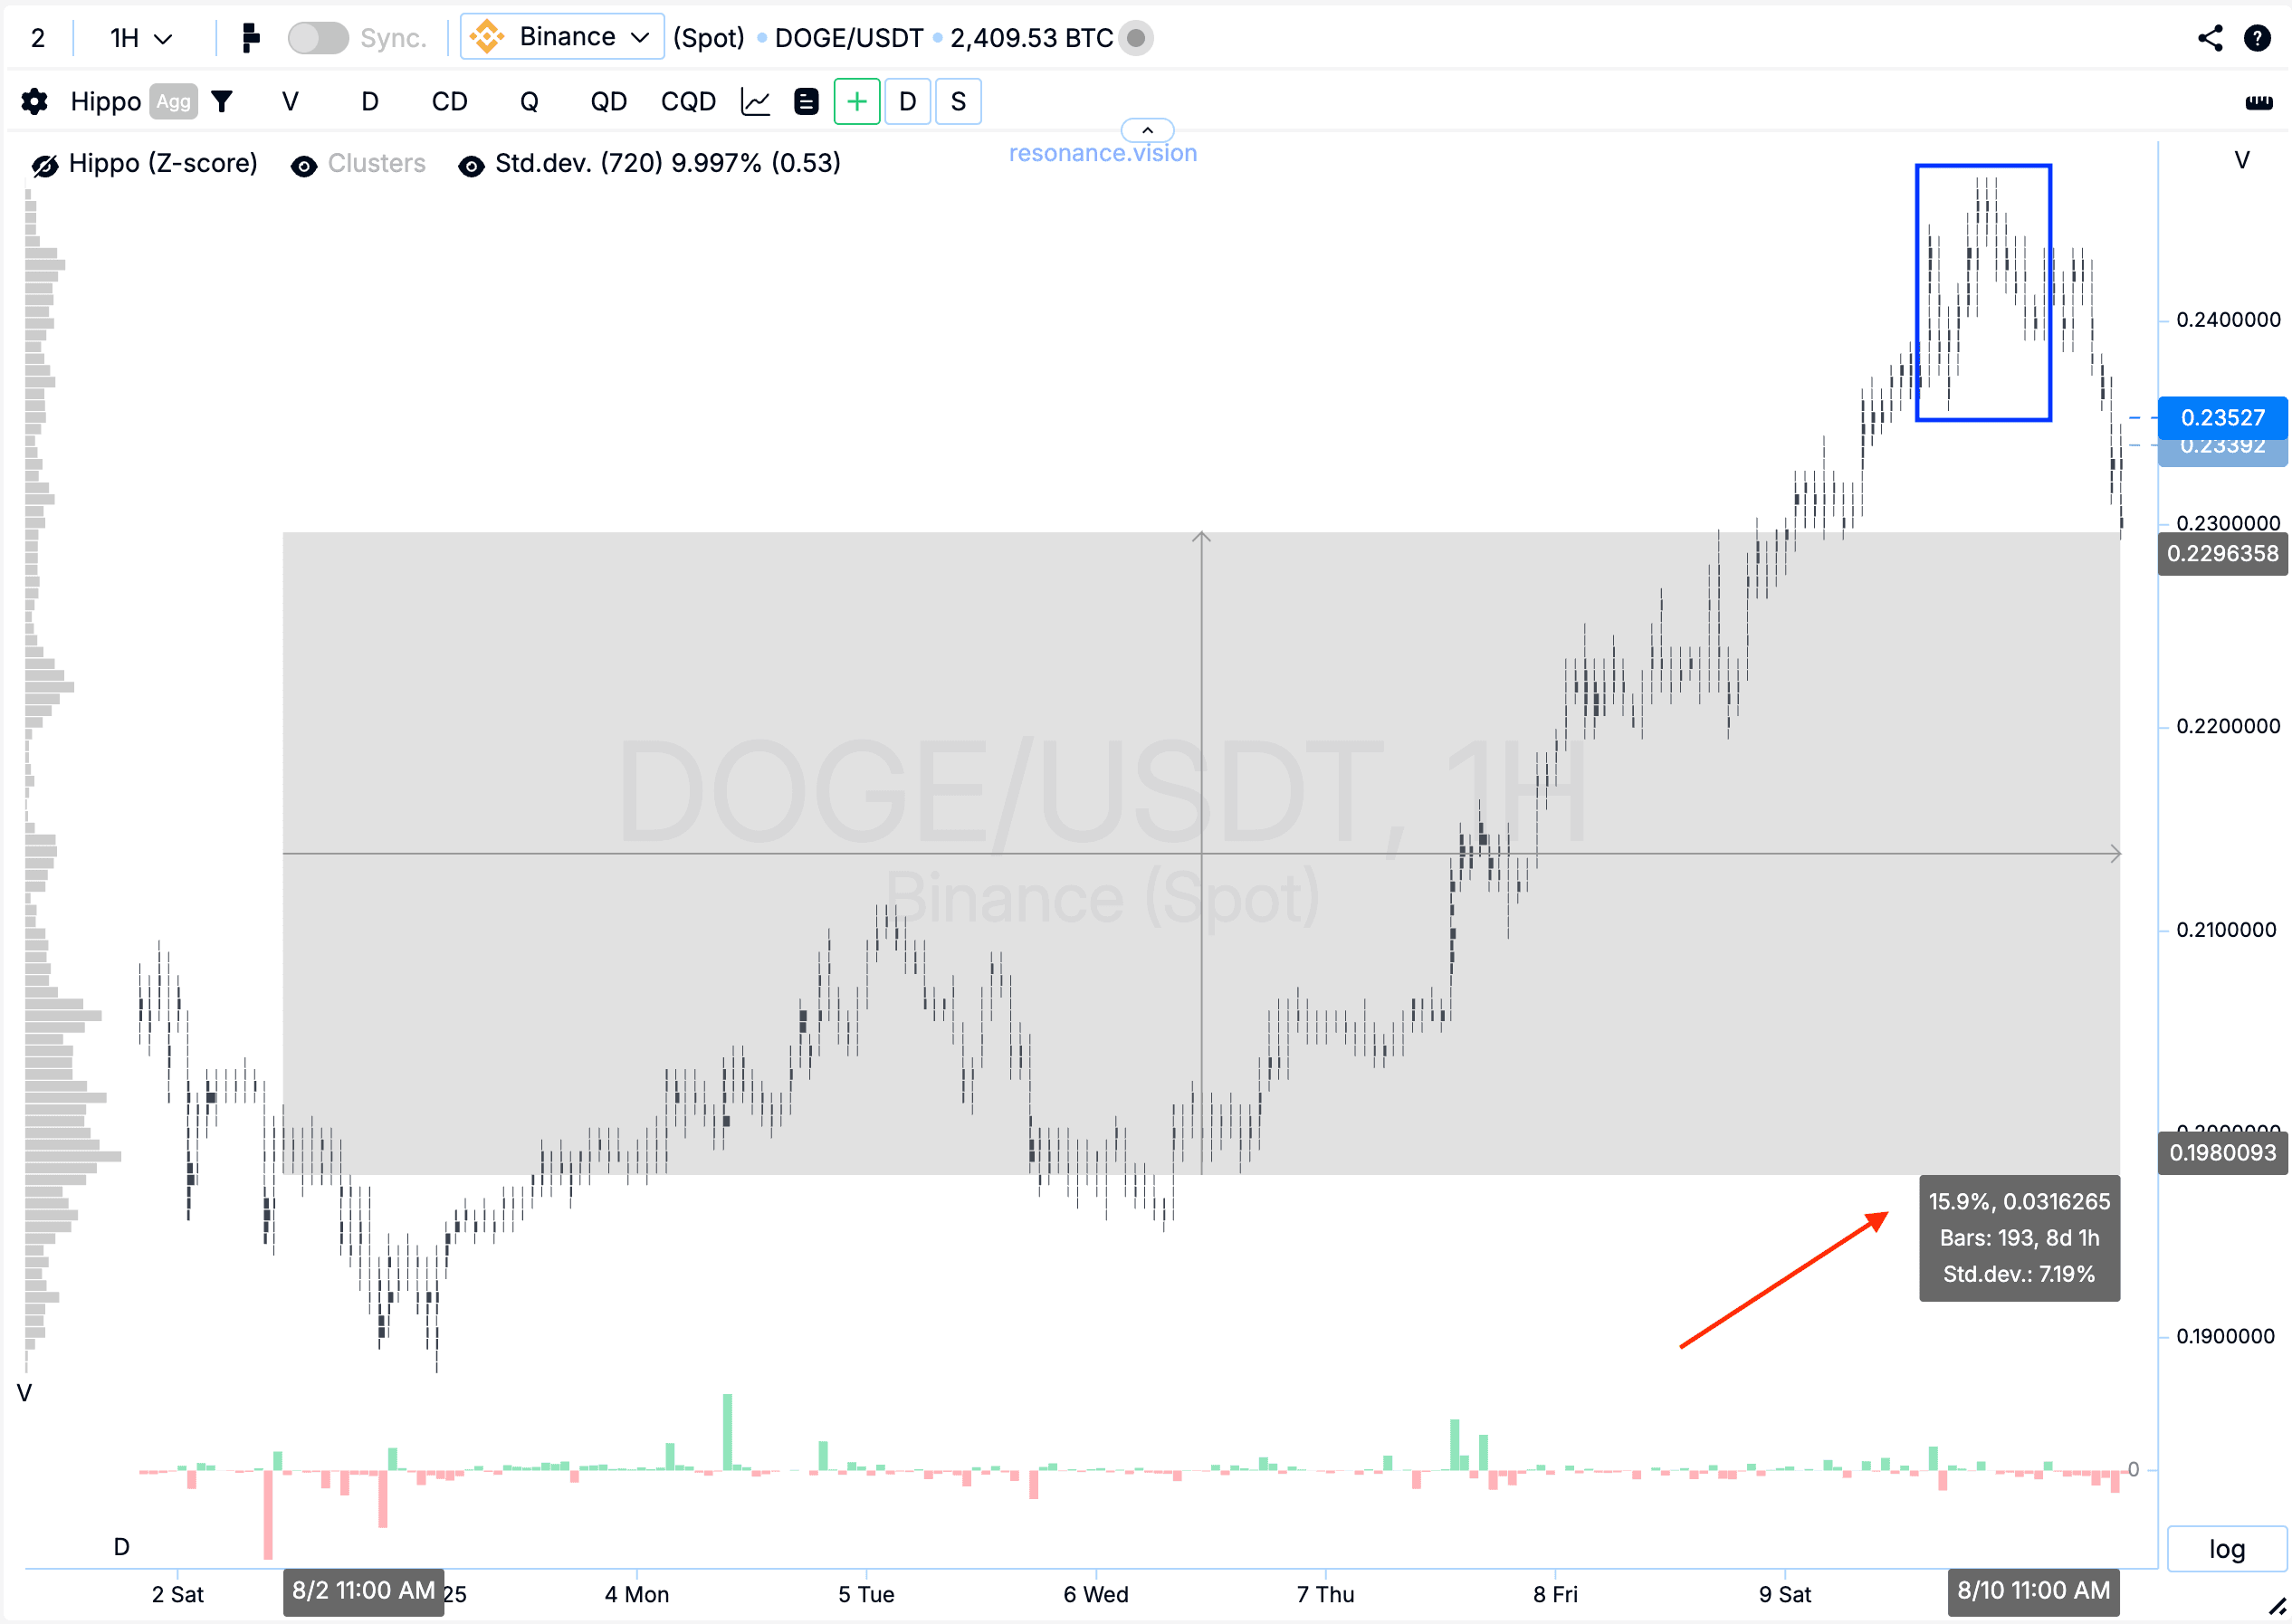
Result: In any case, the trade yielded a solid gain, capturing 15.6% of the price move.
Conclusion
Despite a noticeable dominance of market selling, the price holding near local lows and the activity of limit buyers indicated weakening selling pressure and the potential for a reversal. Additional entries maximized the idea’s execution and boosted final profits. Closing the position after moving the stop to breakeven protected against a sharp pullback, locking in a +15.6% price move. This case once again highlights the importance of carefully analyzing the balance of forces and managing the position in a timely manner.
Follow new insights in our telegram channel.
No need to invent complex schemes and look for the "grail". Use the Resonance platform tools.
Register via the link — get a bonus and start earning:
OKX | BingX | KuCoin.
Promo code TOPBLOG gives you a 10% discount on any Resonance tariff plan.
Recommended articles


