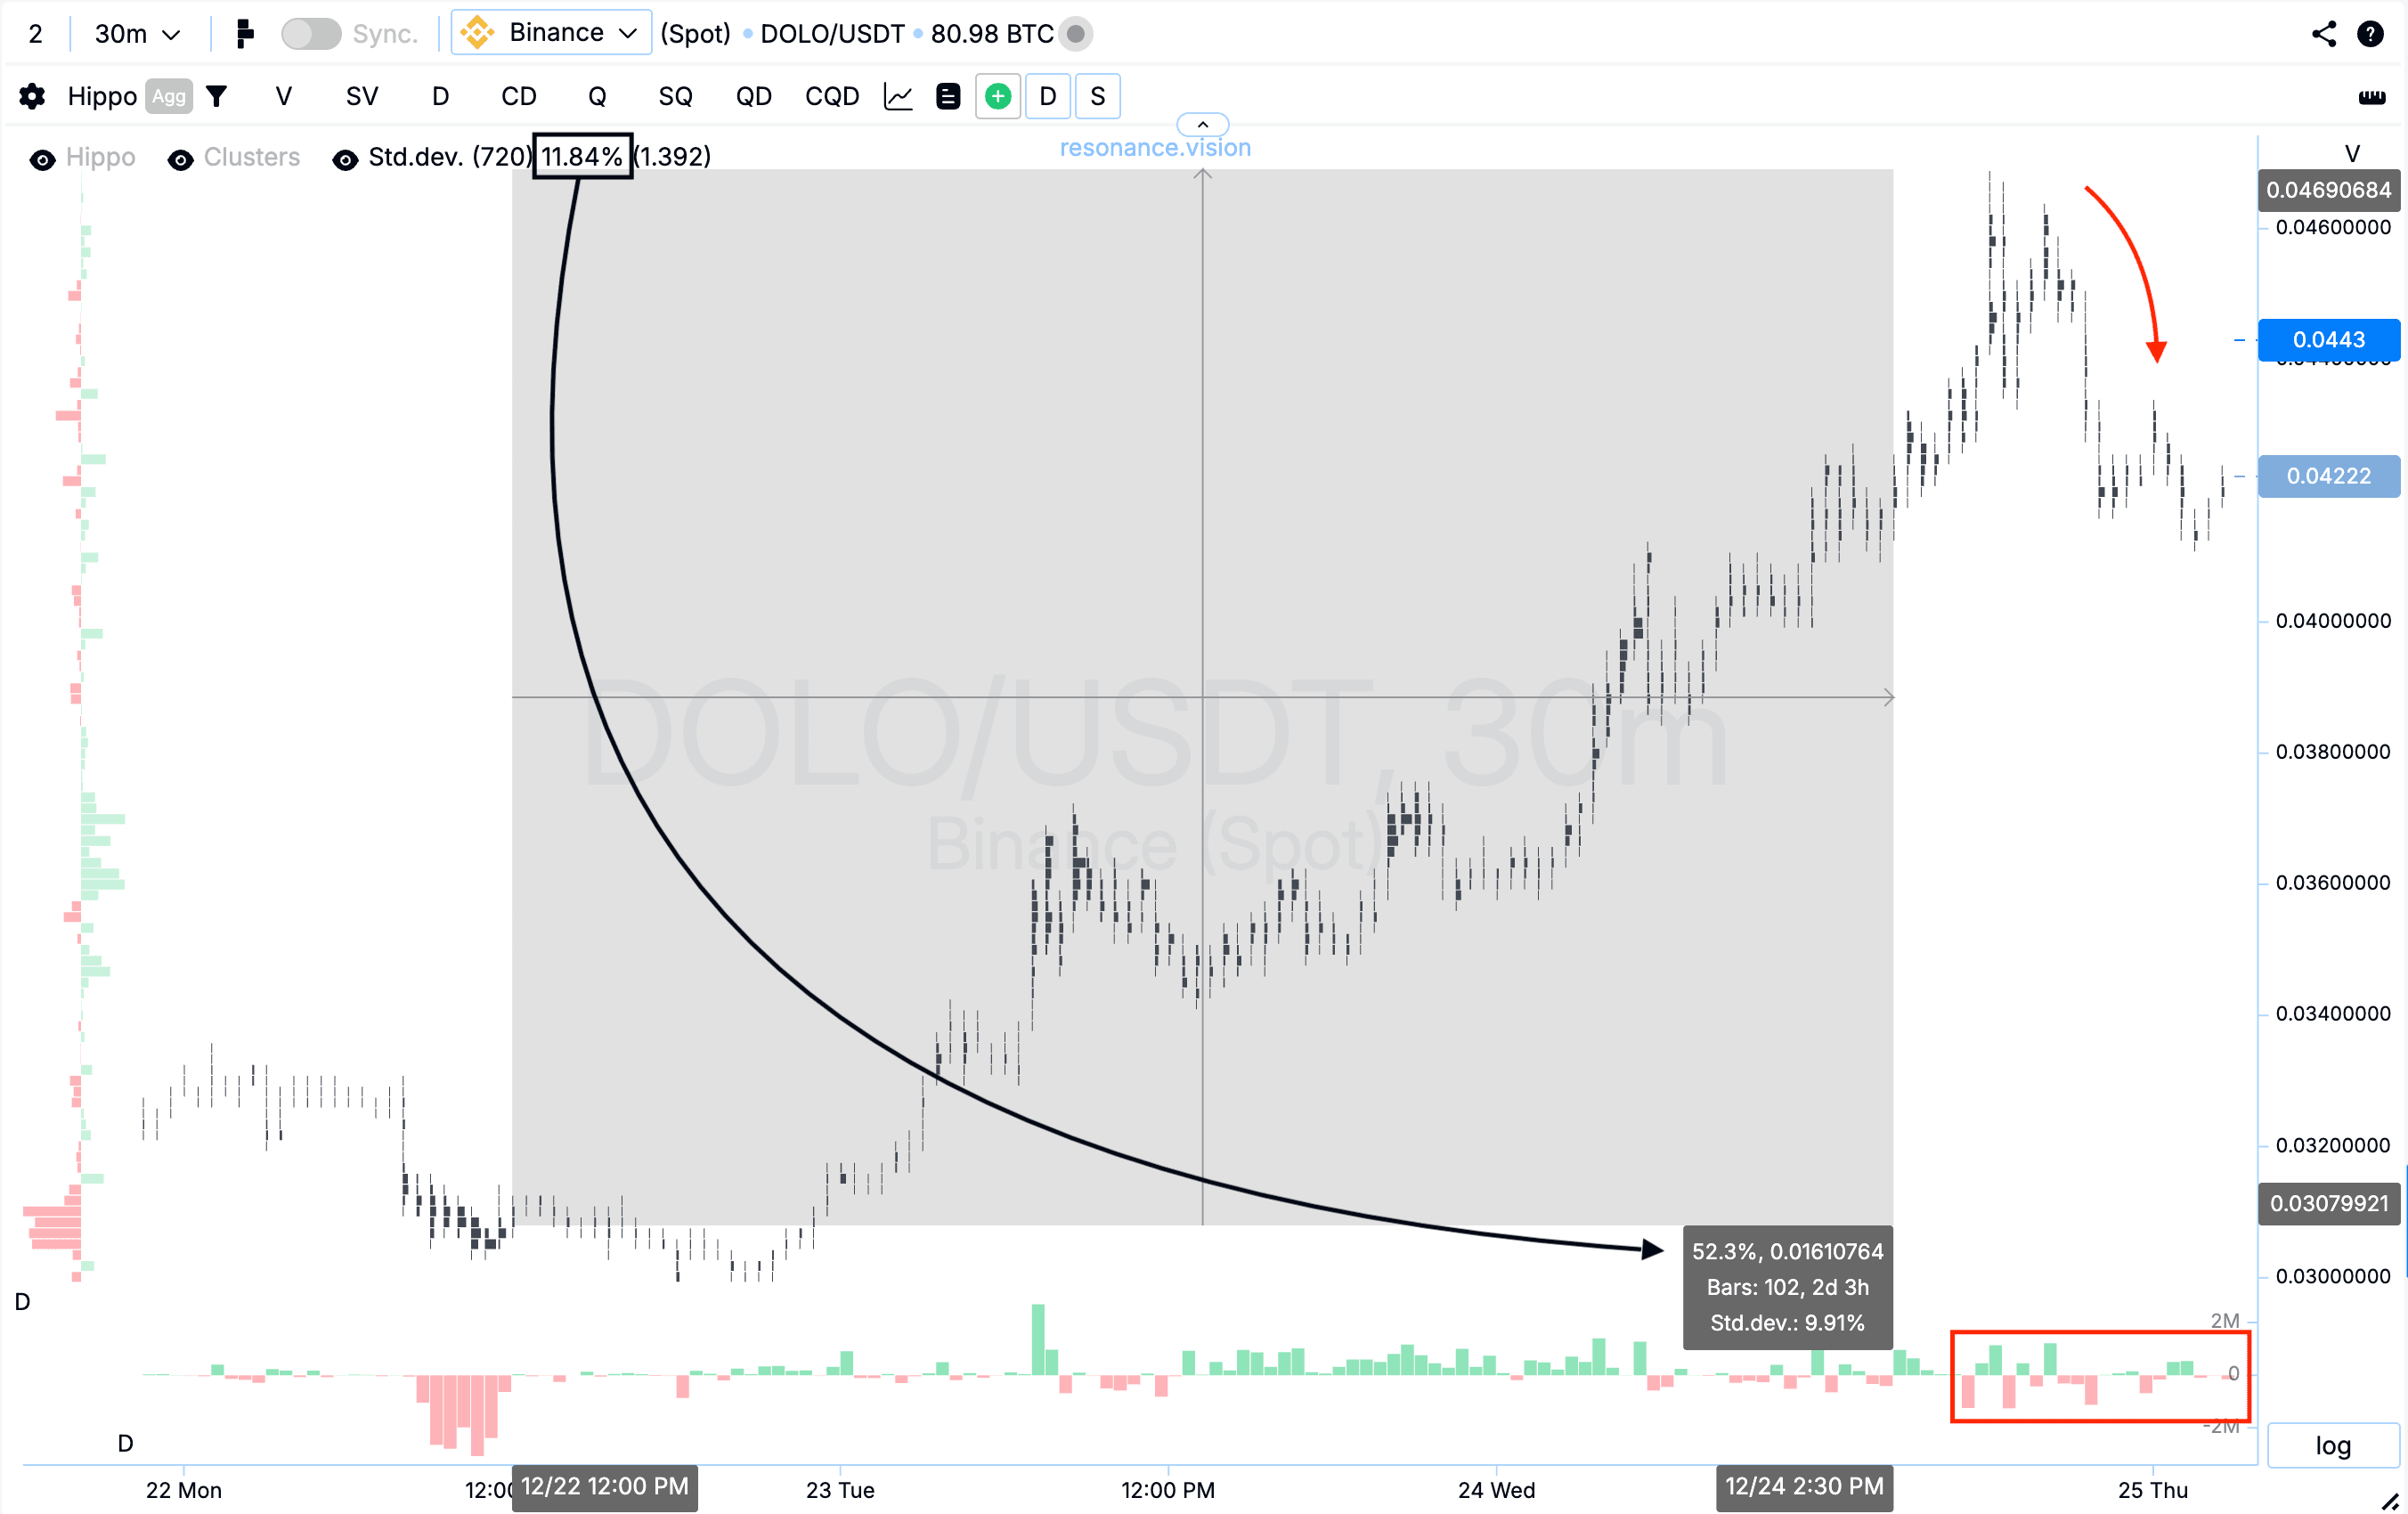
DOLO +52,3% (Напрямкова стратегія Резонанс)

Розбір ґрунтується на аналізі об’єму та реакції ціни: при зростанні продажів їх ефективність знижувалася, що вказувало на формування локального дефіциту. Поєднання кластерного графіка, дельти та Z-Score дозволило об’єктивно визначити точку входу та своєчасно зафіксувати рух при ослабленні купівельної ініціативи.
Зміст

Монета: DOLO/USDT
Ризик: високий
Рівень розуміння: новачок
Причини входу
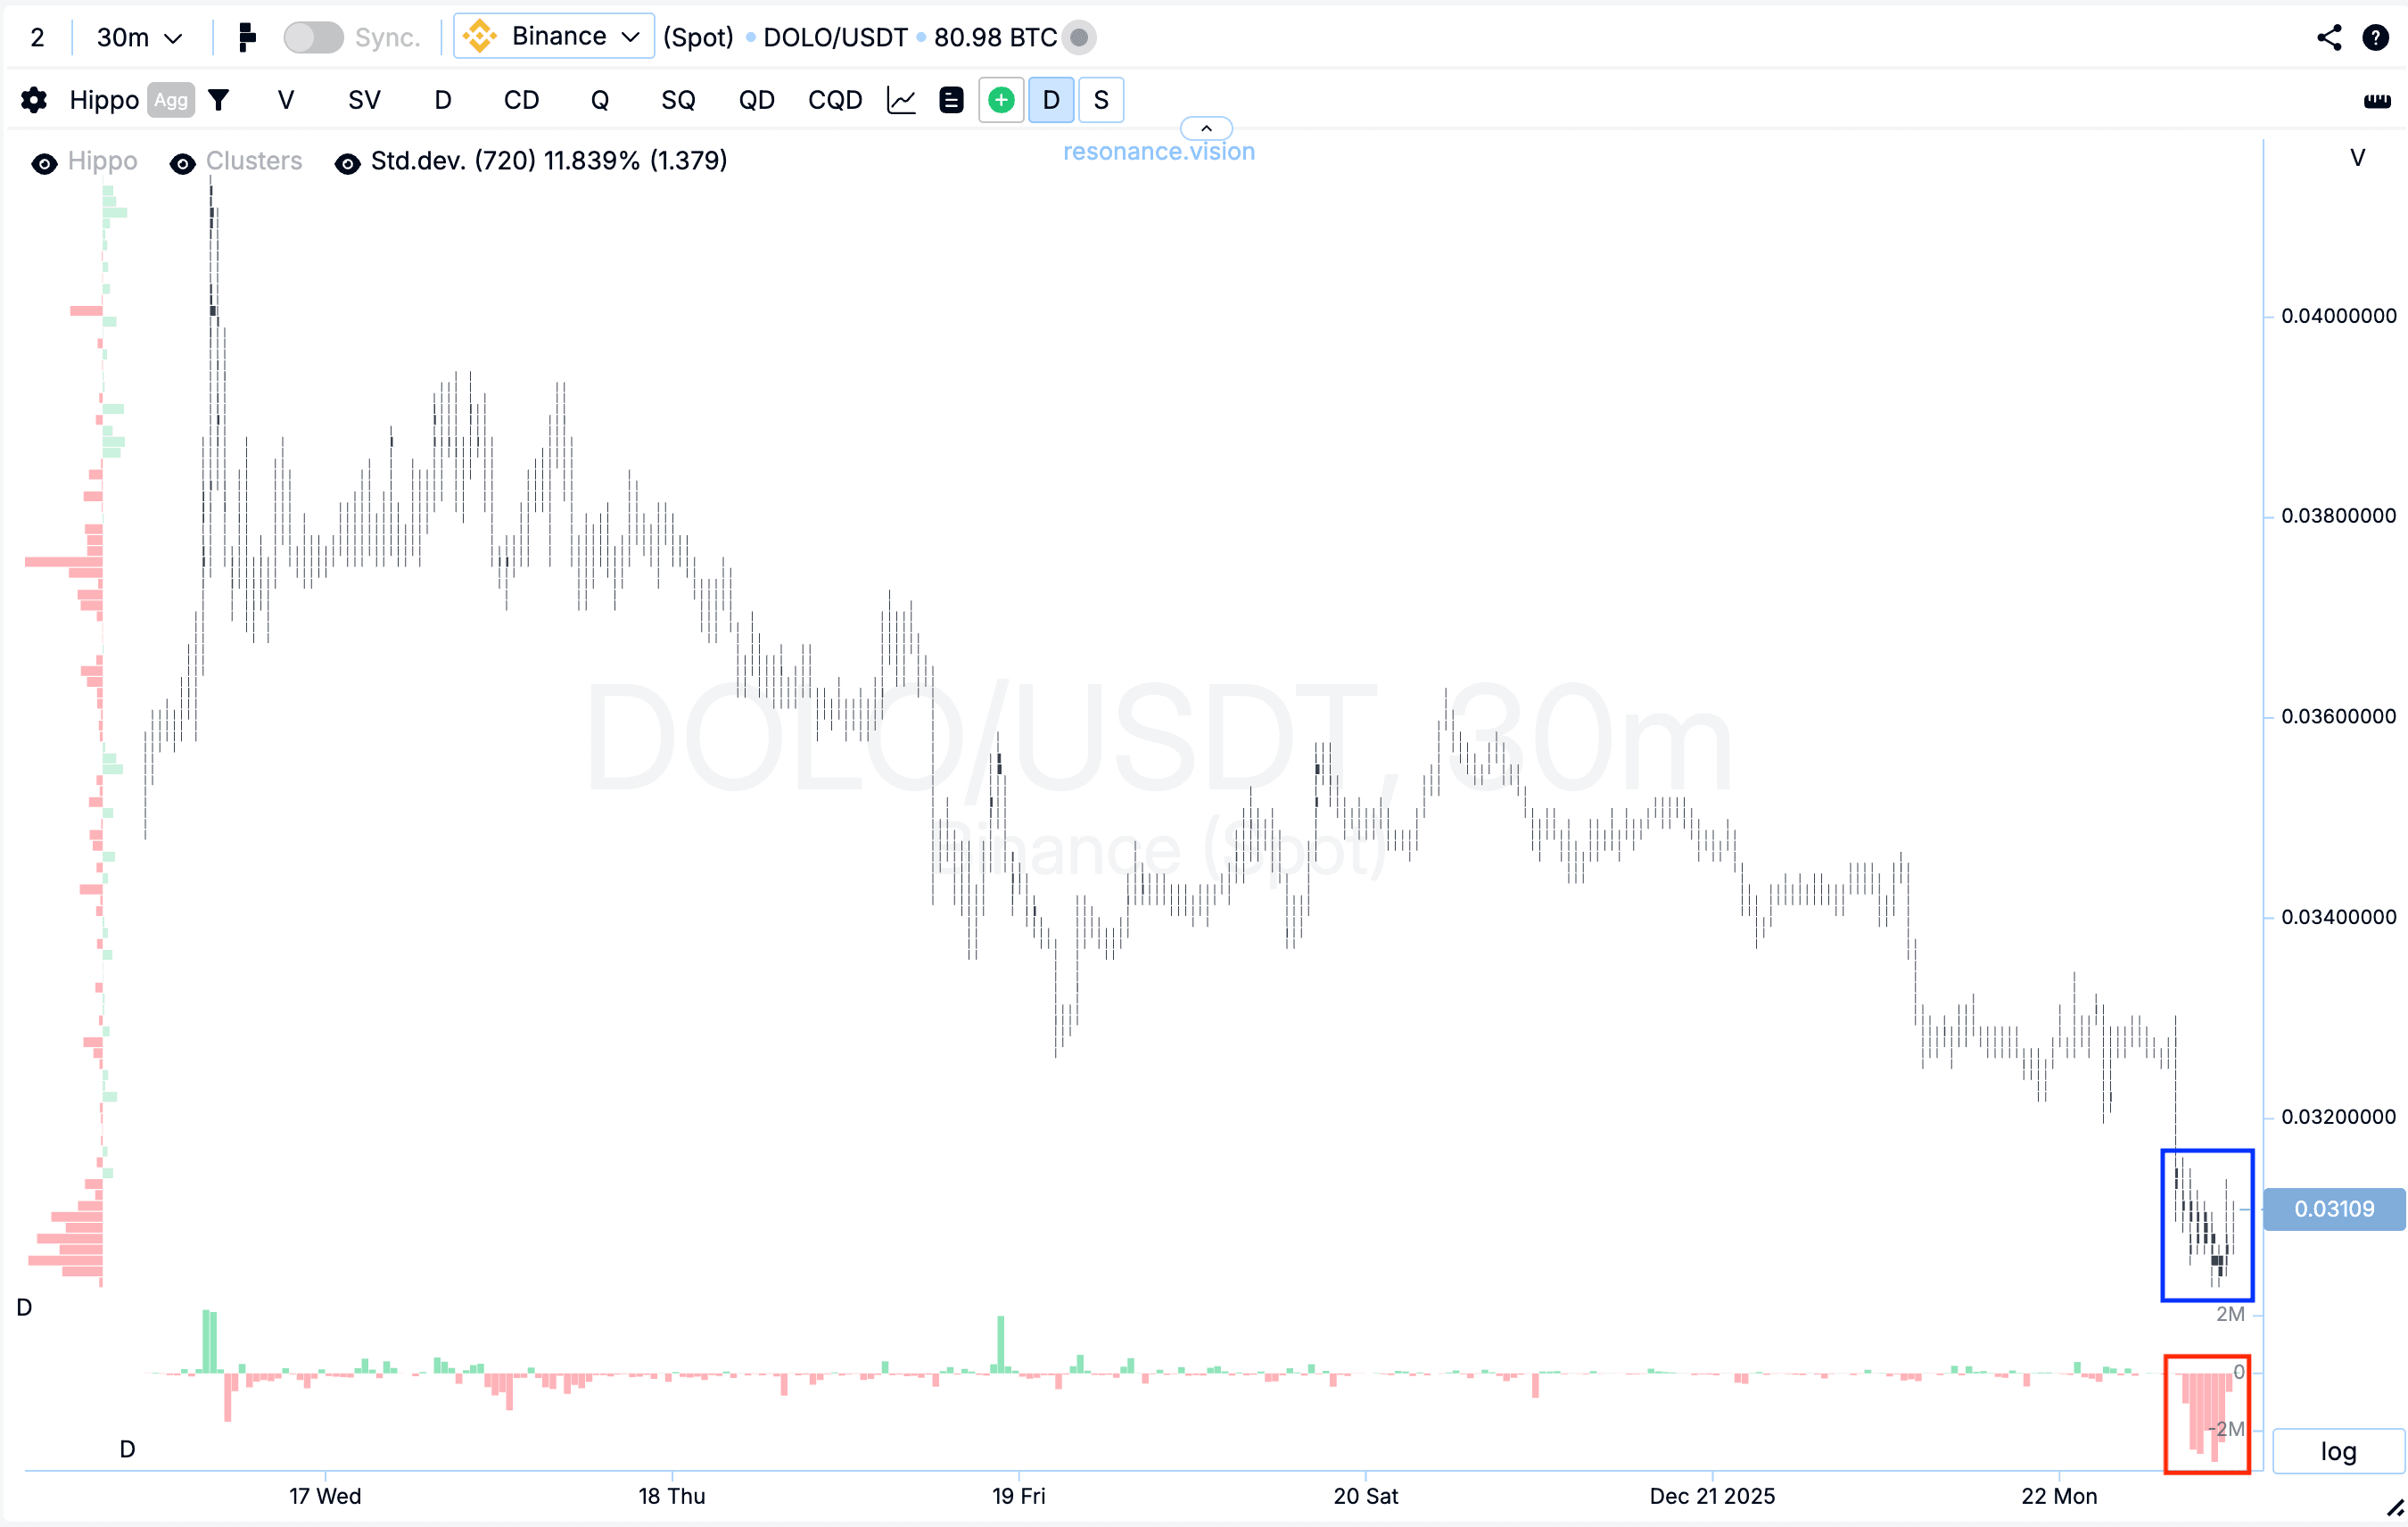
Кластерний графік: на етапі зниження сформувалися аномальні об’ємні кластери (синій прямокутник). Ці об’єми супроводжувалися активними маркет-продажами, проте їхня ефективність помітно знизилася - ціна перестала істотно знижуватися (червоний прямокутник). Подібна реакція вказує на формування локального дефіциту та ослаблення тиску з боку продавців, що часто стає сигналом до можливої зміни ініціативи чи локального розвороту.
У Дешборді
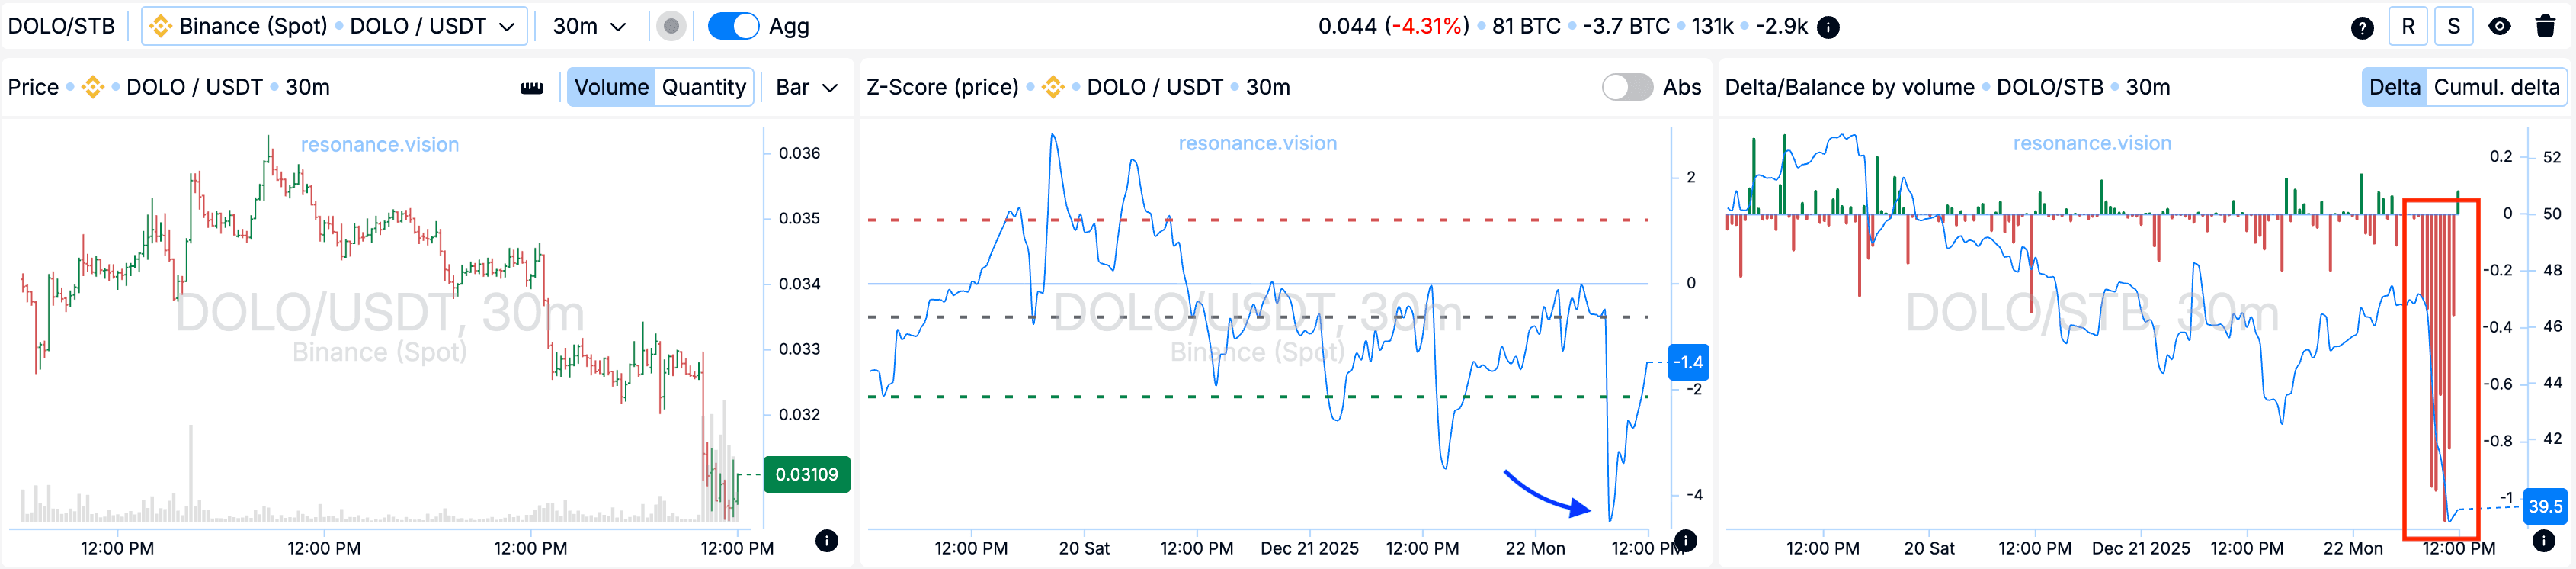
Дельта / Баланс за об’ємом: агреговані дані з усіх пар і бірж повністю підтверджують картину, що спостерігається на кластерному графіку. У період, що розглядається, ринок перебував під вираженим тиском маркет-продажів, що виразно видно по гістограмі дельти (червоний прямокутник). Незважаючи на це, ціна утримувалася, що говорить про те, що лімітні учасники активно поглинають весь ринковий об’єм продажів, що входить, формуючи локальну підтримку.
Z-Score (ціна): додатково на піку було зафіксовано відхилення ціни вниз більш ніж на 4 стандартні відхилення (синя стрілка). Подібні аномалії говорять про можливу ймовірність локального розвороту або зупинення руху.
Причини виходу
Кластерний графік: після точки входу ціна зросла більш ніж на 50%, що відповідає понад чотири стандартні рухи для даного активу. З розвитком цього зростання ринку почали переважати маркет-продажу, і натомість яких сформувався відчутний відкат. Така динаміка свідчить про ослаблення ініціативи із боку покупців. У умовах фіксація позиції виглядала раціональним рішенням, що дозволяє забрати реалізований рух без збільшення ризику.
Висновок
Ринок чітко продемонстрував появу ознак дефіциту: об’єми продаж істотно збільшувалися, проте їх впливом не показував результату. Комплексна оцінка кластерного графіка, дельти та Z-Score дозволила об’єктивно визначити точку входу та супроводити рух аж до моменту зниження купівельної ініціативи. Такий підхід до аналізу об’єму та реакції ціни дозволяє вибудовувати угоди зі зрозумілою логікою та контрольованим рівнем ризику.
Стеж за новими статтями у нашому телеграм каналі.
Не треба вигадувати складних схем та шукати “грааль”. Використовуйте інструменти платформи Resonance.
Реєструйся за посиланням - отримуй бонус і починай заробляти:
OKX | BingX | KuCoin.
Промокод TOPBLOG дає тобі 10% знижки на будь-який тарифний план Resonance.
Рекомендовані статті


