DUSK +182% (Resonance Directional Strategy)

Trade analysis based on price response to volume: market sell-off dominance without price reduction, confirmation via delta and limit demand, movement tracking, and profit-taking during the initiative shift.
Table of contents

Coin: DUSK/USDT
Risk: medium
Level of understanding: beginner
Reasons for entry
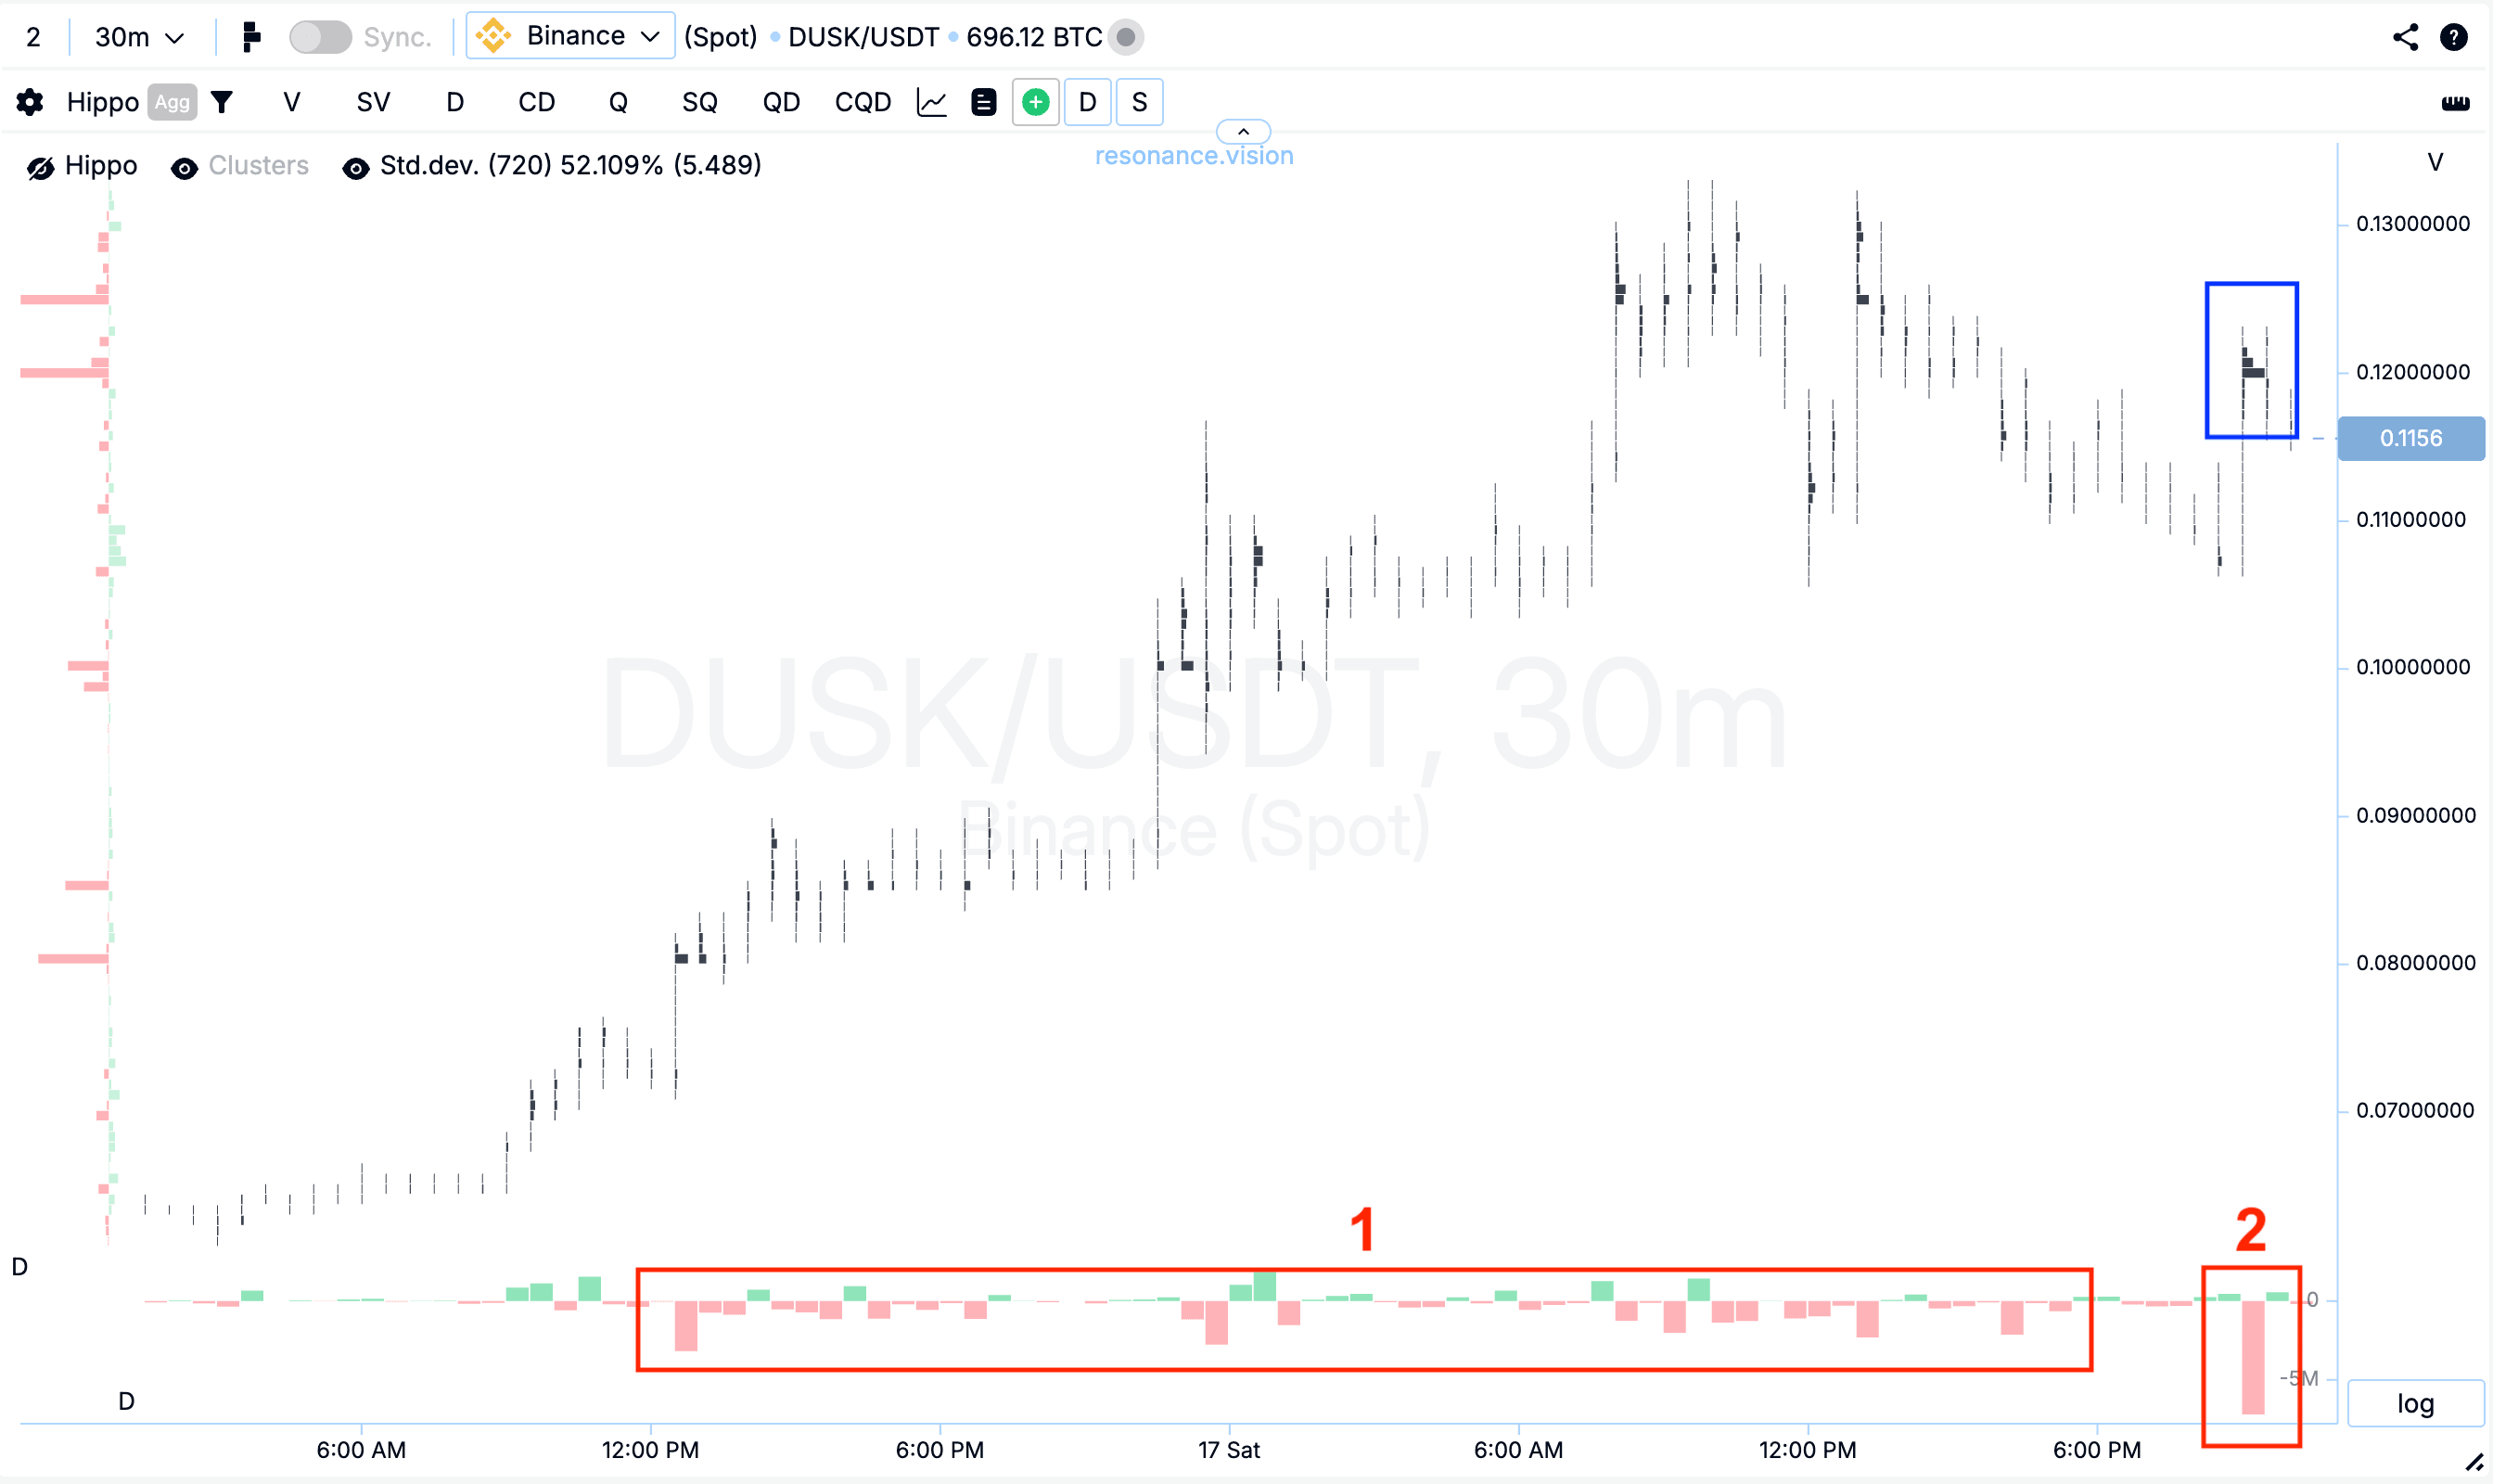
Cluster chart: Throughout the analyzed move, market sell orders continued to dominate (rectangle 1), however, this pressure did not lead to a price decline. Later, repeated significant volumes were recorded (blue rectangle), within which sell volumes also prevailed (red rectangle 2), yet the price once again did not show a decline. Such a reaction indicates the persistence of local deficit signs and a noticeable weakening of sellers’ initiative.
In the Dashboard
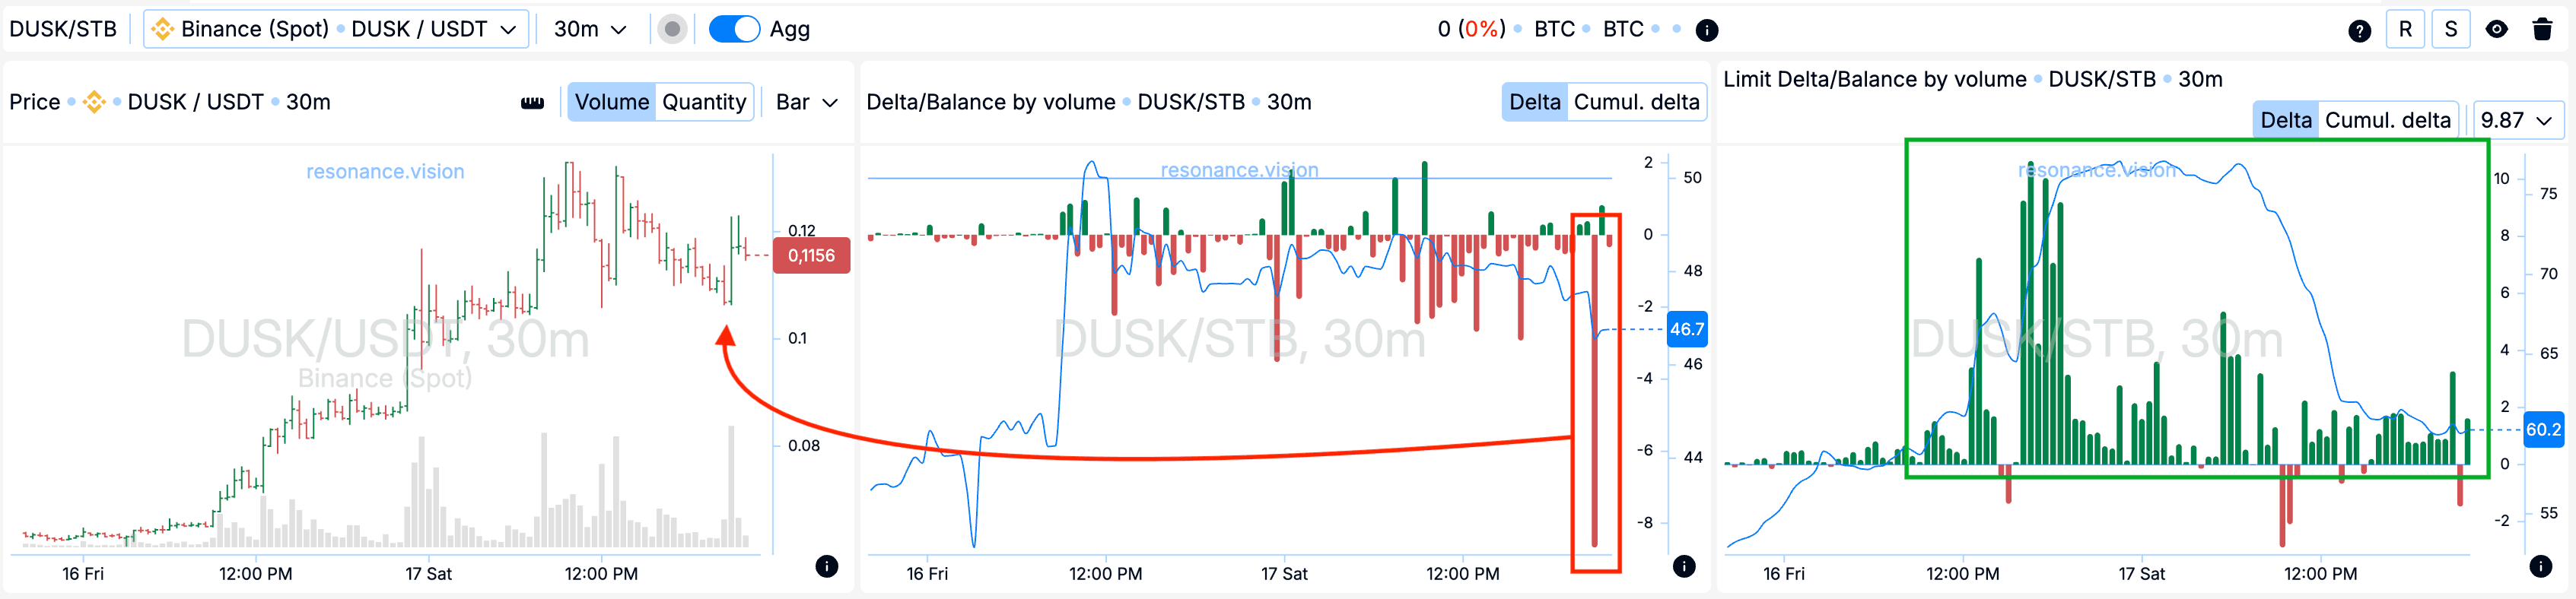
Delta / Volume balance and limit delta: Aggregated data across all pairs and exchanges confirm the picture observed on the cluster chart. During the analyzed period, market sell volumes were significantly higher than in previous segments, which is clearly visible on the delta histogram. At the same time, the price did not show a corresponding reaction and failed to update the local low (red rectangle and arrow).
Additionally, during the same period, limit orders noticeably prevailed on the buy side (green rectangle). This combination indicates the readiness of limit participants to absorb the entire incoming market sell volume, forming local support and confirming the weakening of selling pressure.
Reasons for exit
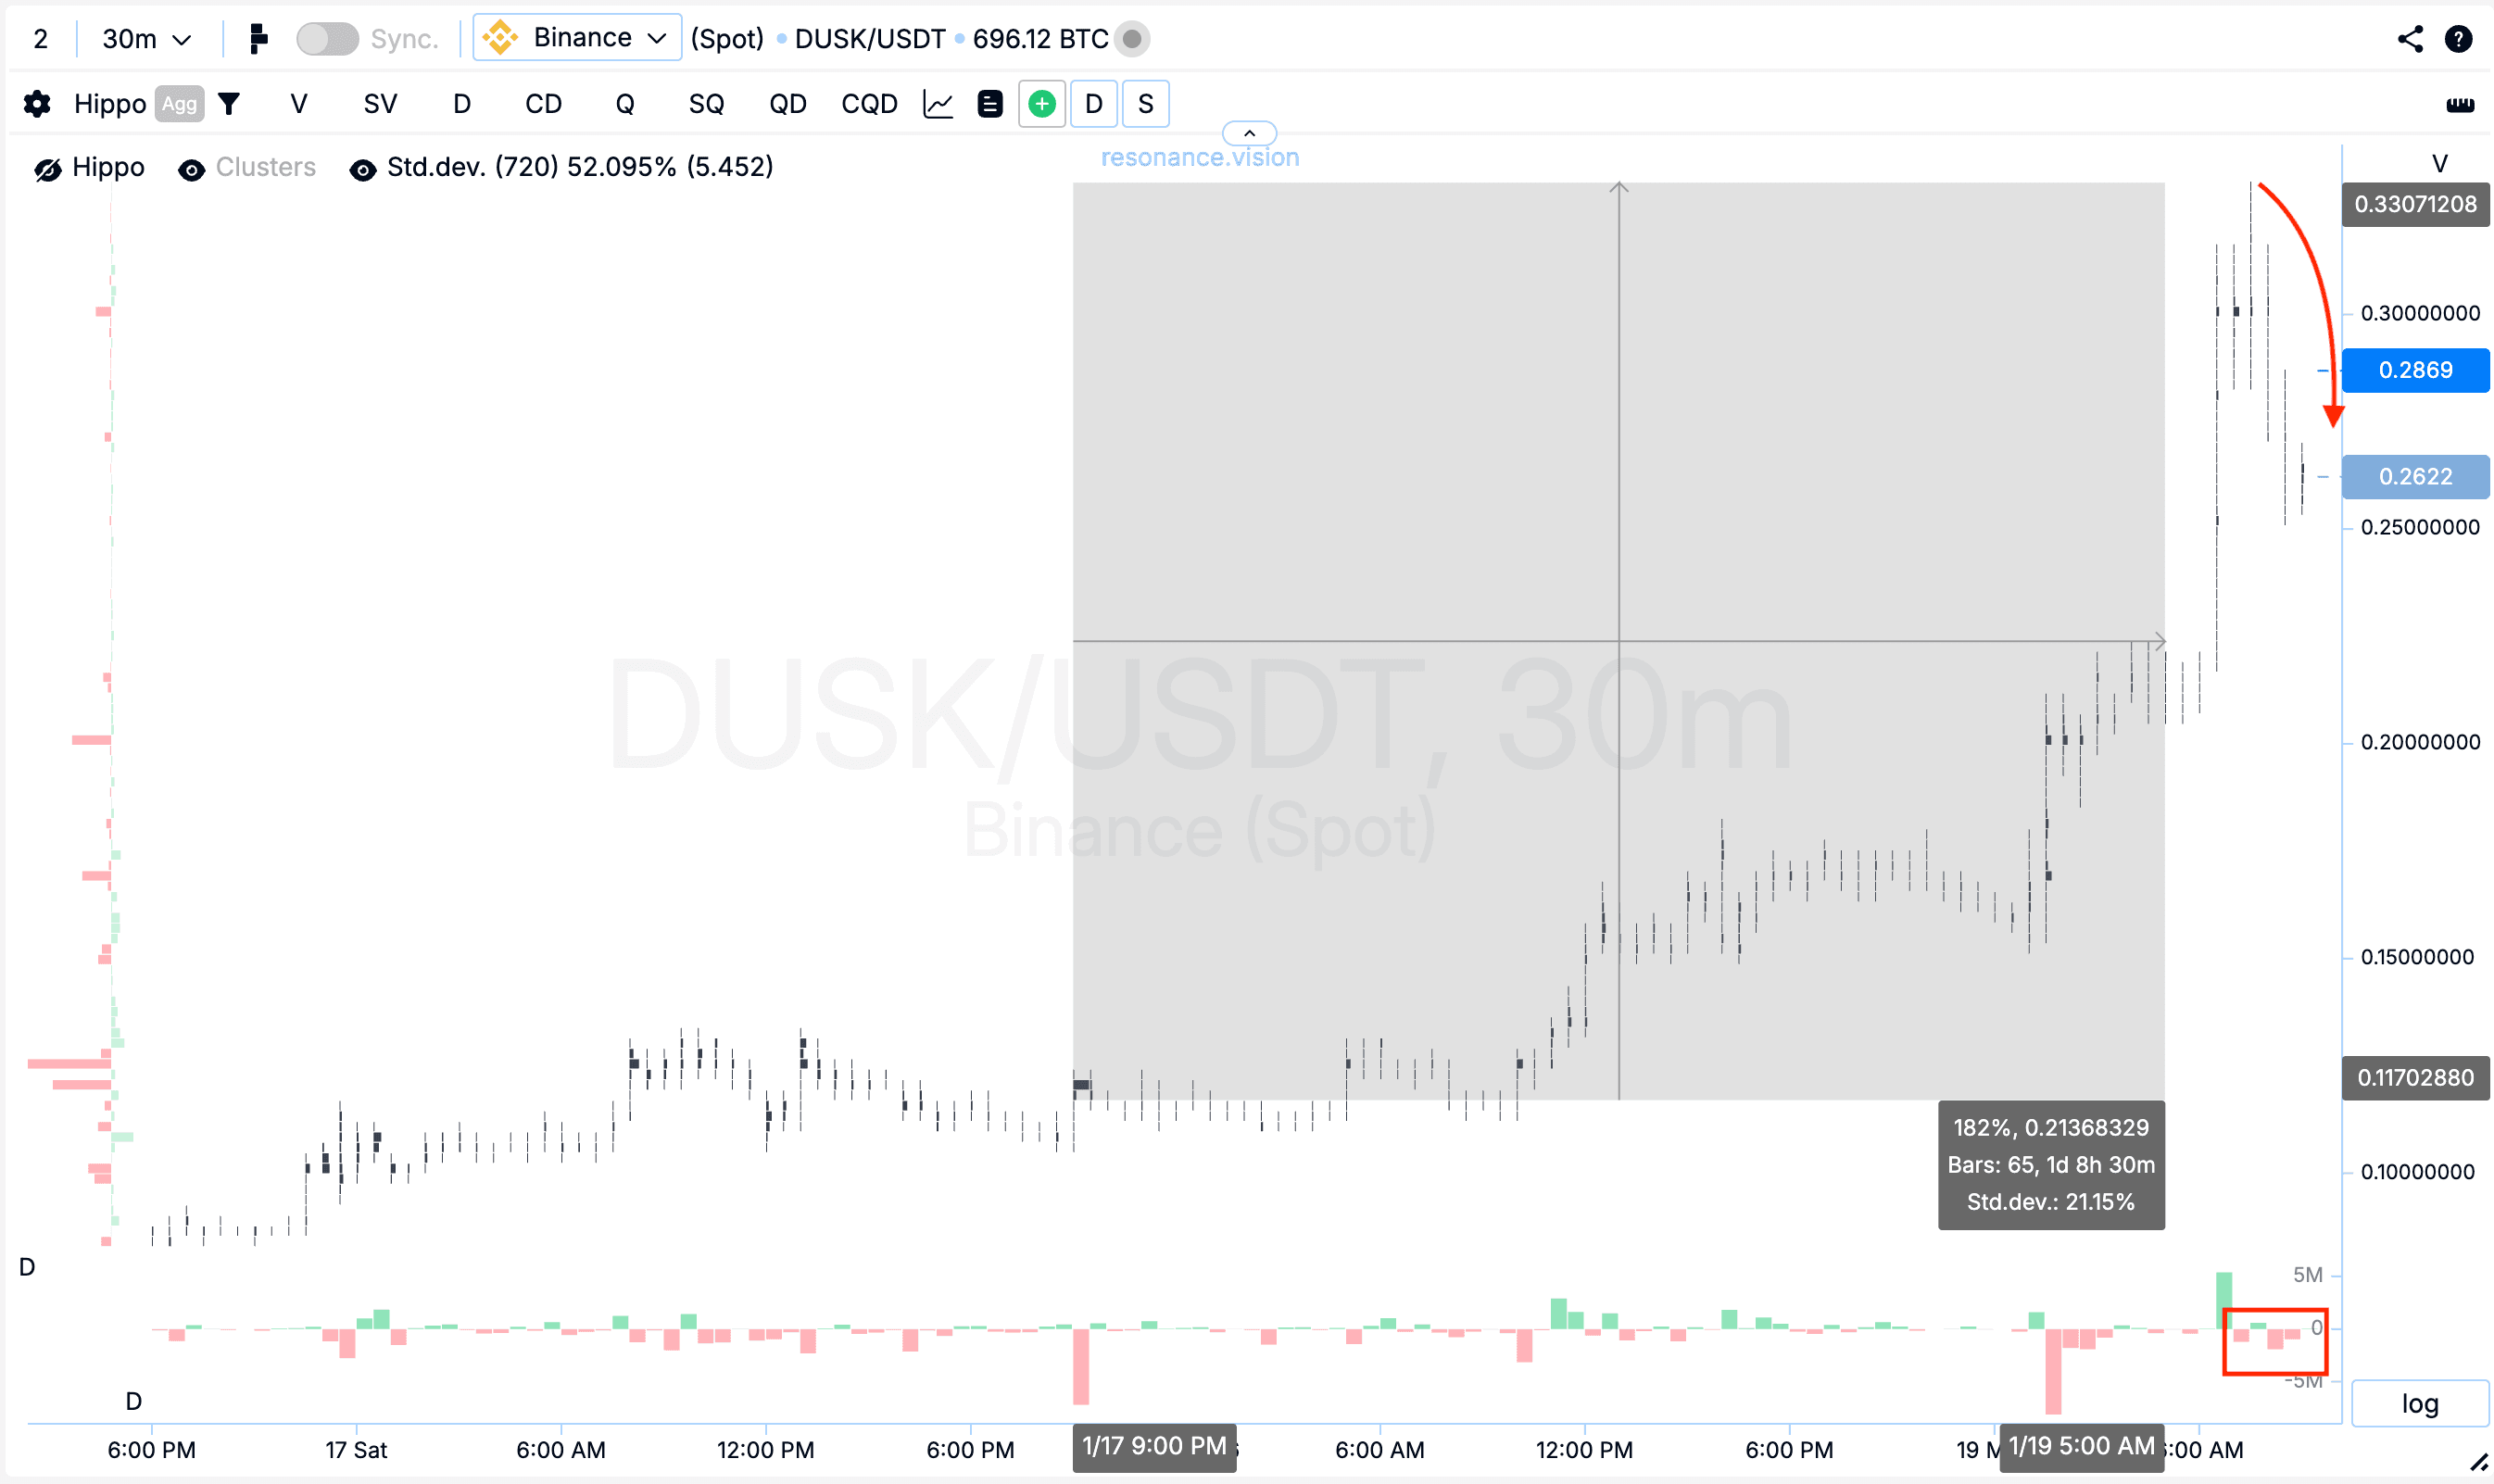
Cluster chart: After the entry point, the price increased by nearly 200%, while volatility noticeably intensified within this range. Against the background of relatively small sell volumes, the market formed a pronounced pullback (red rectangle and arrow), indicating a shift of initiative toward sellers. Such a move falls into the category of significant and anomalous. Under these conditions, further holding of the position would only increase risk, therefore profit taking appeared to be the most logical and balanced decision.
Conclusion
The market clearly demonstrated how, despite the dominance of market sell orders, the price can remain stable and not react with a decline. It was precisely the assessment of the price reaction to volume — rather than the mere fact of large volumes appearing — that made it possible to objectively identify the entry point and manage the move until the stage of initiative shift.
Such impulsive movements occur in the market quite often, however, the key factor here is not the search for “unique” setups, but the ability to read how price reacts to volume pressure. When volume is being spent and the price does not move, this provides clear logic for entry, position management, and exit with controlled risk.
Follow new insights in our telegram channel.
No need to invent complex schemes and look for the "grail". Use the Resonance platform tools.
Register via the link — get a bonus and start earning:
OKX | BingX | KuCoin.
Promo code TOPBLOG gives you a 10% discount on any Resonance tariff plan.
Recommended articles


