EPIC +38.4% (Resonance Directional Strategy)

A deal analysis based on cluster analysis and aggregated volumes. It shows how rising sales volumes stop putting downward pressure on the price, creating a local shortage and entry point. It also shows how a change in volume efficiency and the emergence of counter-selling leads to a balanced decision on profit-taking.
Table of contents

Coin: EPIC/USDT
Risk: high
Level of understanding: beginner
Reasons for entry
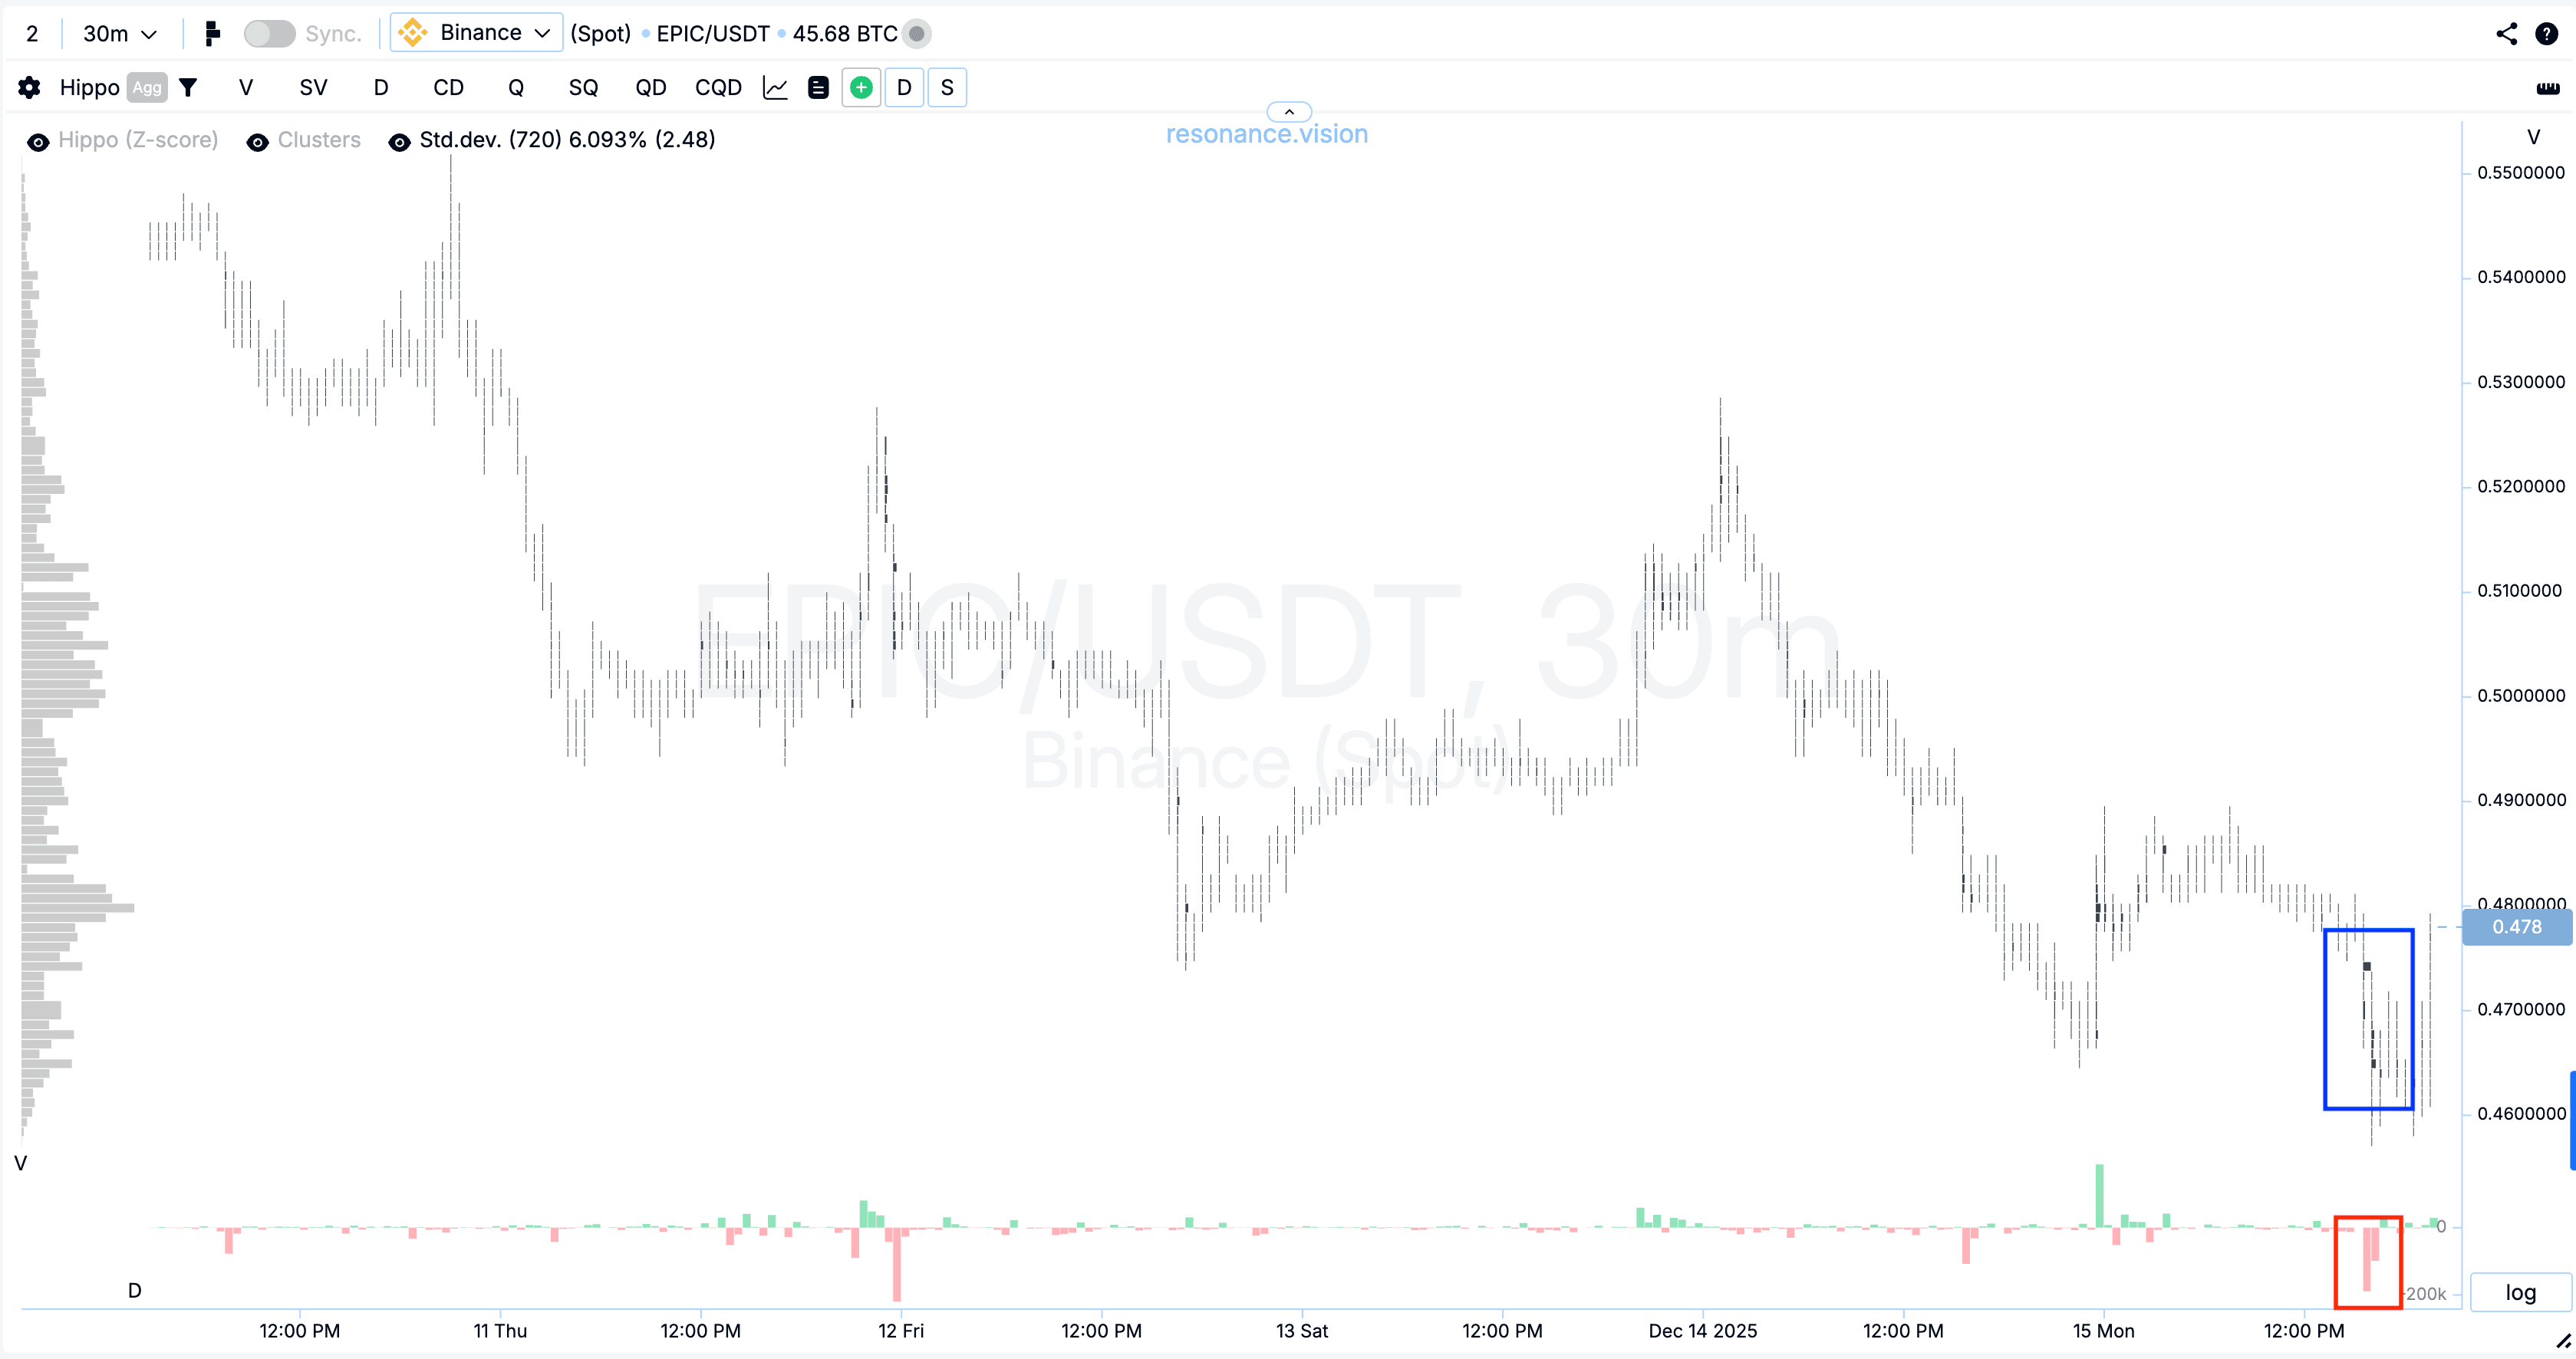
Cluster chart: during the decline, large volume clusters began to form (blue rectangle), within which noticeable market sell orders were executed (red rectangle). However, despite increasing pressure, the price failed to meaningfully update the local low. Such market behavior indicates growing demand and the formation of a local deficit: sellers continue to spend volume, but their impact on price becomes ineffective.
In the Dashboard
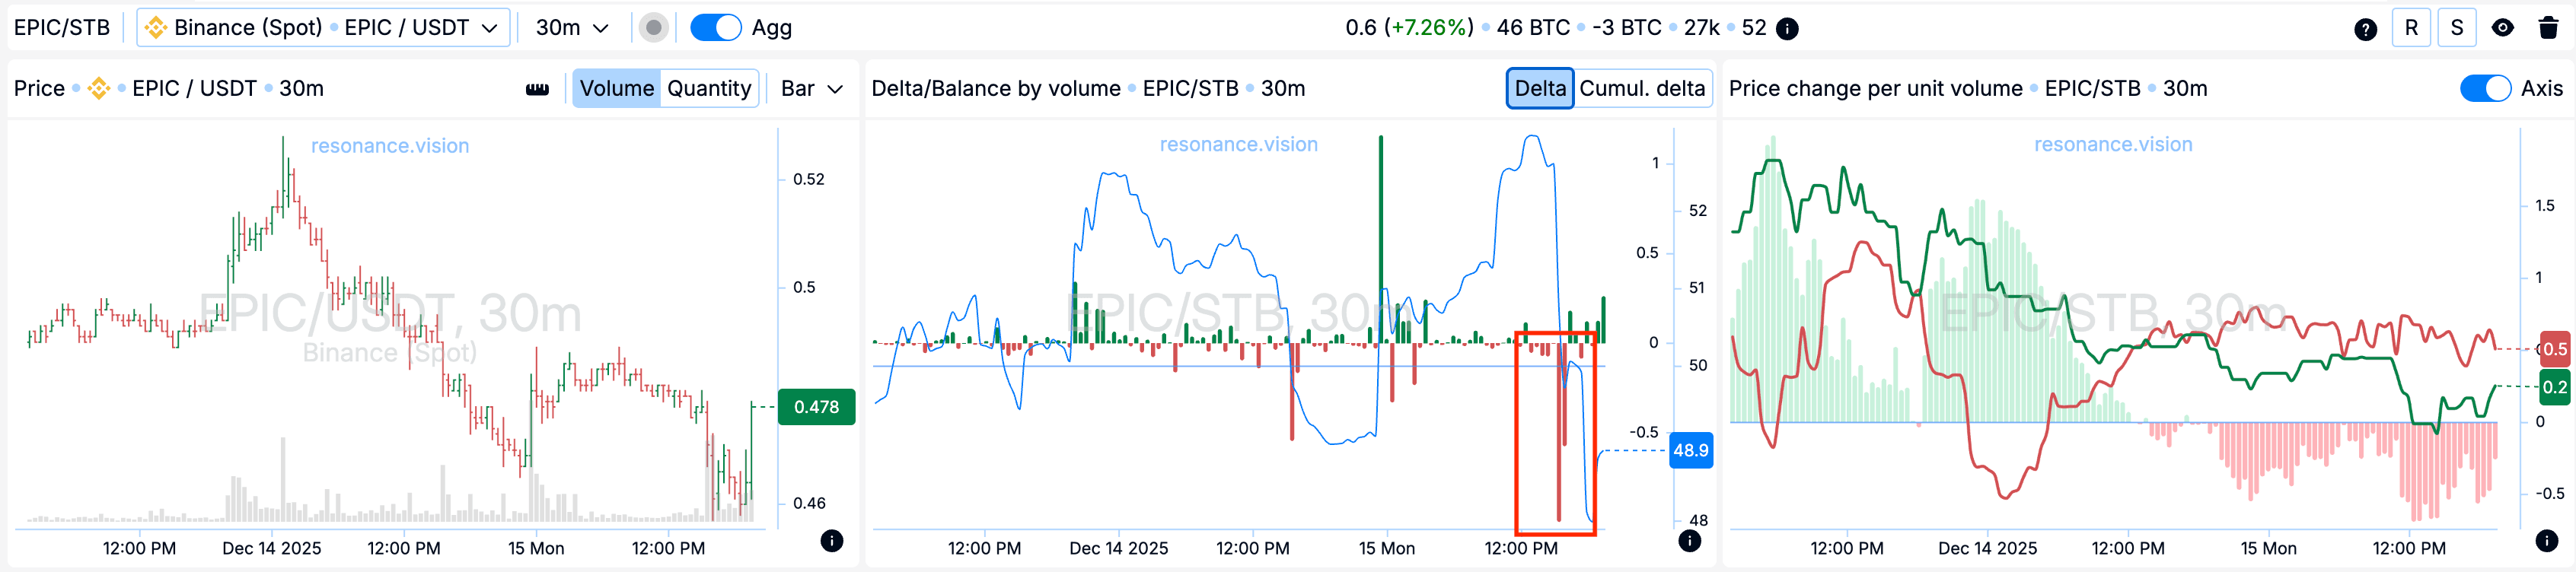
Delta / Volume balance: aggregated data across all pairs and exchanges confirms the picture observed on the cluster chart. During the analyzed period, market sell volumes increased significantly (red rectangle), while the price remained stable and did not show a meaningful decline. This indicates a potential willingness of participants to absorb the entire incoming market sell volume with limit orders, thereby forming local support.
Reasons for exit
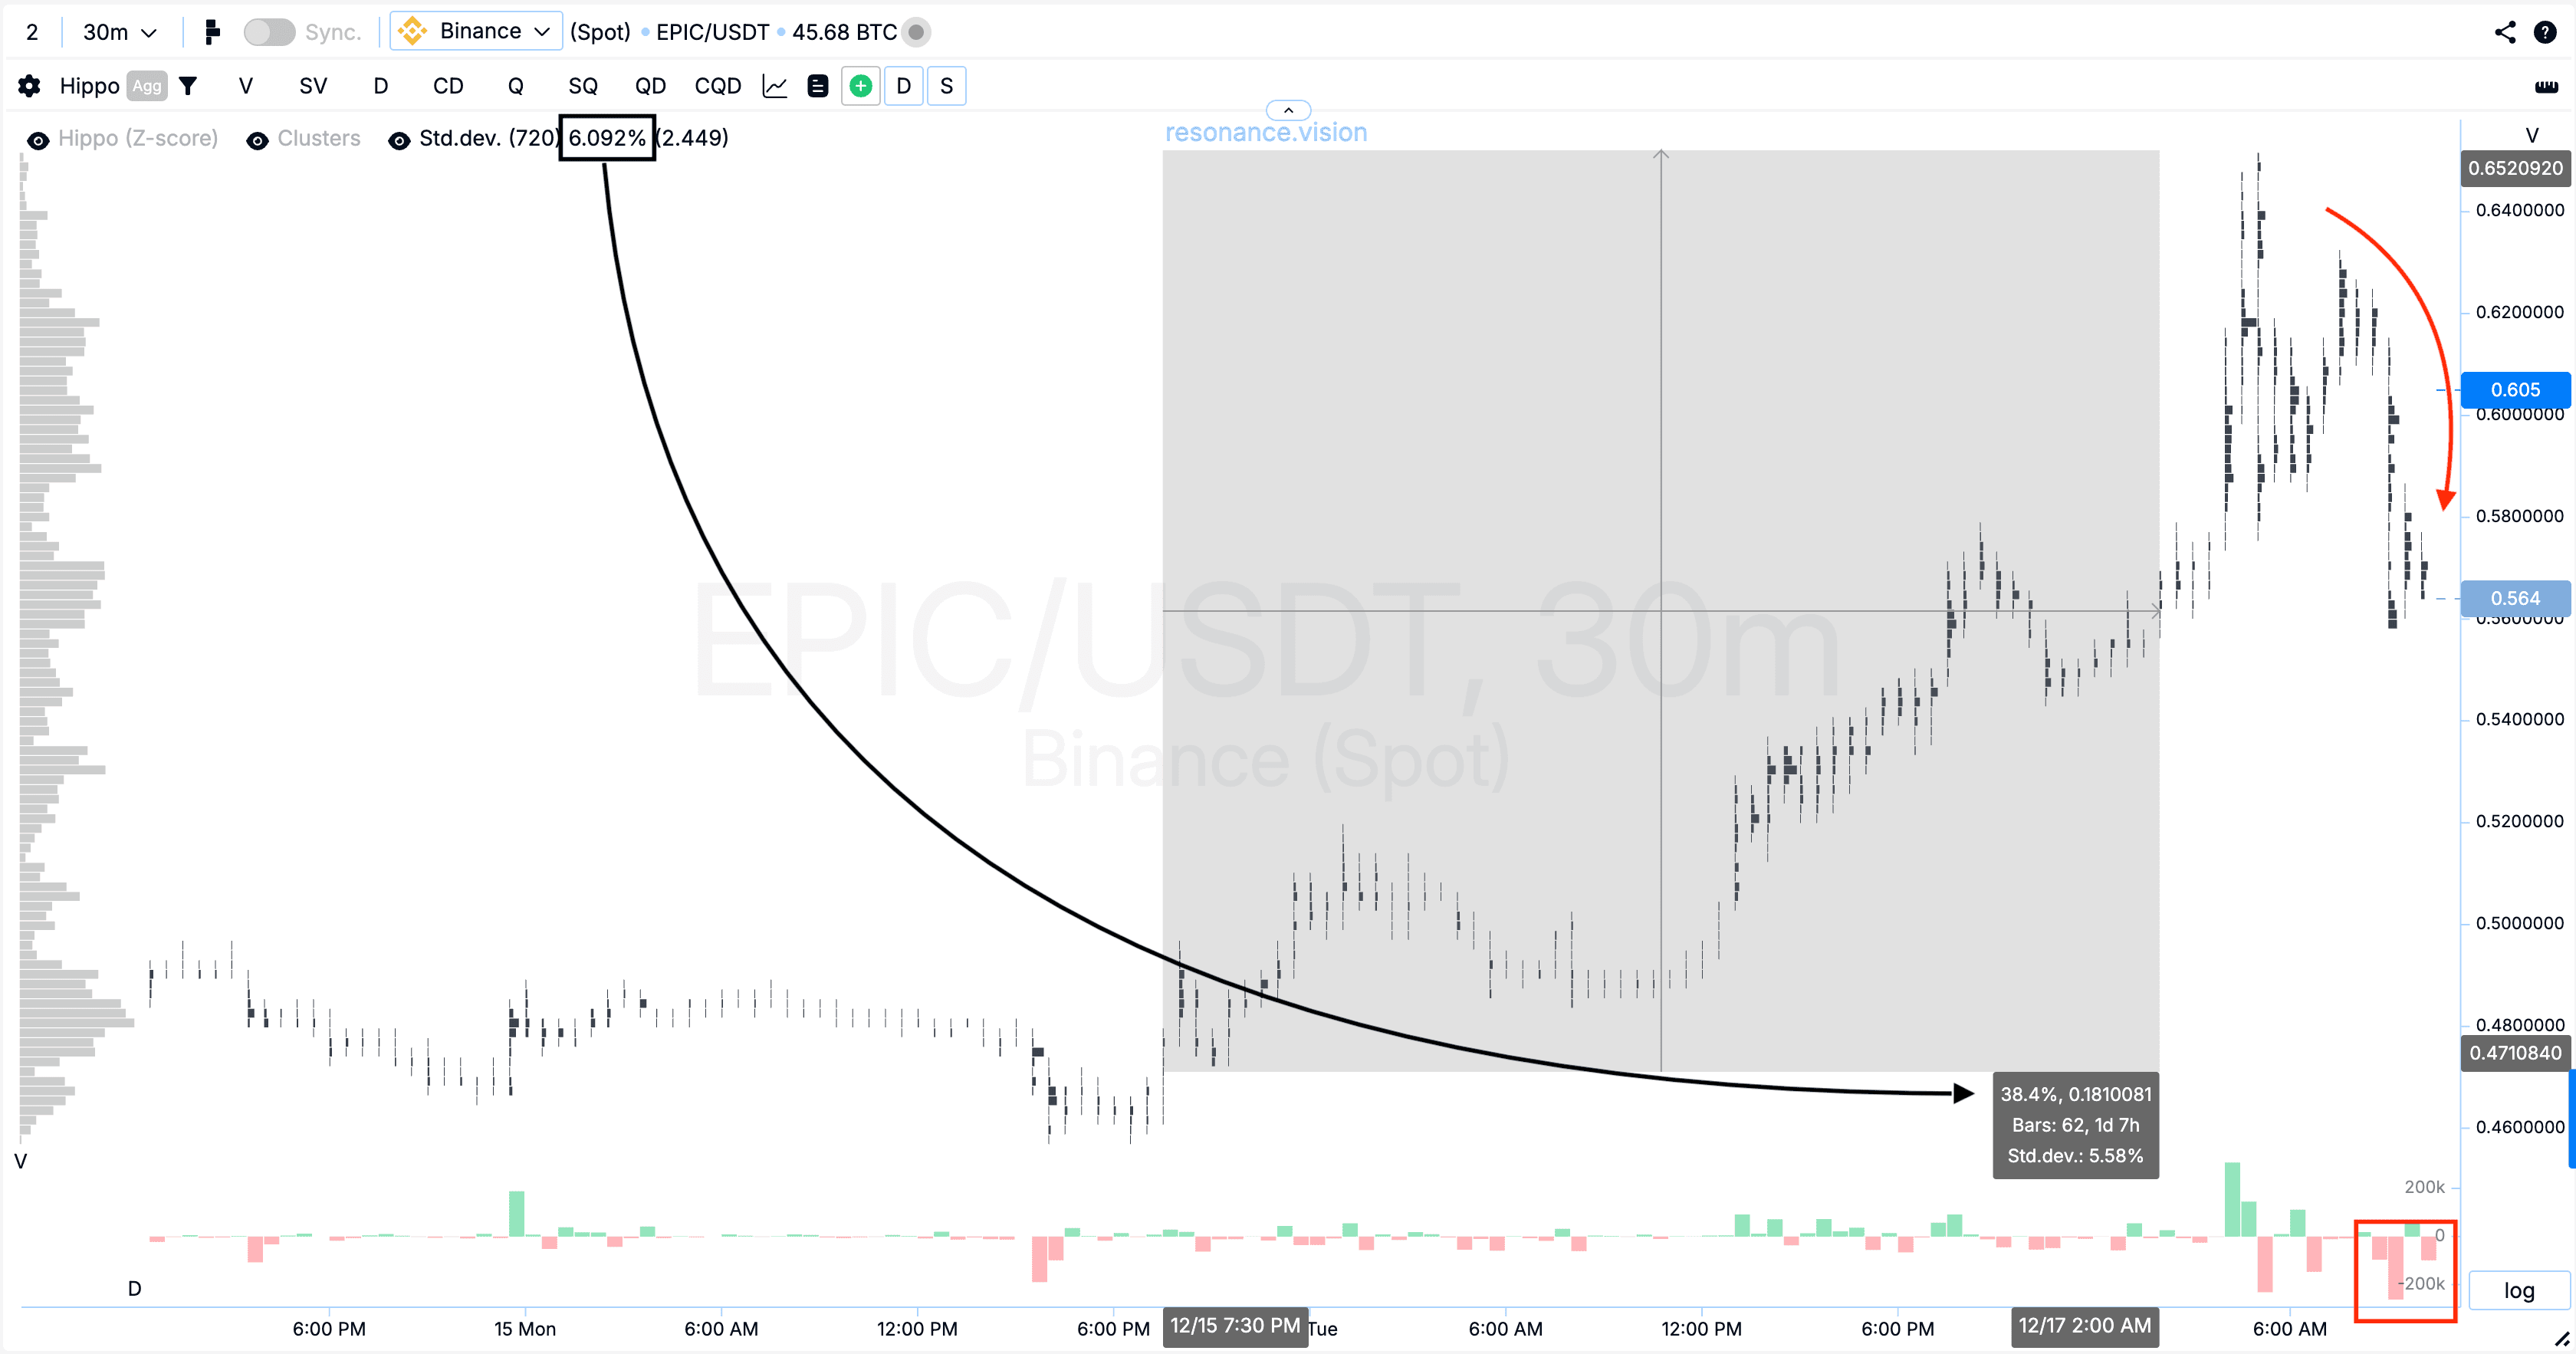
Cluster chart: after the entry point, the price increased by almost 40%, which corresponds to more than six standard movements (black rectangle and arrow). After that, large market sell orders began to appear, resulting in a significant pullback (red rectangle and arrow). This reaction indicates a shift of initiative toward sellers. Under these conditions, closing the position was a rational decision, allowing the already realized impulse to be secured.
Conclusion
This trade clearly demonstrates how the combination of cluster analysis and aggregated volume data helps to read the real behavior of market participants rather than simply reacting to price.
At the entry stage, the market showed signs of a local deficit: despite the growth in market sells, the price stopped updating its lows. This pointed to the presence of limit demand and weakening pressure from sellers — conditions under which initiative gradually begins to shift to buyers.
The subsequent movement confirmed the validity of the scenario: the price delivered a strong move, exceeding several standard deviations. However, as the move developed, the market structure changed — market sells intensified, a pullback appeared, and initiative began shifting back to sellers. In such a phase, continuing to hold the position involved increased risk.
A solid example of how analyzing volume efficiency allows not only timely market entry, but also a well-timed exit, preserving results and maintaining risk control.
Follow new insights in our telegram channel.
No need to invent complex schemes and look for the "grail". Use the Resonance platform tools.
Register via the link — get a bonus and start earning:
OKX | BingX | KuCoin.
Promo code TOPBLOG gives you a 10% discount on any Resonance tariff plan.
Recommended articles


