HAEDAL +31.1% (Directional Strategy Resonance)

🚀 HEADAL/USDT trade — analysis based on signs of local shortage and inefficiency of market sales. Through cluster and delta analysis, it was possible to identify a good entry in time, and then a reasonable exit after a movement of more than 30%. A great example of how even with low risk you can squeeze out the maximum due to precise position management.
Table of contents

Pair: HAEDAL/USDT
Risk: Medium
Skill Level: Beginner
Entry Reasons
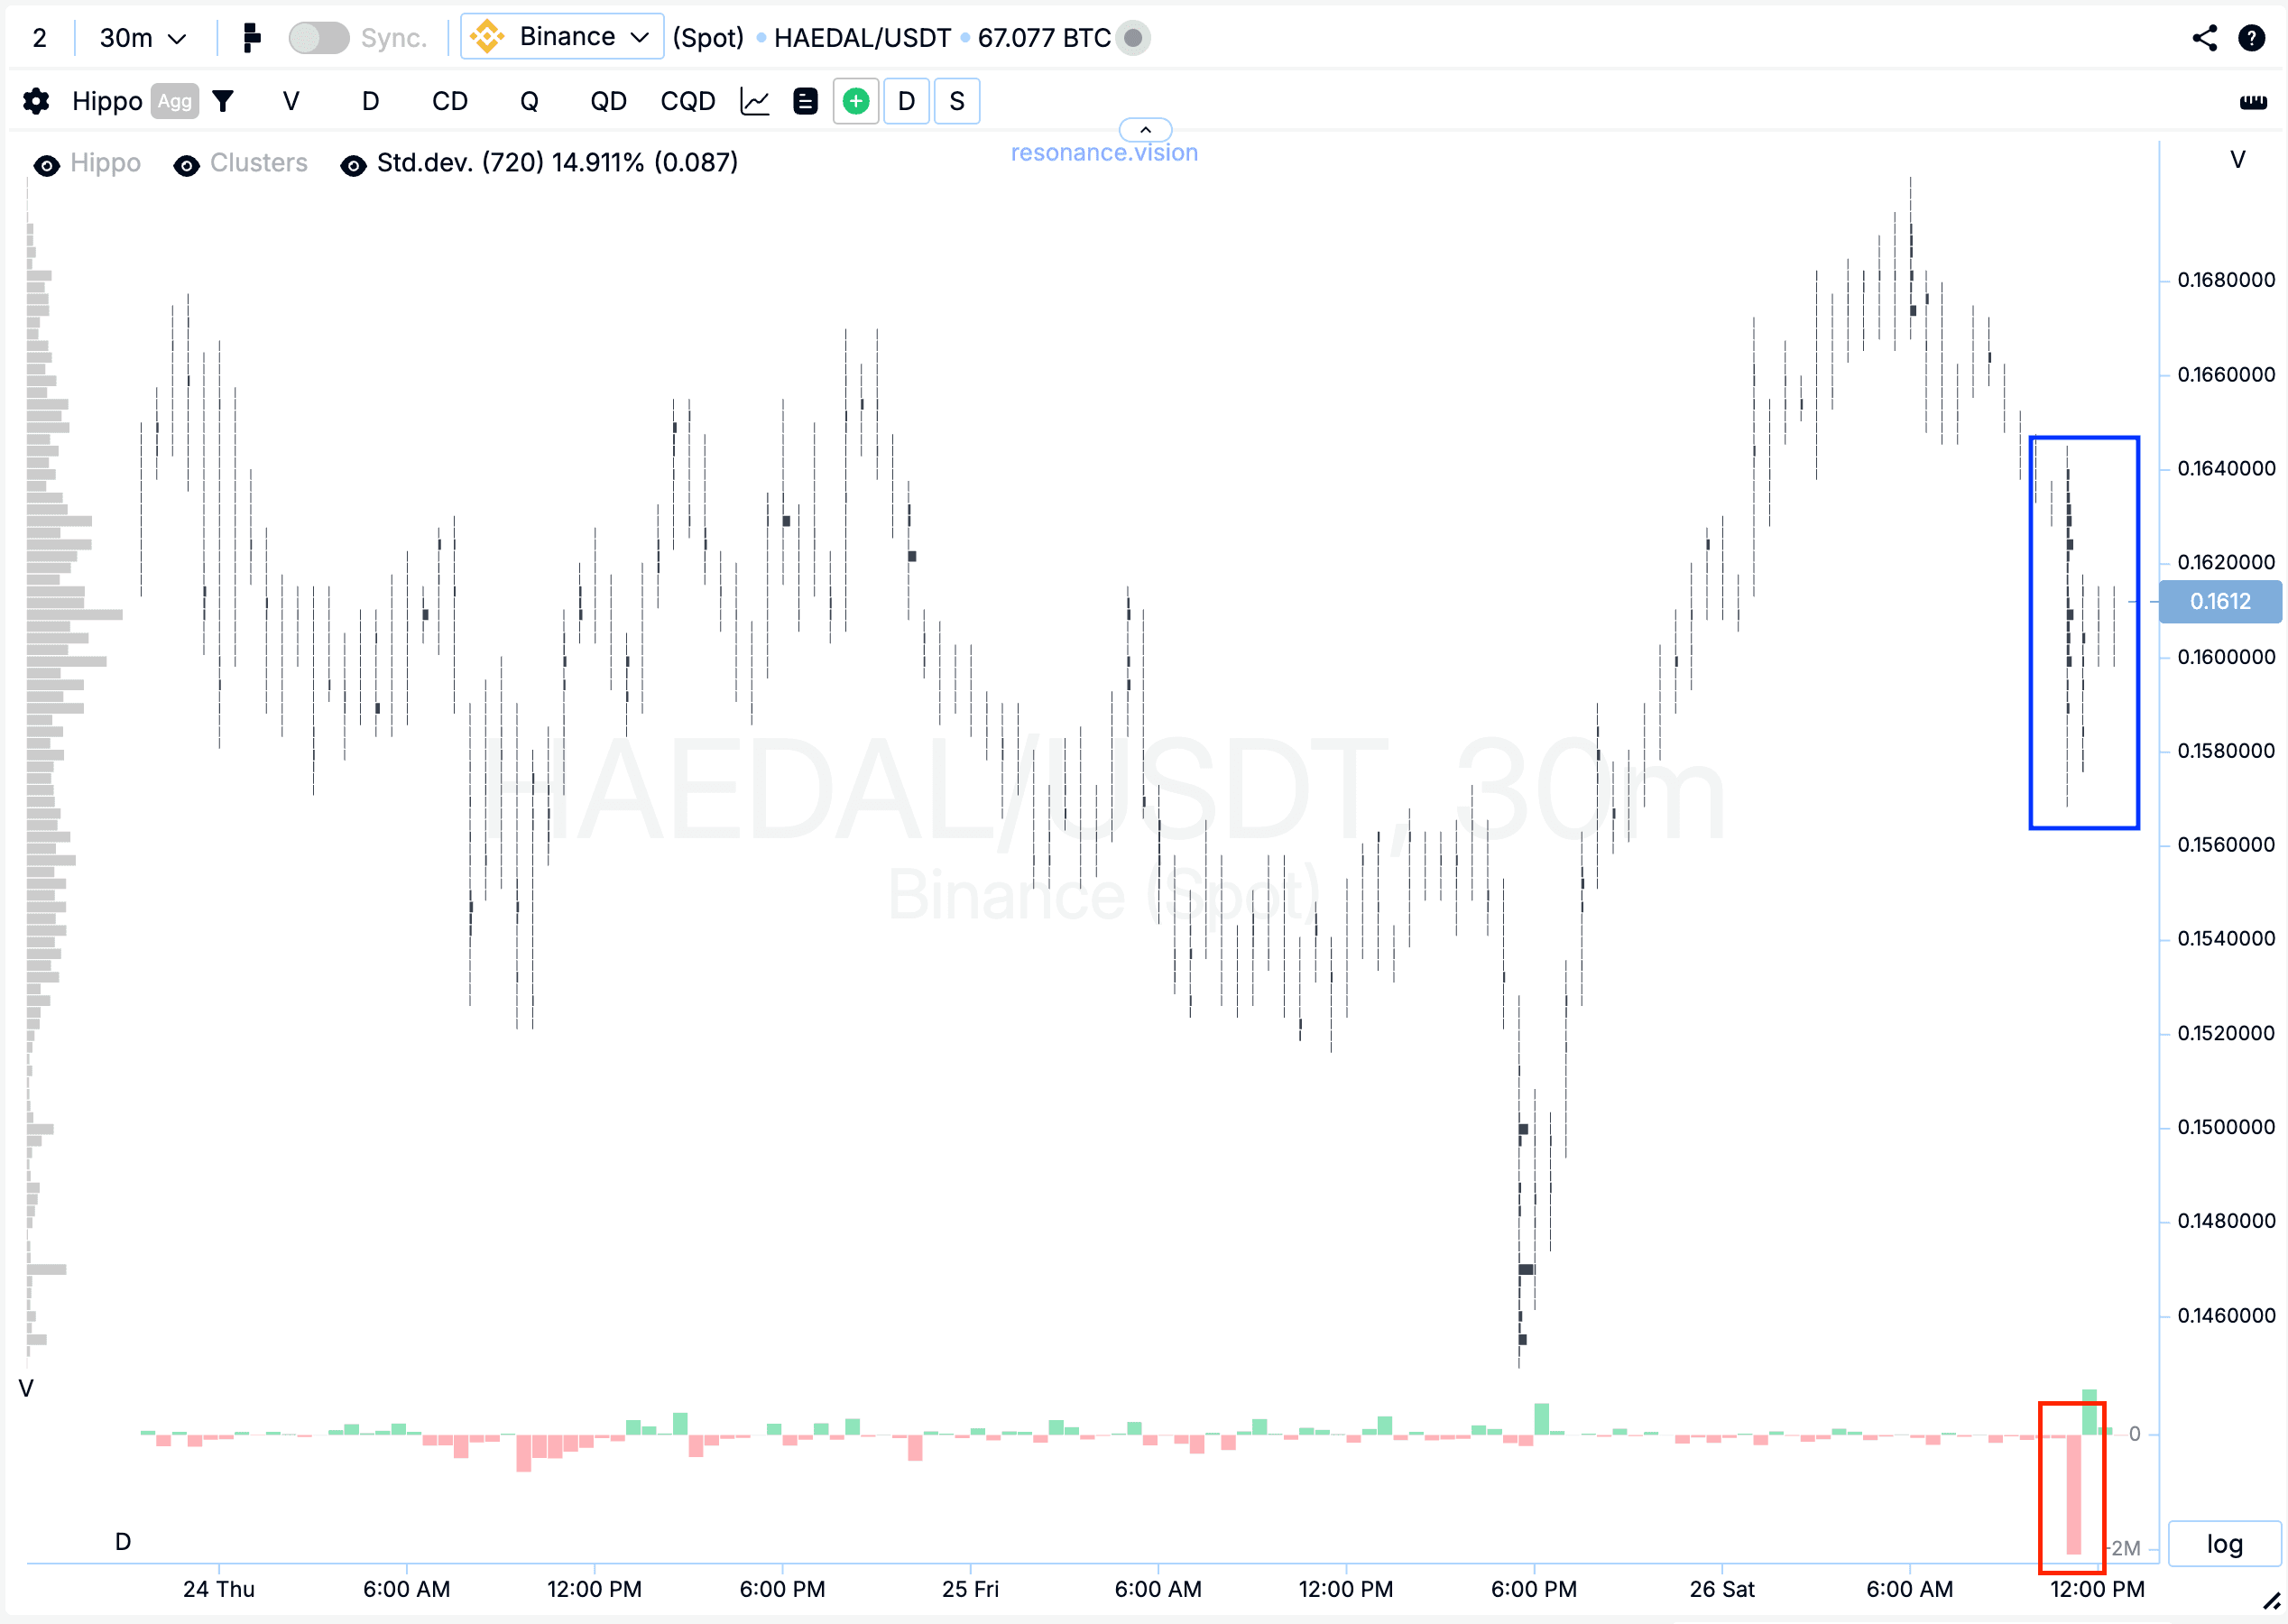
Cluster Chart: In the marked range, volume clusters formed (blue rectangle). These volumes were accompanied by significant market selling (red rectangle), yet the price didn’t drop significantly. This may indicate signs of a local supply shortage — buyers are effectively absorbing the selling pressure.
On the Dashboard
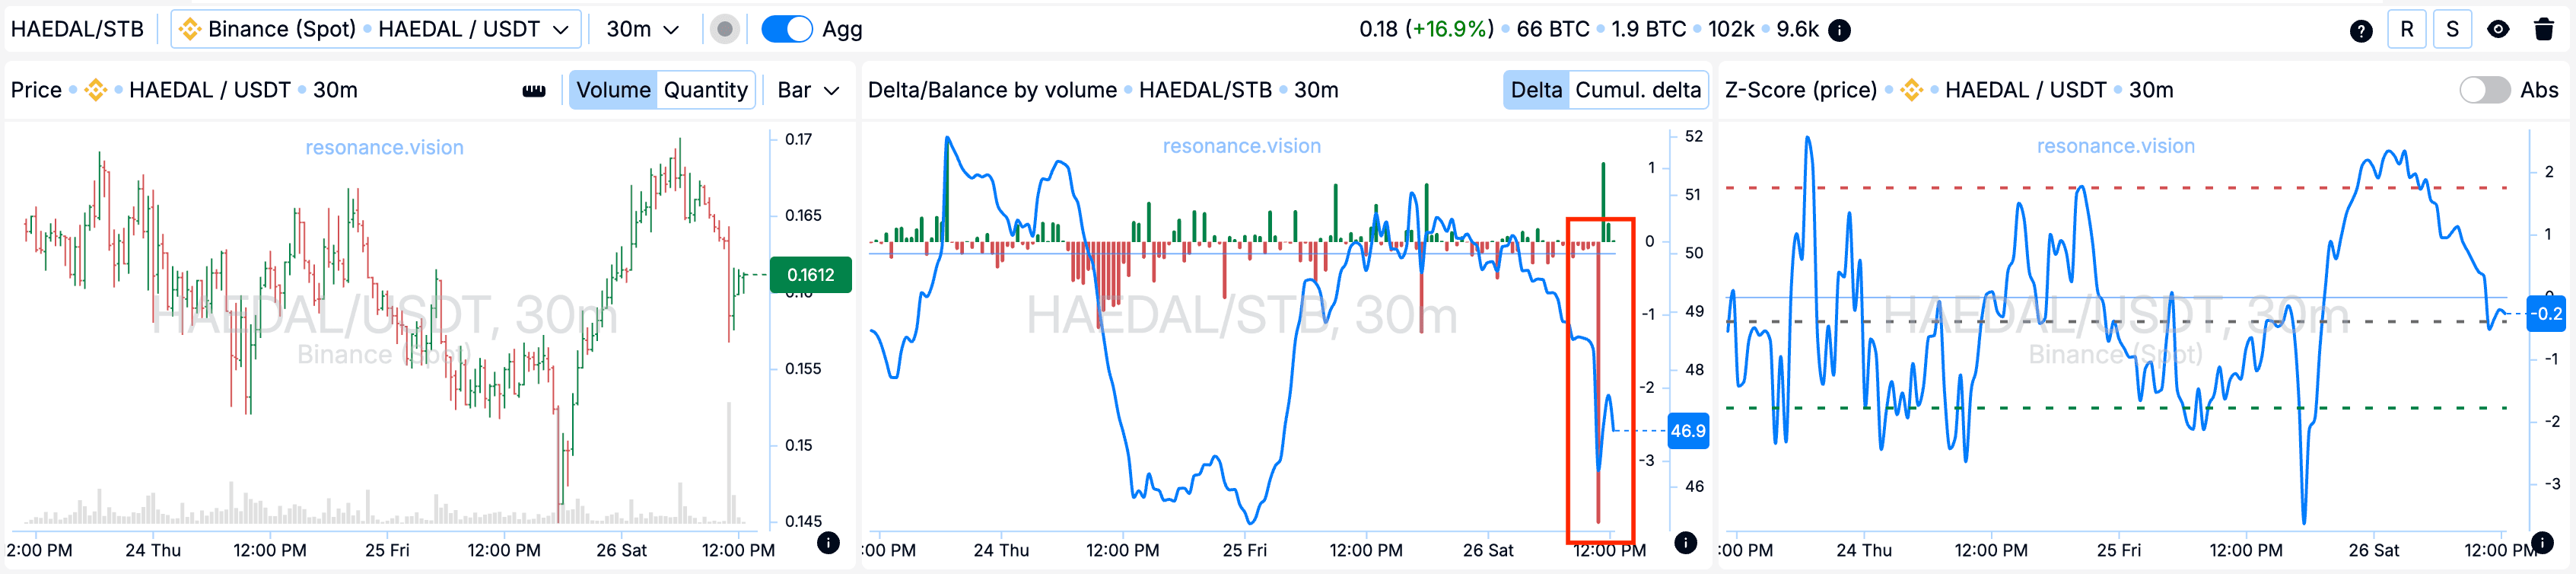
Delta/Volume Balance: Aggregated data also shows that market selling dominates across all pairs and exchanges for this ticker (red rectangle). However, despite the dominance of selling, the price isn’t showing the expected decline. This further confirms the hypothesis of a local supply shortage and supports the argument for continued upward movement.
Exit Reasons
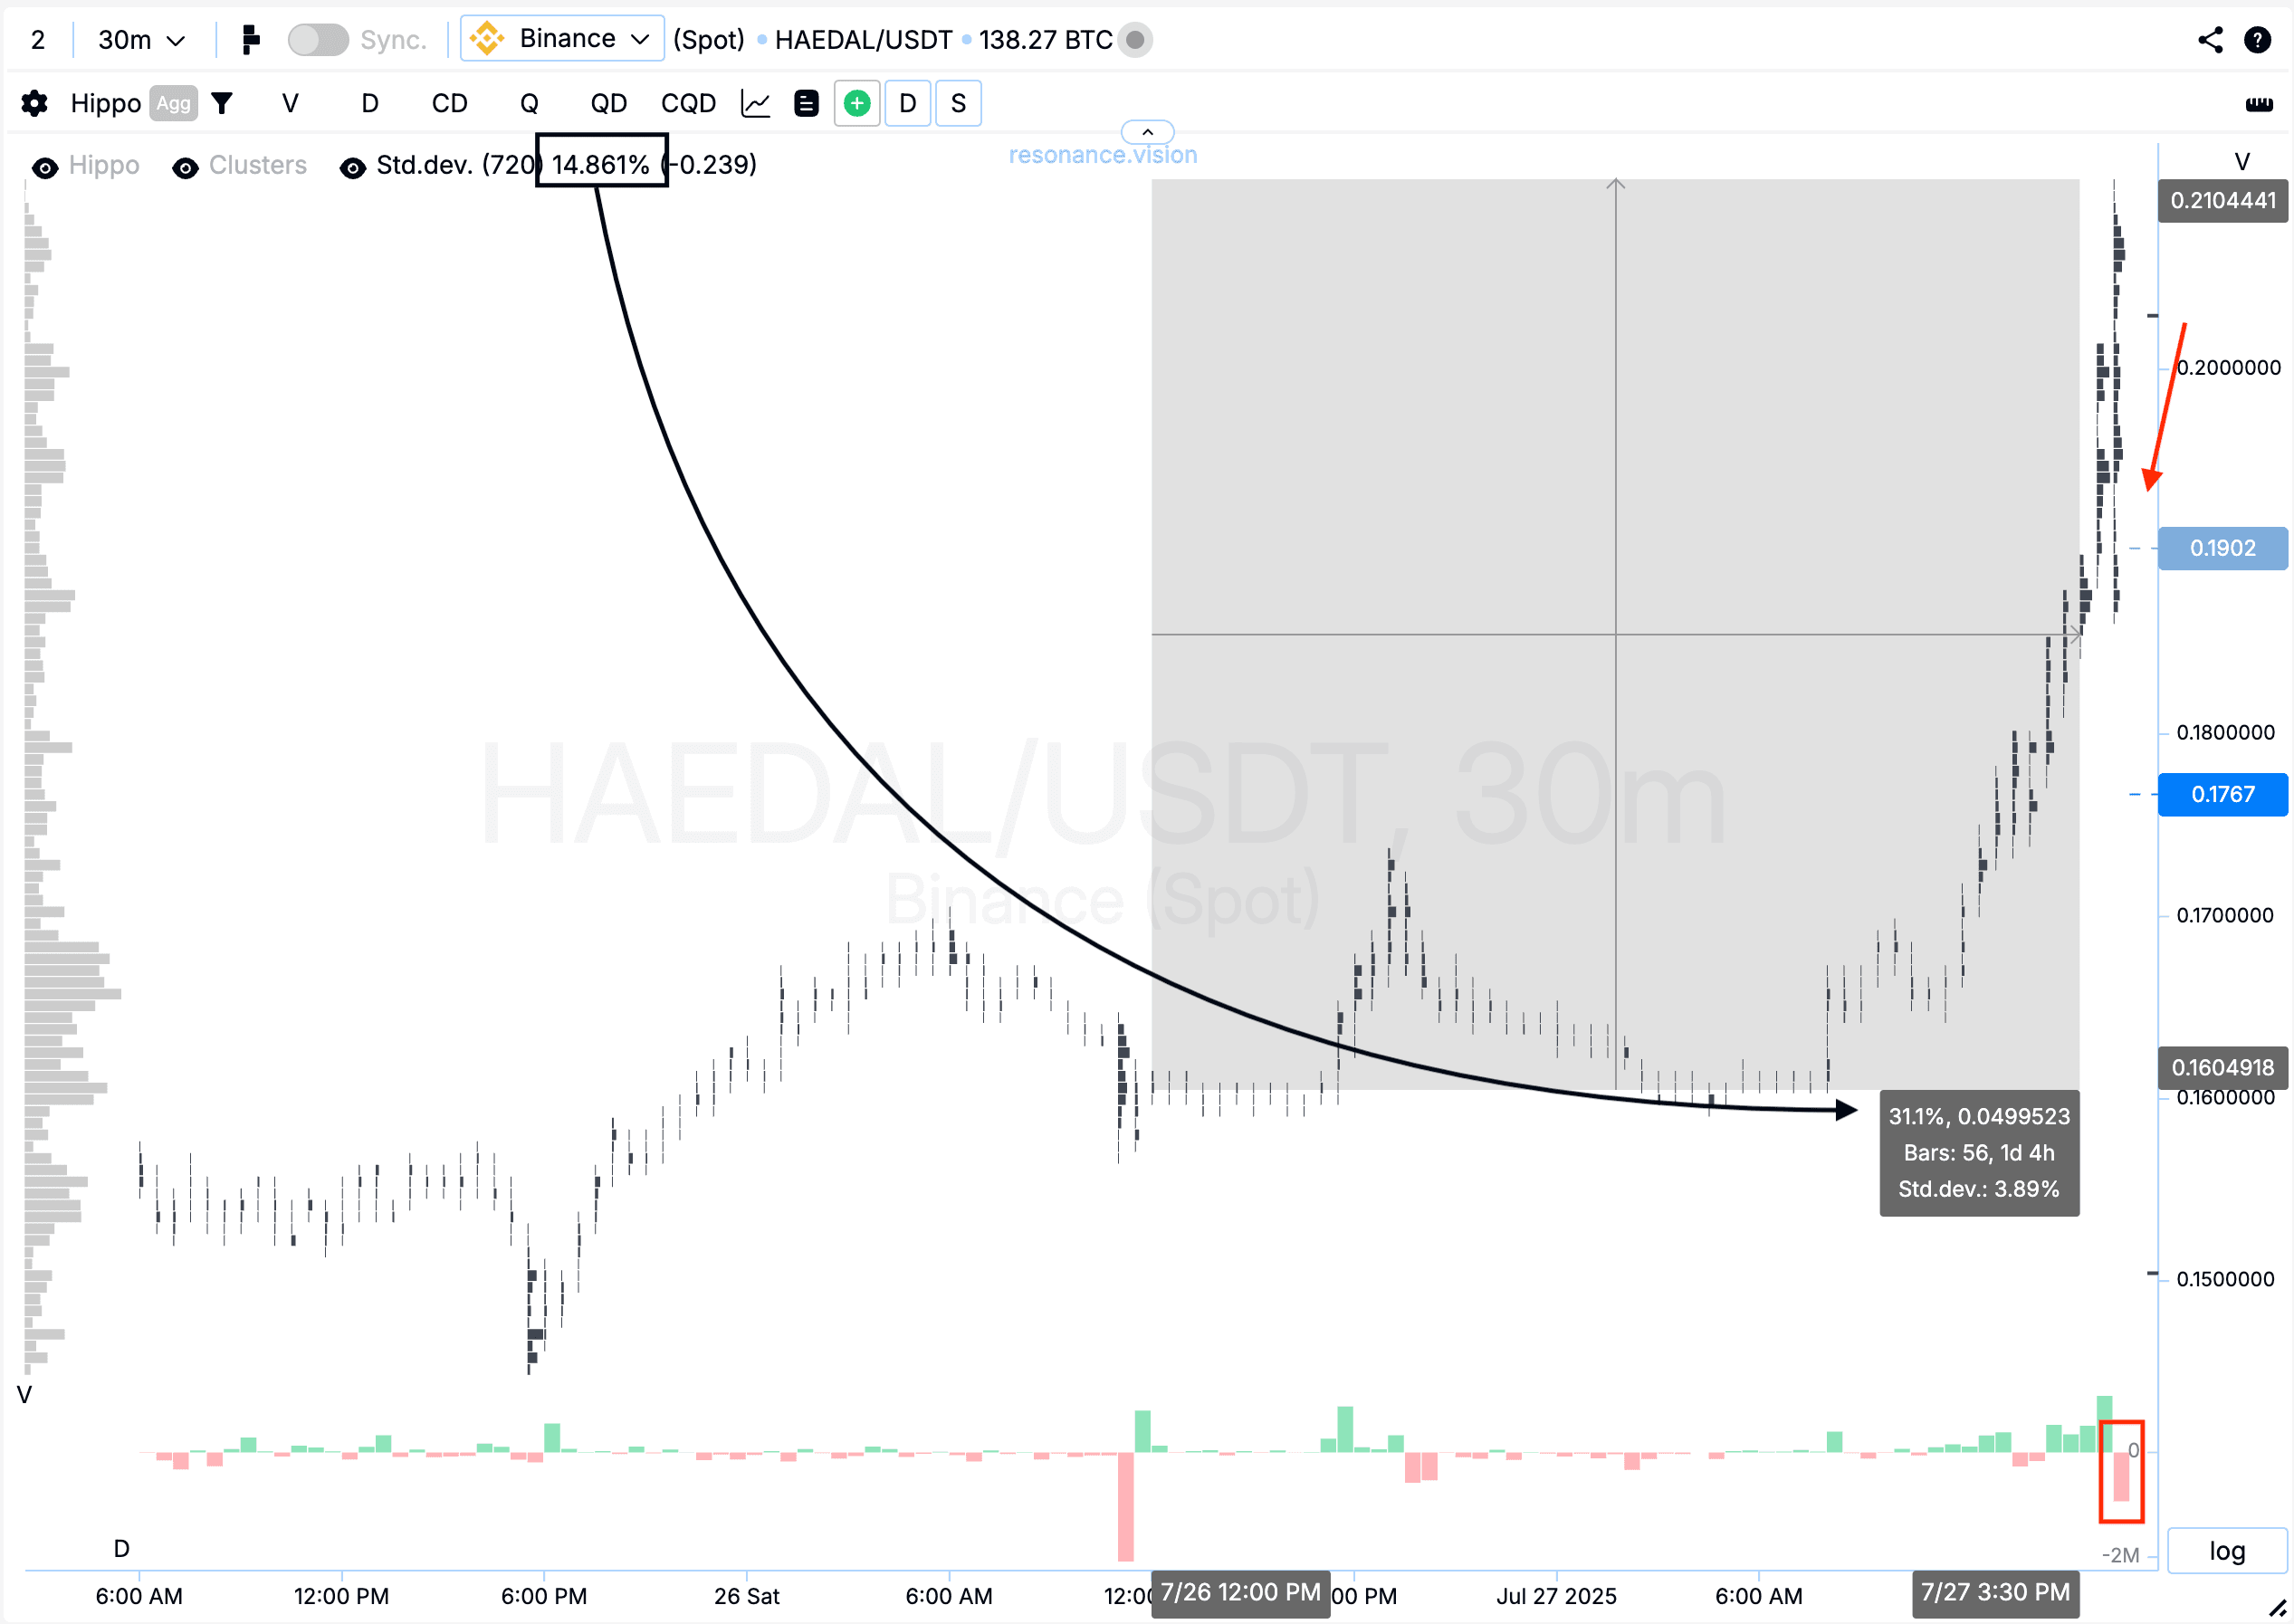
Cluster Chart: From the point where supply shortage signs were detected, the price moved up by another 31%, equivalent to two additional standard movements (black rectangle and arrow). Volatility increased noticeably, and after the impulsive upward move with extreme buying, a sharp pullback followed (red rectangle and arrow). In such conditions, continuing to hold the position could increase risk.
On the Dashboard
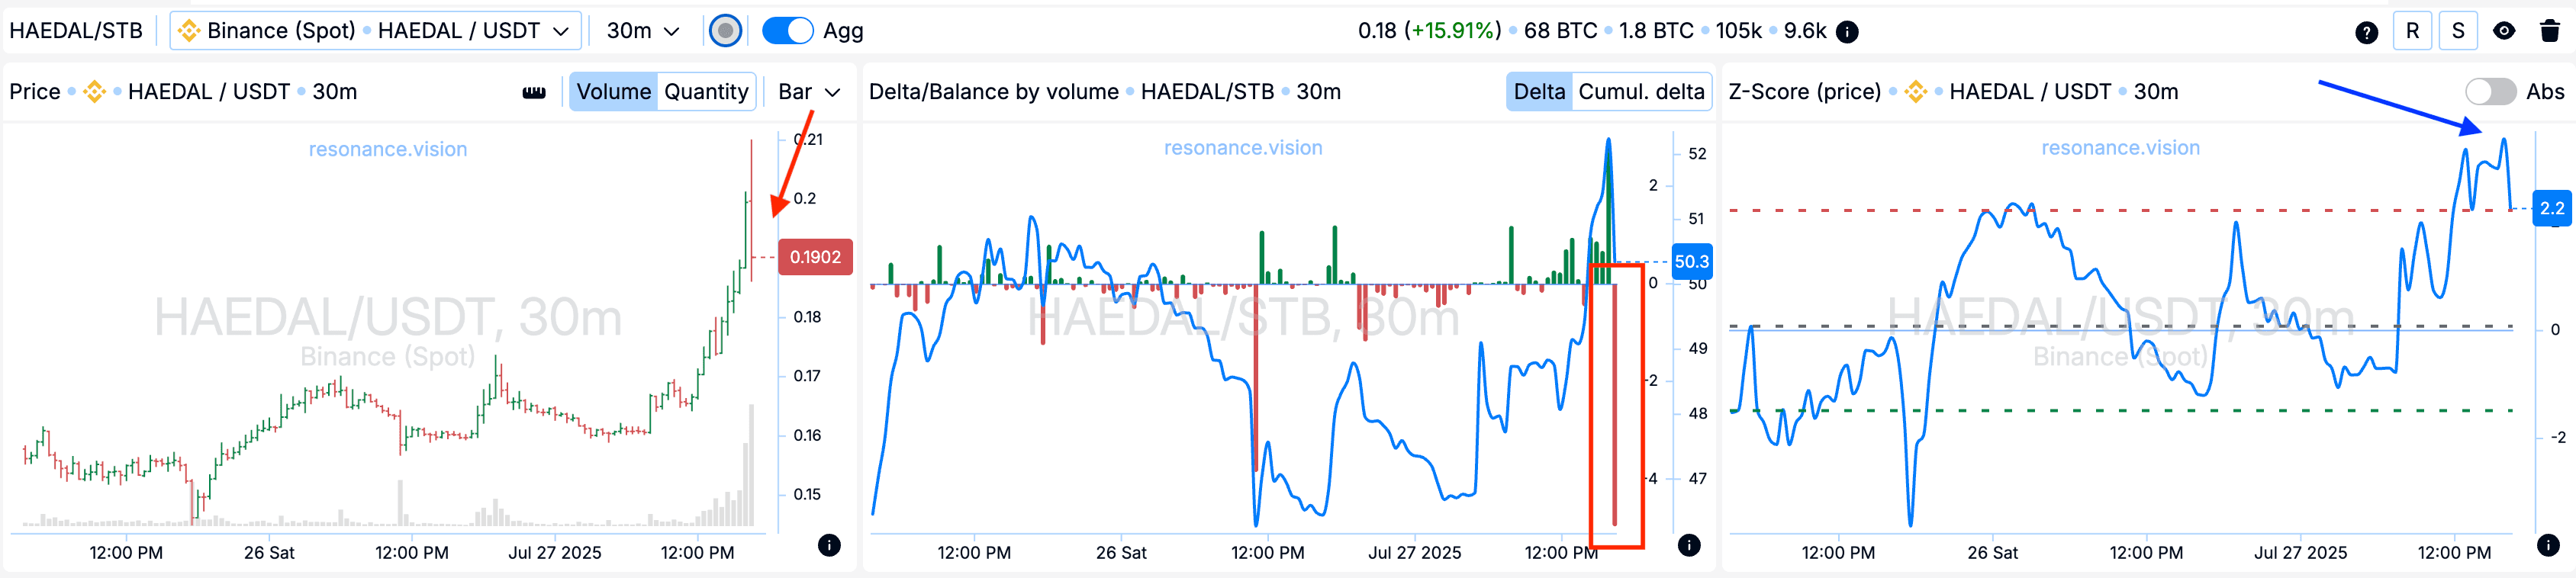
Delta/Volume Balance: According to the aggregated data, large market sell-offs occurred, suggesting profit-taking by participants who had entered earlier. This is another signal of a potential end to the current move.
Z-Score (Price): The price also deviated upwards by more than 2 standard deviations (blue arrow), which is statistically abnormal. After such movements, price often tends to correct or reverse.
Conclusion
Despite the dominance of market selling, the price didn’t fall — this was the first signal of seller inefficiency and a possible reversal.
The subsequent movement confirmed the hypothesis: price rose by over 30% from the entry point, more than twice the standard statistical deviation.
This example clearly shows how important it is not only to identify the right entry point but also to lock in gains in time — especially when the market situation starts to shift.
Follow new insights in our telegram channel.
No need to invent complex schemes and look for the "grail". Use the Resonance platform tools.
Register via the link — get a bonus and start earning:
OKX | BingX | KuCoin.
Promo code TOPBLOG gives you a 10% discount on any Resonance tariff plan.
Recommended articles


