ICP +19.3% (Направленная стратегия Resonance)

Разбор сделки через кластерный анализ, тепловую карту и агрегированные объёмы. Пример входа на признаках локального дефицита и выхода при росте эффективности продавцов с контролируемым риском.
Содержание

Монета: ICP/USDT
Риск: средний
Уровень понимания: новичок
Причины входа
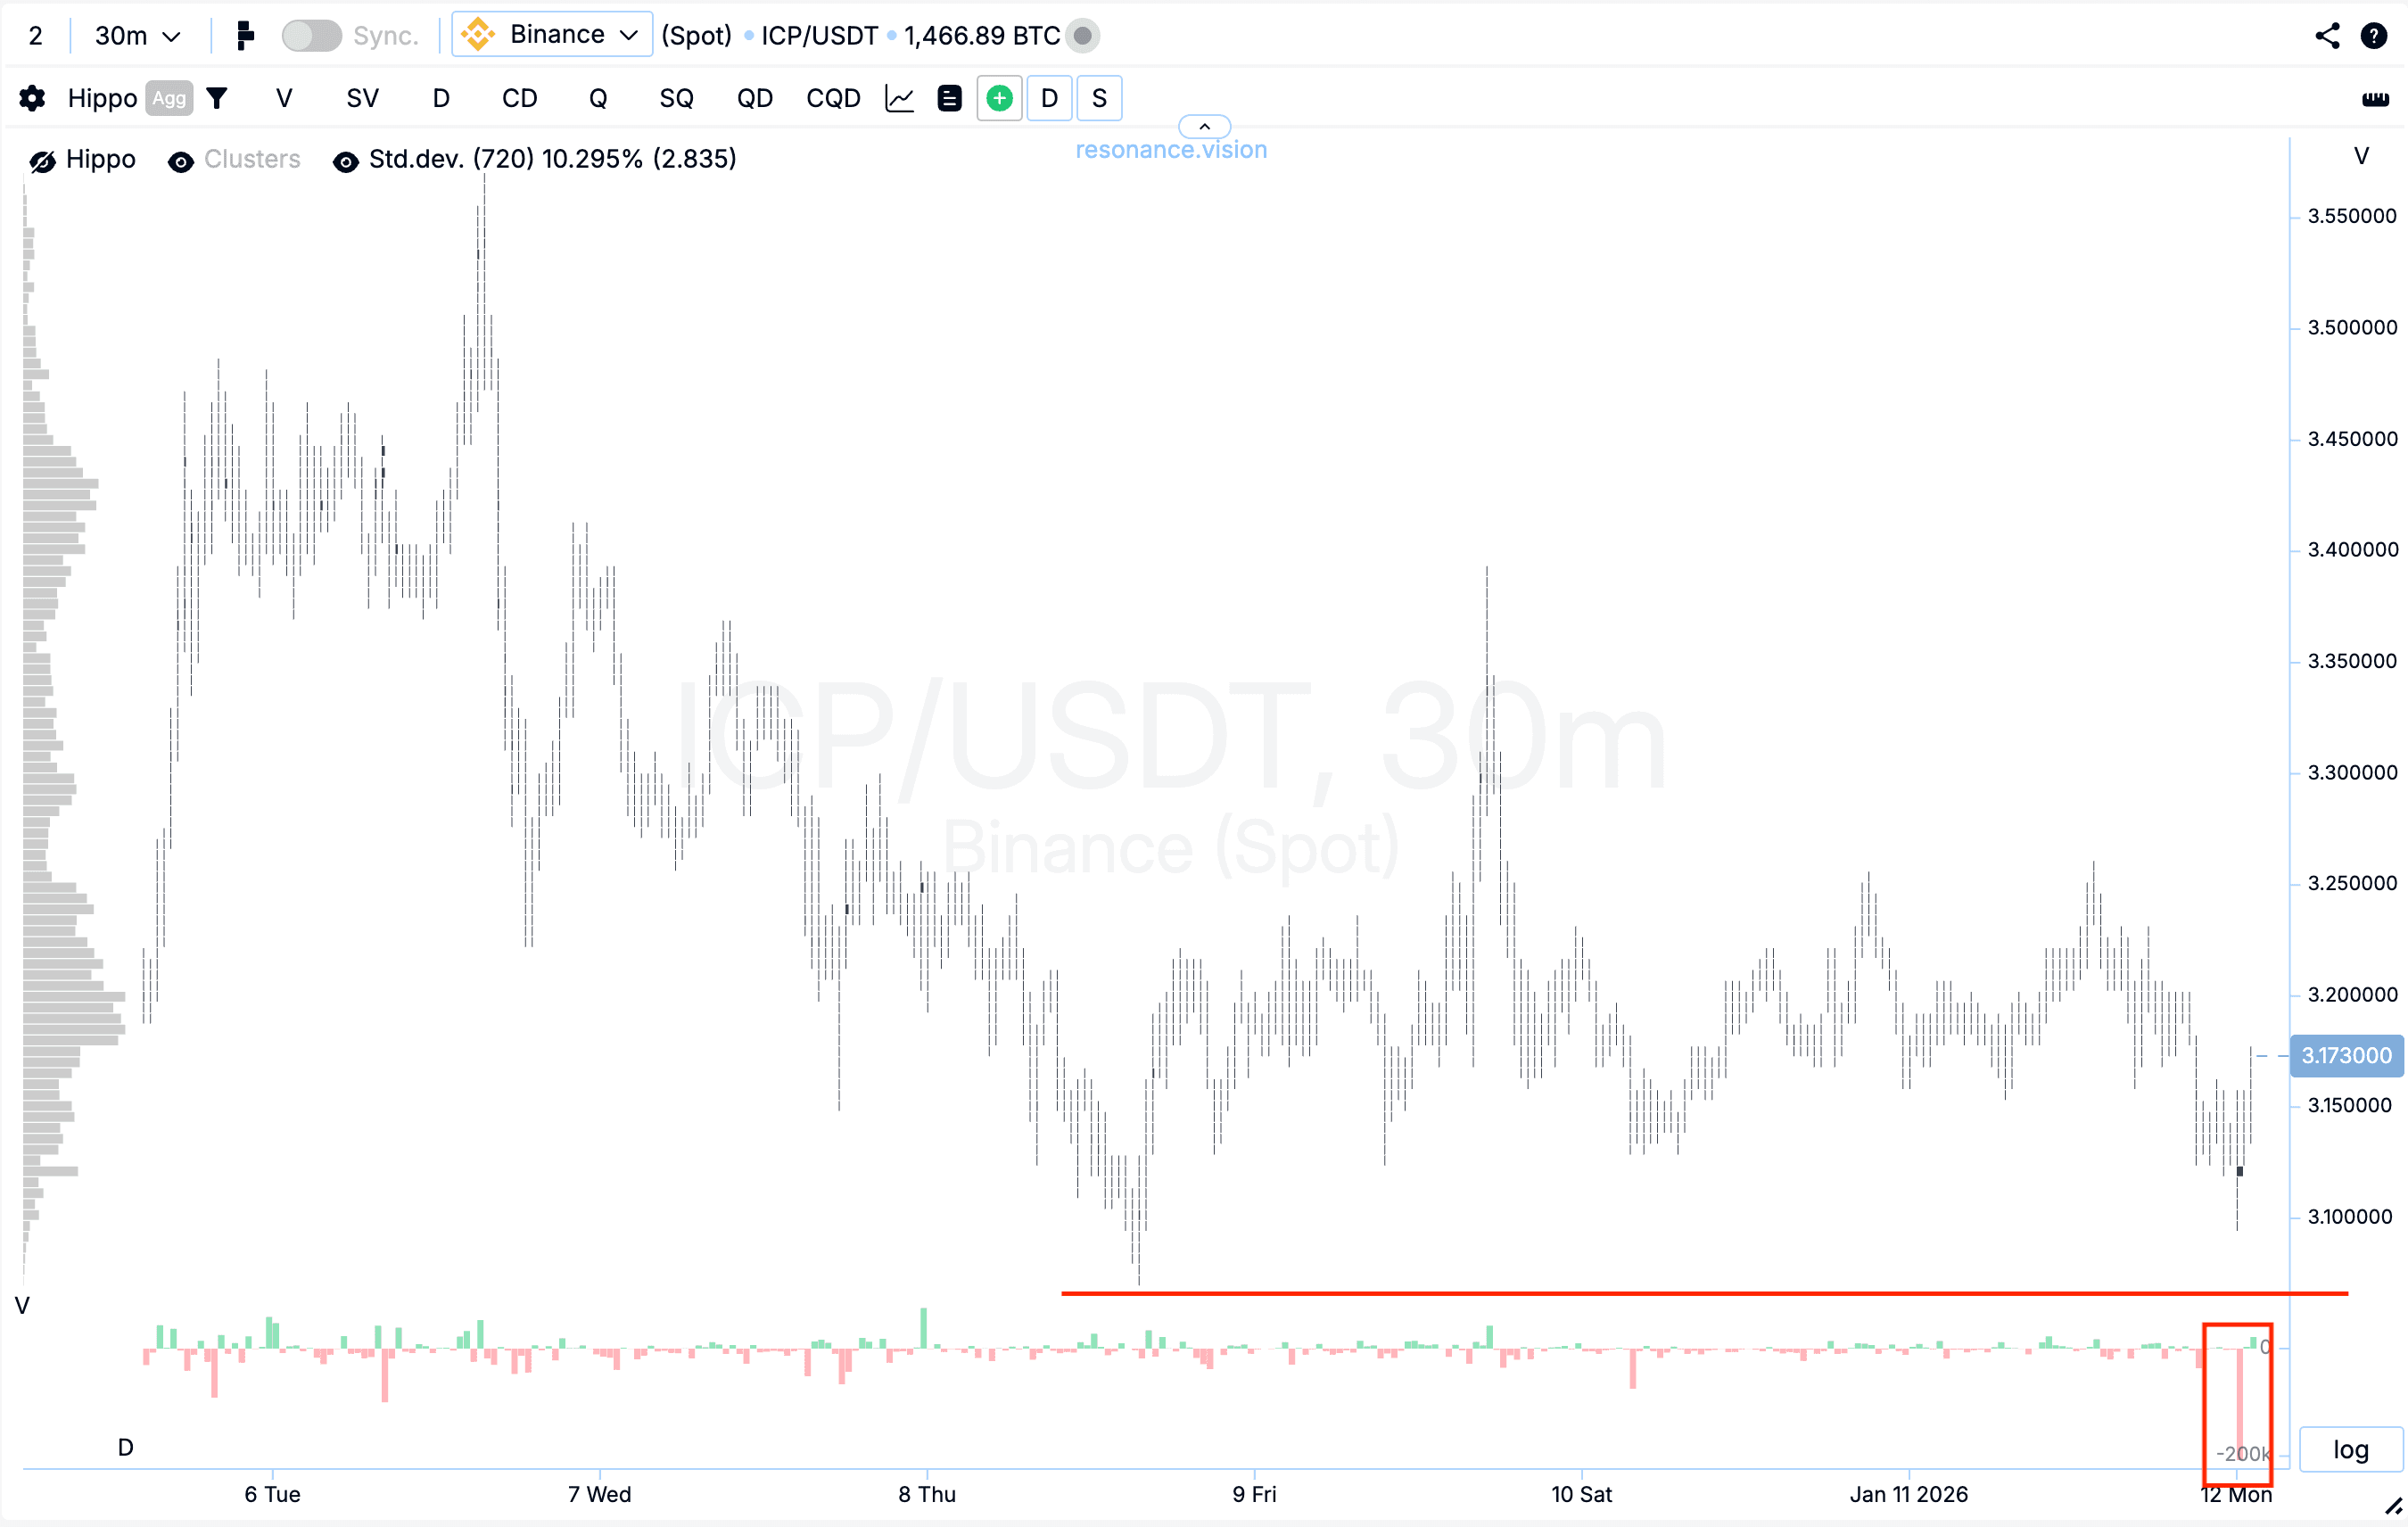
Кластерный график: В фазе боковой проторговки начали существенно преобладать маркет-объёмы на продажу, что отчётливо видно по гистограмме дельты (красный прямоугольник). Однако оказываемое давление оказалось неэффективным: цена не снижалась и не обновляла локальный минимум (красная линия). Такая реакция рынка указывает на появление признаков локального дефицита и заметное ослабление инициативы со стороны продавцов.
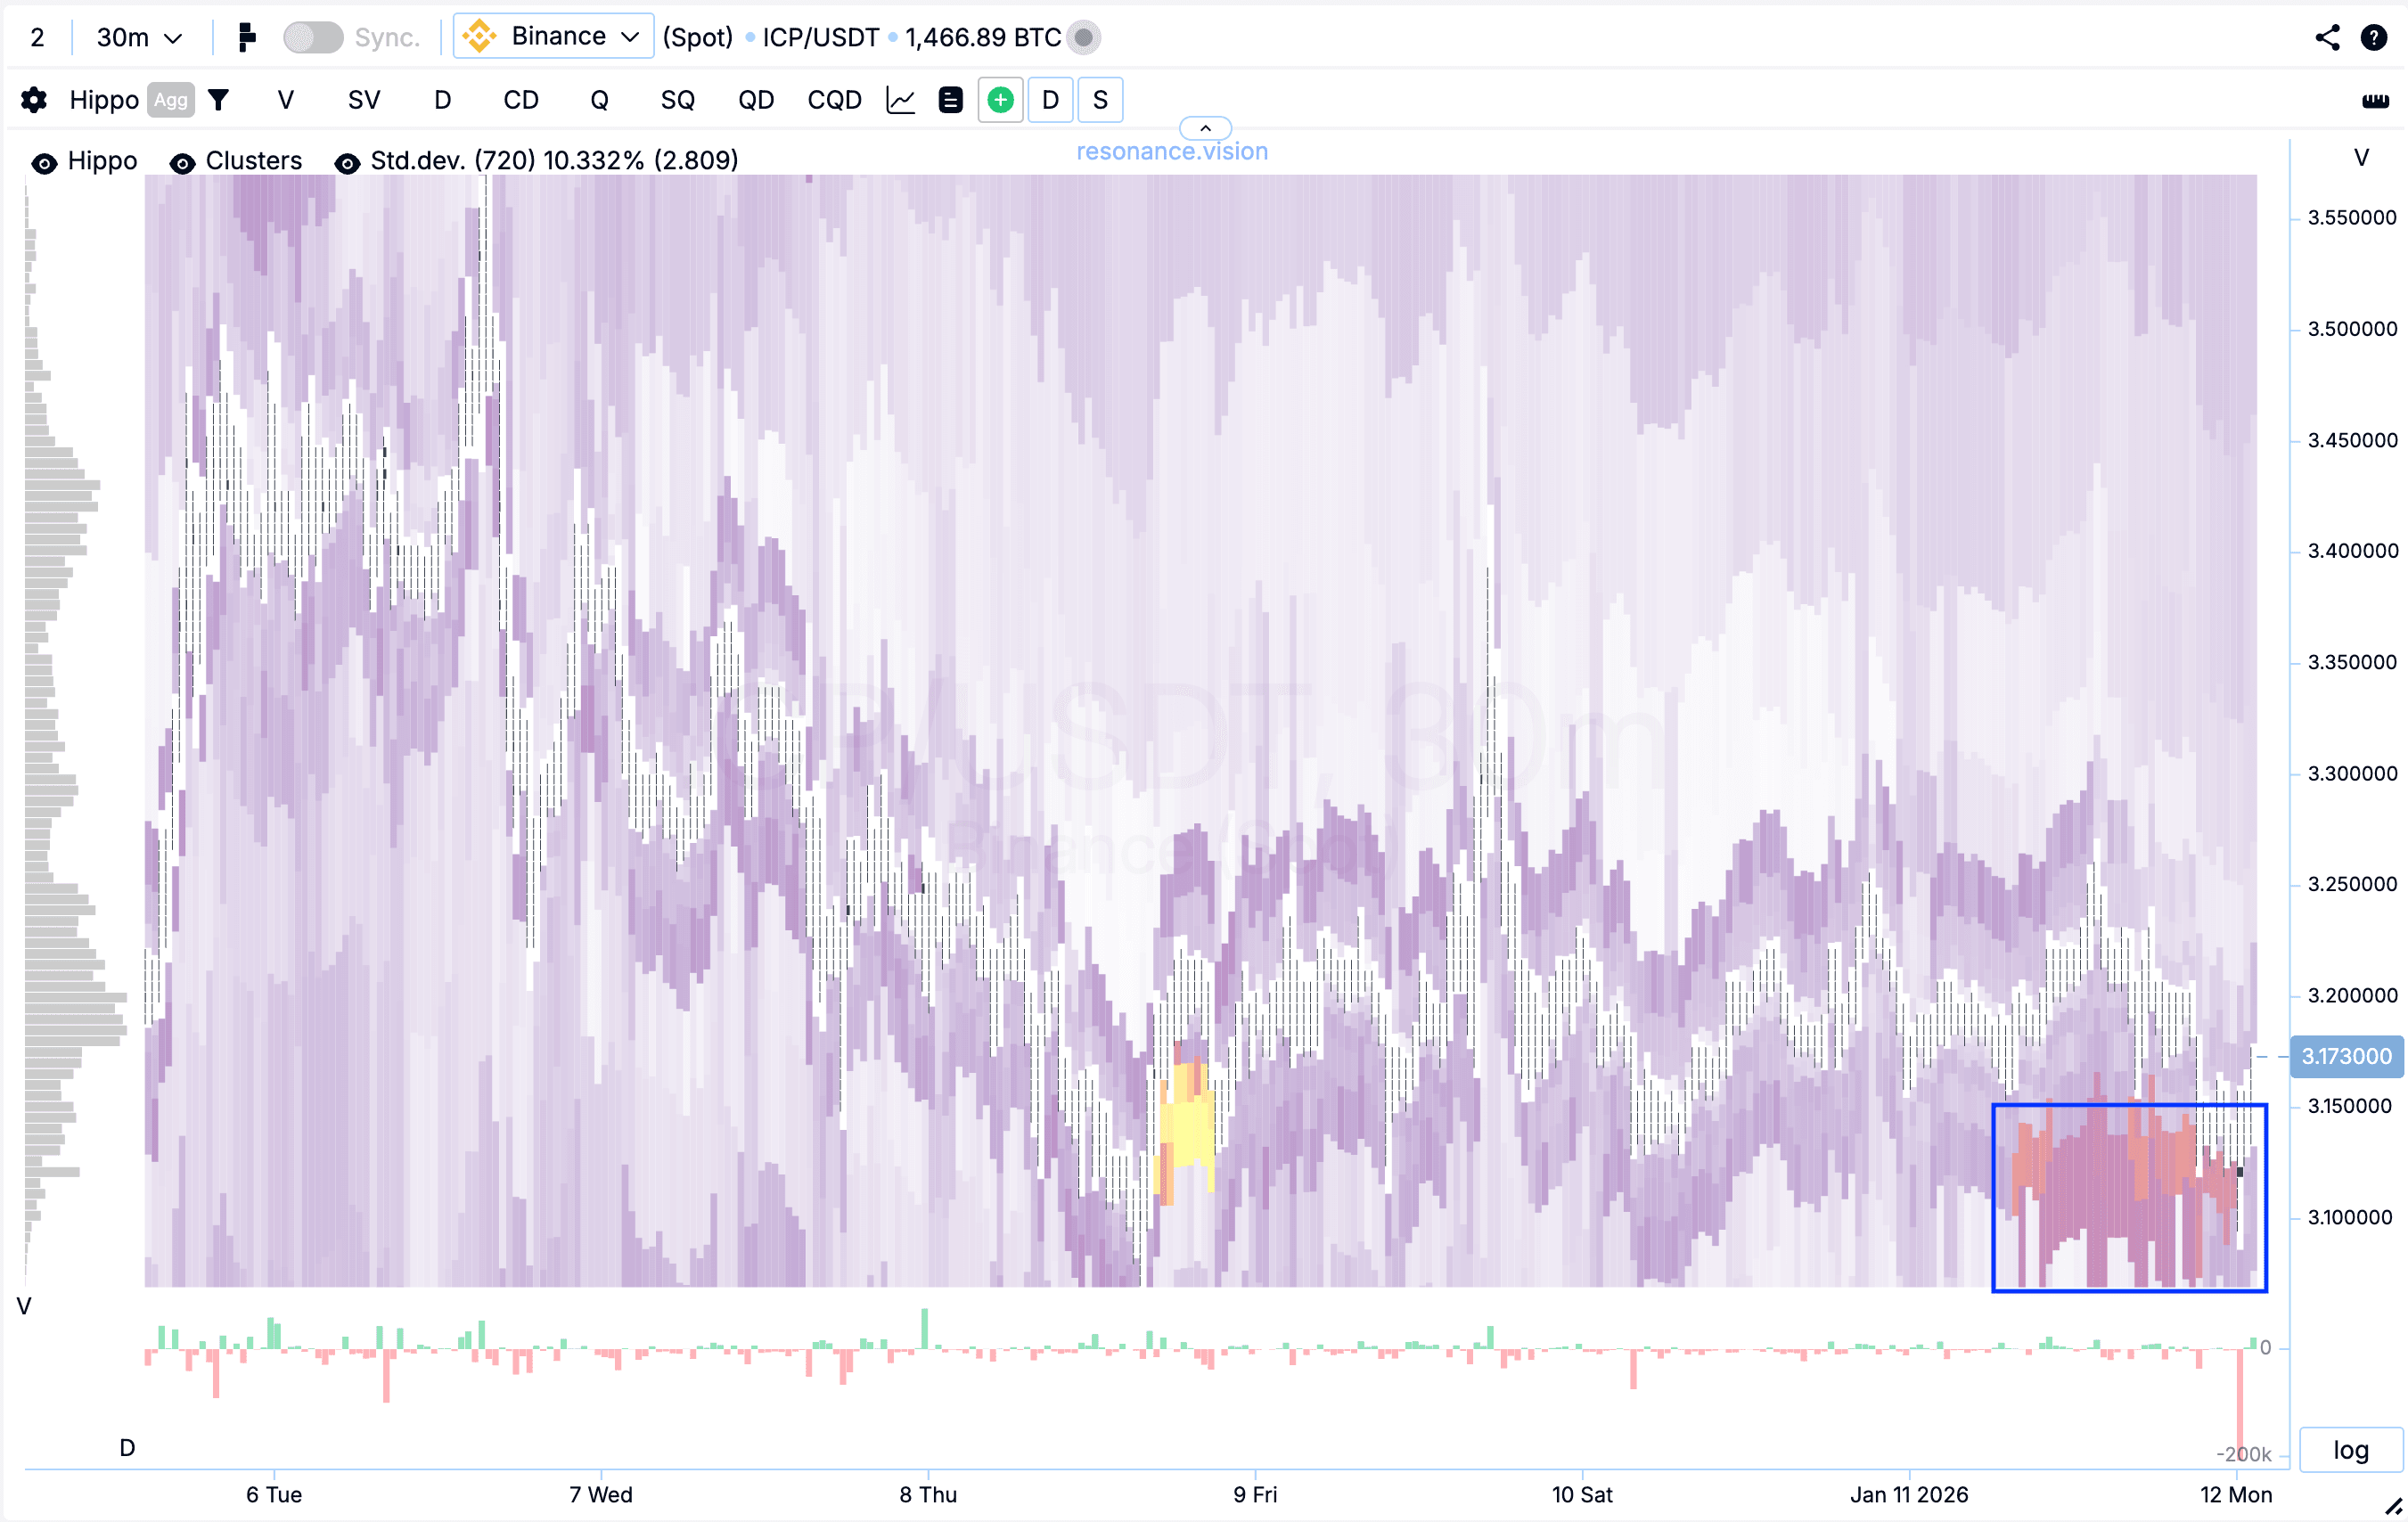
Тепловая карта в режиме объема: В рассматриваемом диапазоне зафиксированы аномальные лимитные плотности на покупку (синий прямоугольник), которые активно поглотили входящие маркет-продажи. Подобная структура подтверждает сохранение признаков локального дефицита и демонстрирует готовность лимитно удерживать весь поступающий рыночный объём на продажу.
В Дешборде
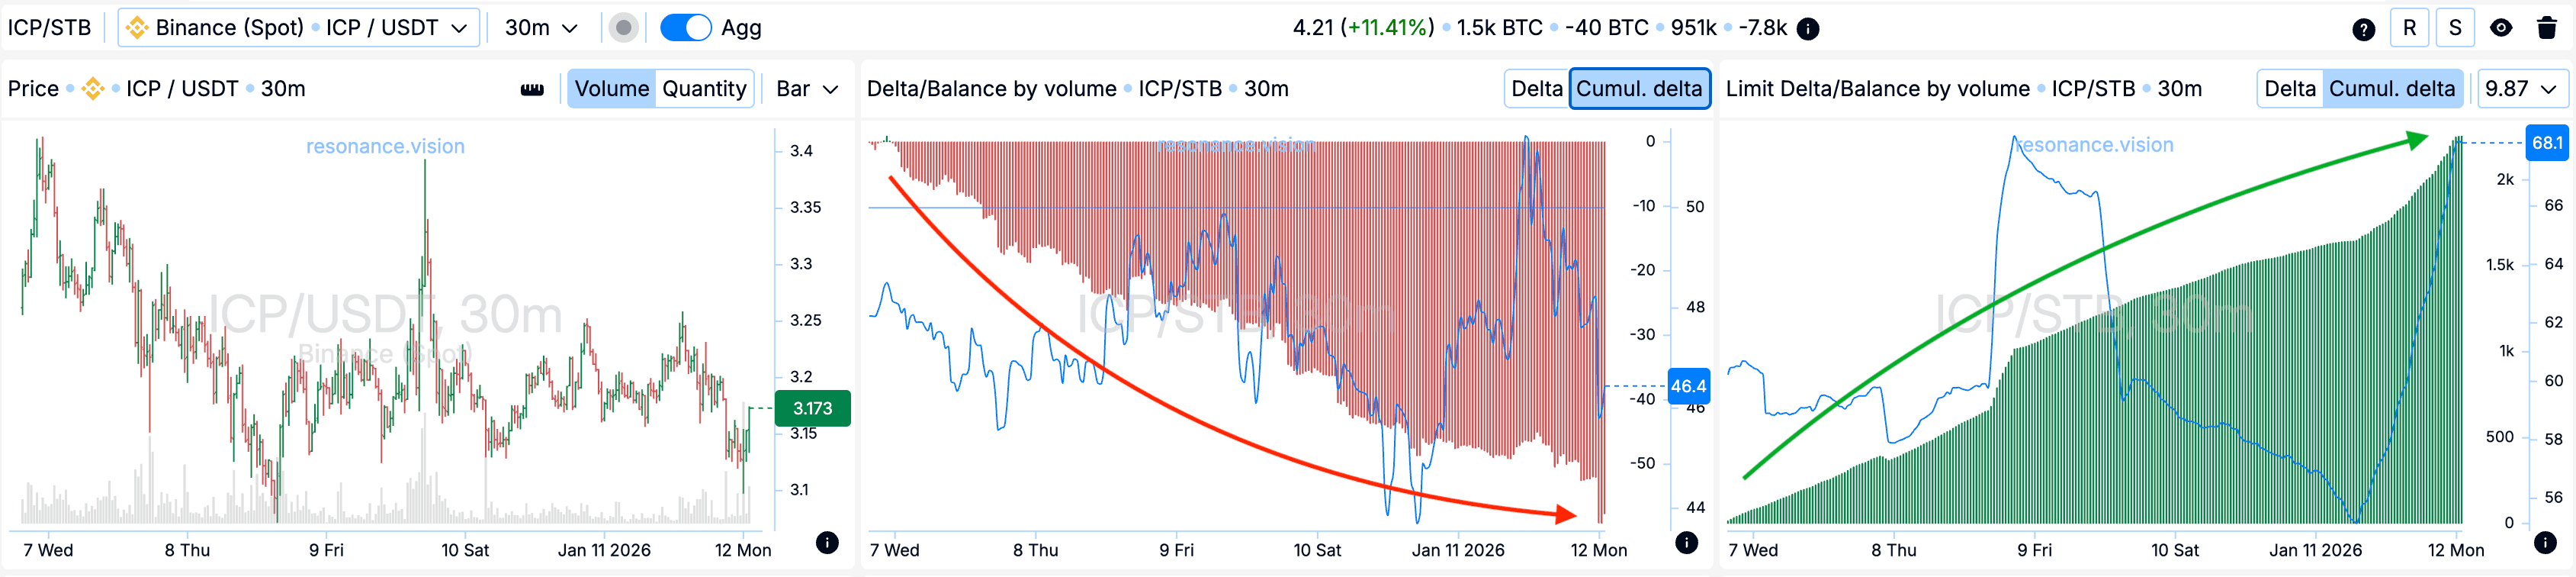
Дельта / Баланс по объёму и лимитная дельта: Агрегированные данные по всем парам и биржам полностью подтверждают картину, наблюдаемую на кластерном графике. В этот период объёмы рыночных продаж последовательно увеличивались, что хорошо видно по гистограмме кумулятивной дельты (красная стрелка). При этом цена перестала реагировать снижением. Дополнительно видно накопительное увеличение лимитных заявок на покупку (зелёная стрелка). Такая комбинация указывает на активное поглощение маркет-продаж лимитными участниками, формируя локальную поддержку и подтверждая ослабление давления со стороны продавцов.
Причины выхода
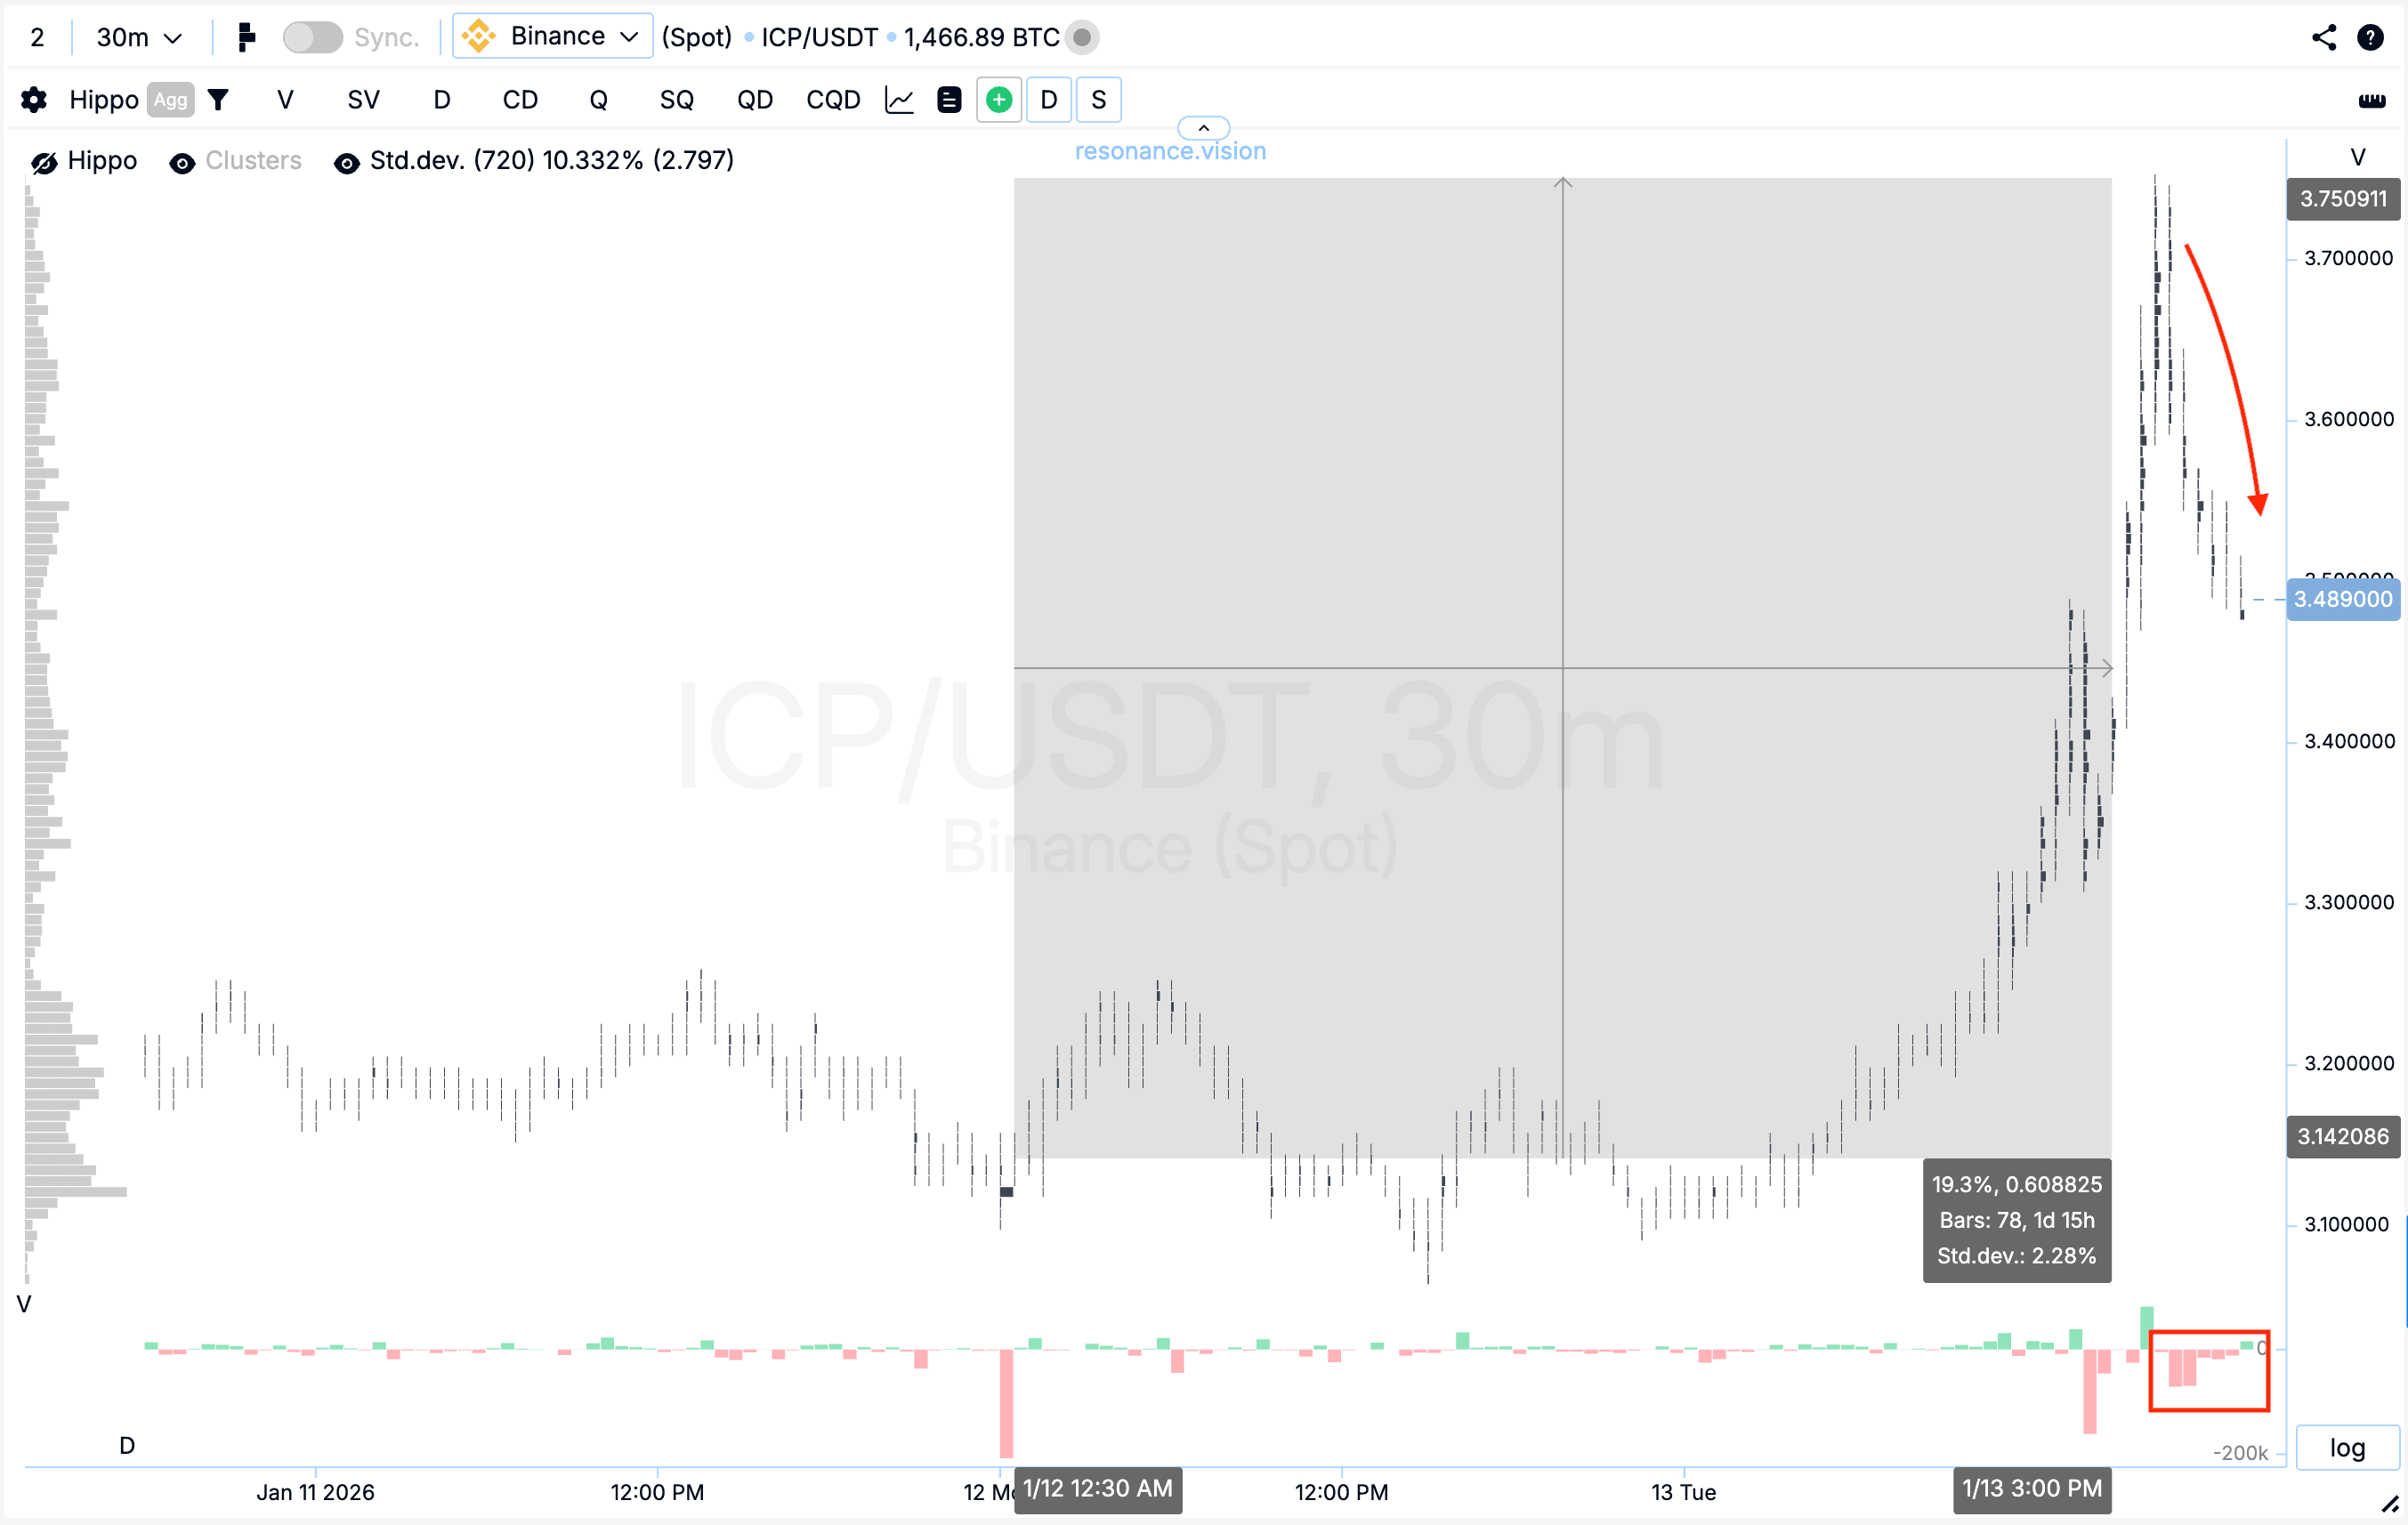
Кластерный график: После точки входа цена выросла практически на 20%, при этом в данном диапазоне заметно усилилась волатильность. Далее начали преобладать маркет-продажи, на фоне которых сформировалось плавное снижение цены, что указывает на рост эффективности продавцов (красный прямоугольник и стрелка). В этих условиях дальнейшее удержание позиции приводило бы к увеличению риска, поэтому фиксация прибыли являлась наиболее логичным и взвешенным решением.
Заключение
Рынок наглядно показал классическую ситуацию локального дефицита: при доминировании маркет-продаж цена перестала снижаться, что указывало на присутствие сильного лимитного спроса. Совокупная оценка кластерного графика, тепловой карты и агрегированных данных из дешборда позволила объективно определить момент входа и сопровождать движение до стадии, когда давление продавцов вновь стало эффективным. Такой подход - работа от объёма и реакции цены - позволяет выстраивать сделки с чёткой логикой, понятными условиями входа и своевременной фиксацией прибыли при росте риска.
Следи за новыми статьями в нашем телеграм канале.
Не нужно выдумывать сложных схем и искать “грааль”. Используй инструменты платформы Resonance.
Регистрируйся по ссылке — получай бонус и начинай зарабатывать:
OKX | BingX | KuCoin.
Промокод TOPBLOG дает тебе 10% скидки на любой тарифный план Resonance.
Рекомендуемые статьи


