MAGIC +24.5% (Напрямкова стратегія Резонанс)

Локальний дефіцит при домінуванні маркет-продажів 📊
Ціна не реагує на об’єм, лімітний попит поглинає маркет продаж та формує підтримку. Імпульсний рух та фіксація прибутку на зростанні волатильності.
Зміст

Монета: MAGIC/USDT
Ризик: середній
Рівень розуміння: новачок
Причини входу
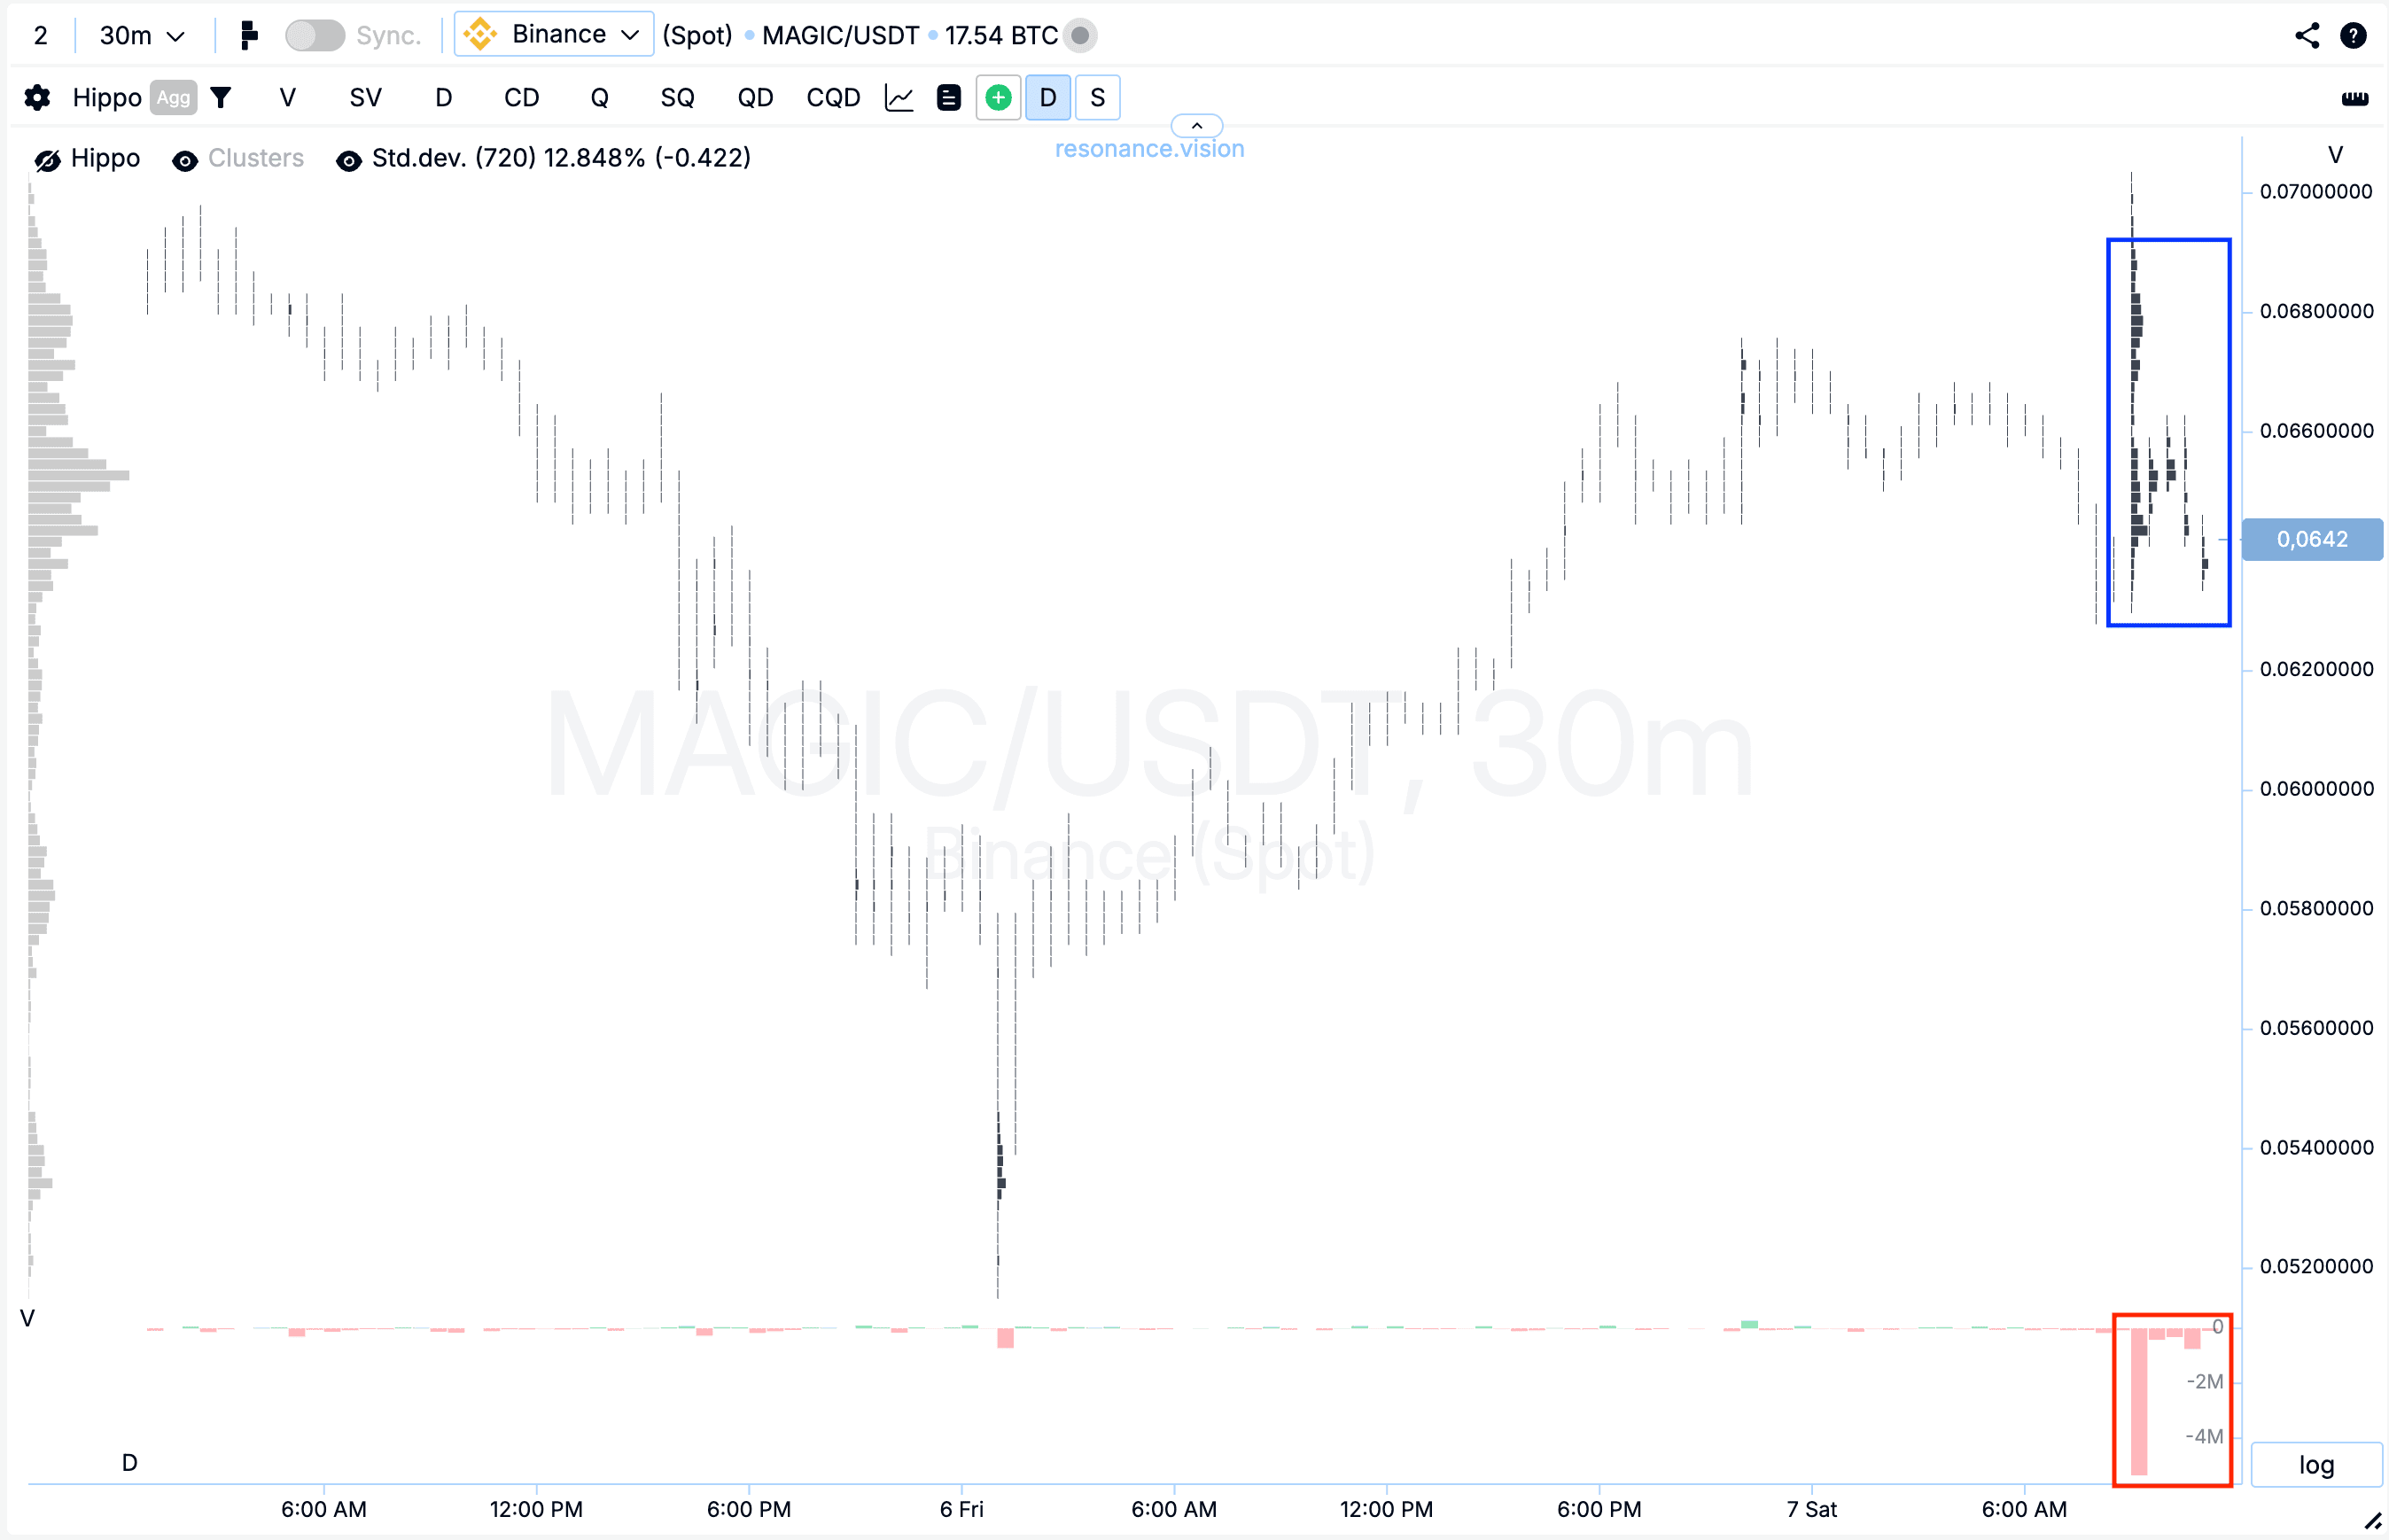
Кластерний графік: на локальному відкаті сформувалися великі об’ємні кластери (синій прямокутник), усередині яких переважали маркет-продажі (червоний прямокутник). Проте, незважаючи на тиск, ціна перестала реагувати зниженням і не показала істотного продовження руху вниз.
Така реакція ринку вказує на ознаки локального дефіциту: продавці продовжують активно витрачати об’єм, але їхній вплив на ціну помітно слабшає, що часто свідчить про можливу зміну ініціативи.
У Дешборді
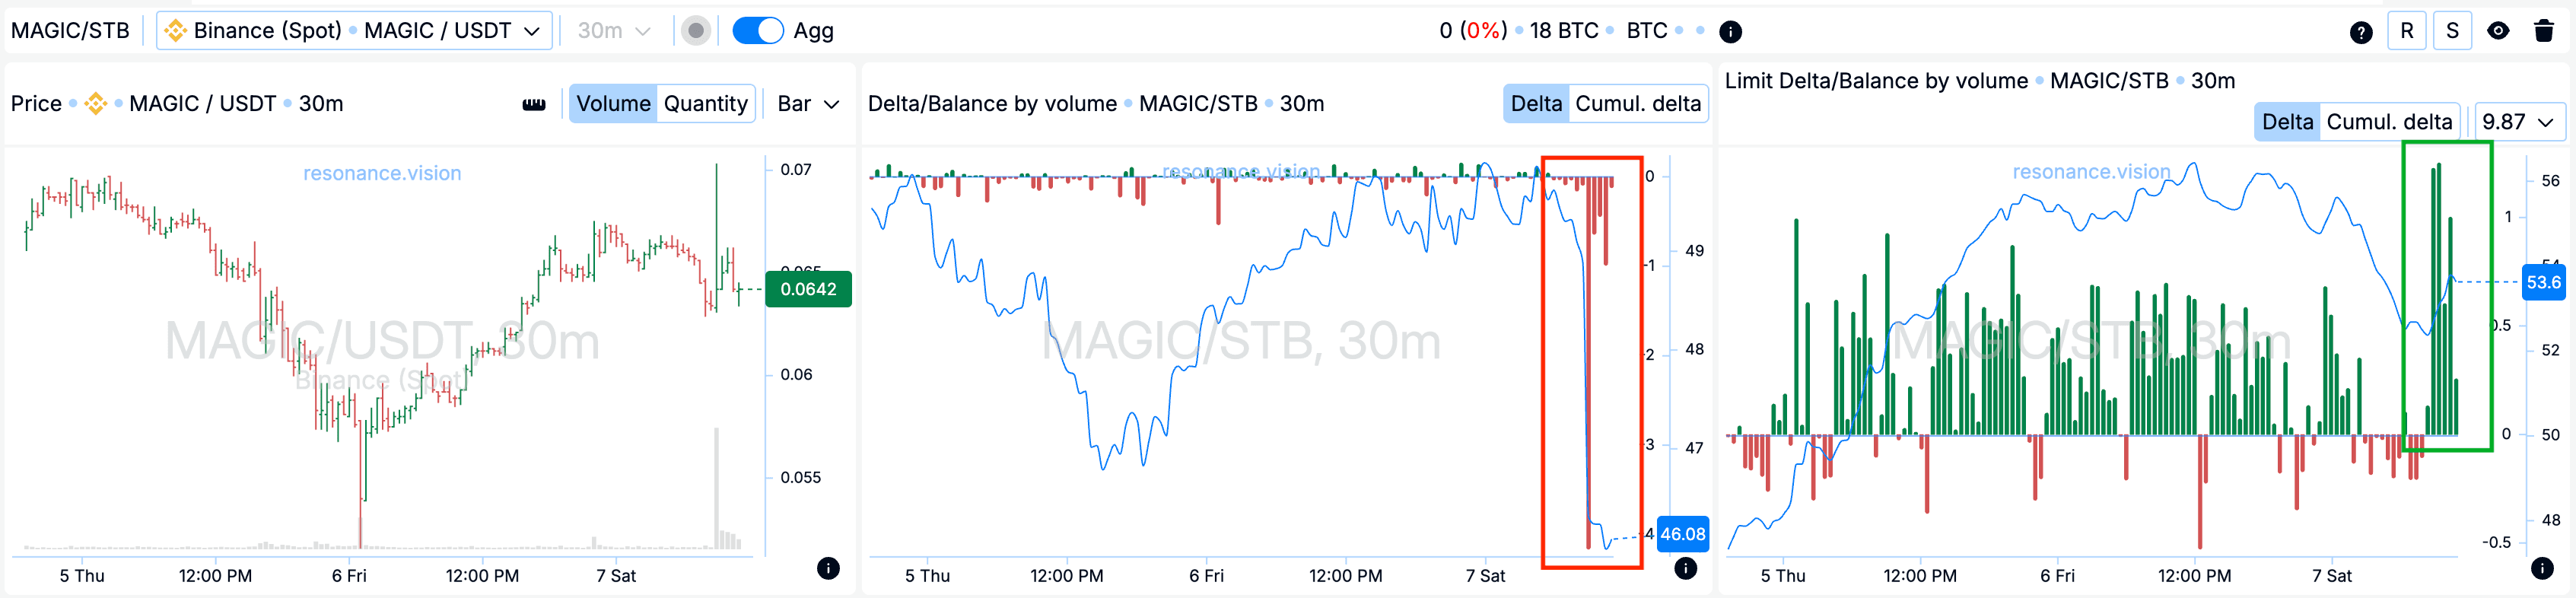
Дельта / Баланс за об’ємом та лімітна дельта: агреговані дані по всіх парах та біржах підтверджують спостереження з кластерного графіка. У аналізований період об’єми ринкових продажів були значно вищими, ніж попередніх ділянках, що виразно видно з гістограмі дельти (червоний прямокутник). При цьому ціна не демонструвала відповідної реакції та не оновлювала локальний мінімум.
Додатково наголошується, що у той же період лімітні заявки почали помітно переважати на стороні покупок (зелений прямокутник). Така комбінація вказує на активне поглинання вхідного маркет-об’єму продажів лімітними учасниками, що формує локальну підтримку та додатково підтверджує ослаблення тиску продавців.
Причини виходу
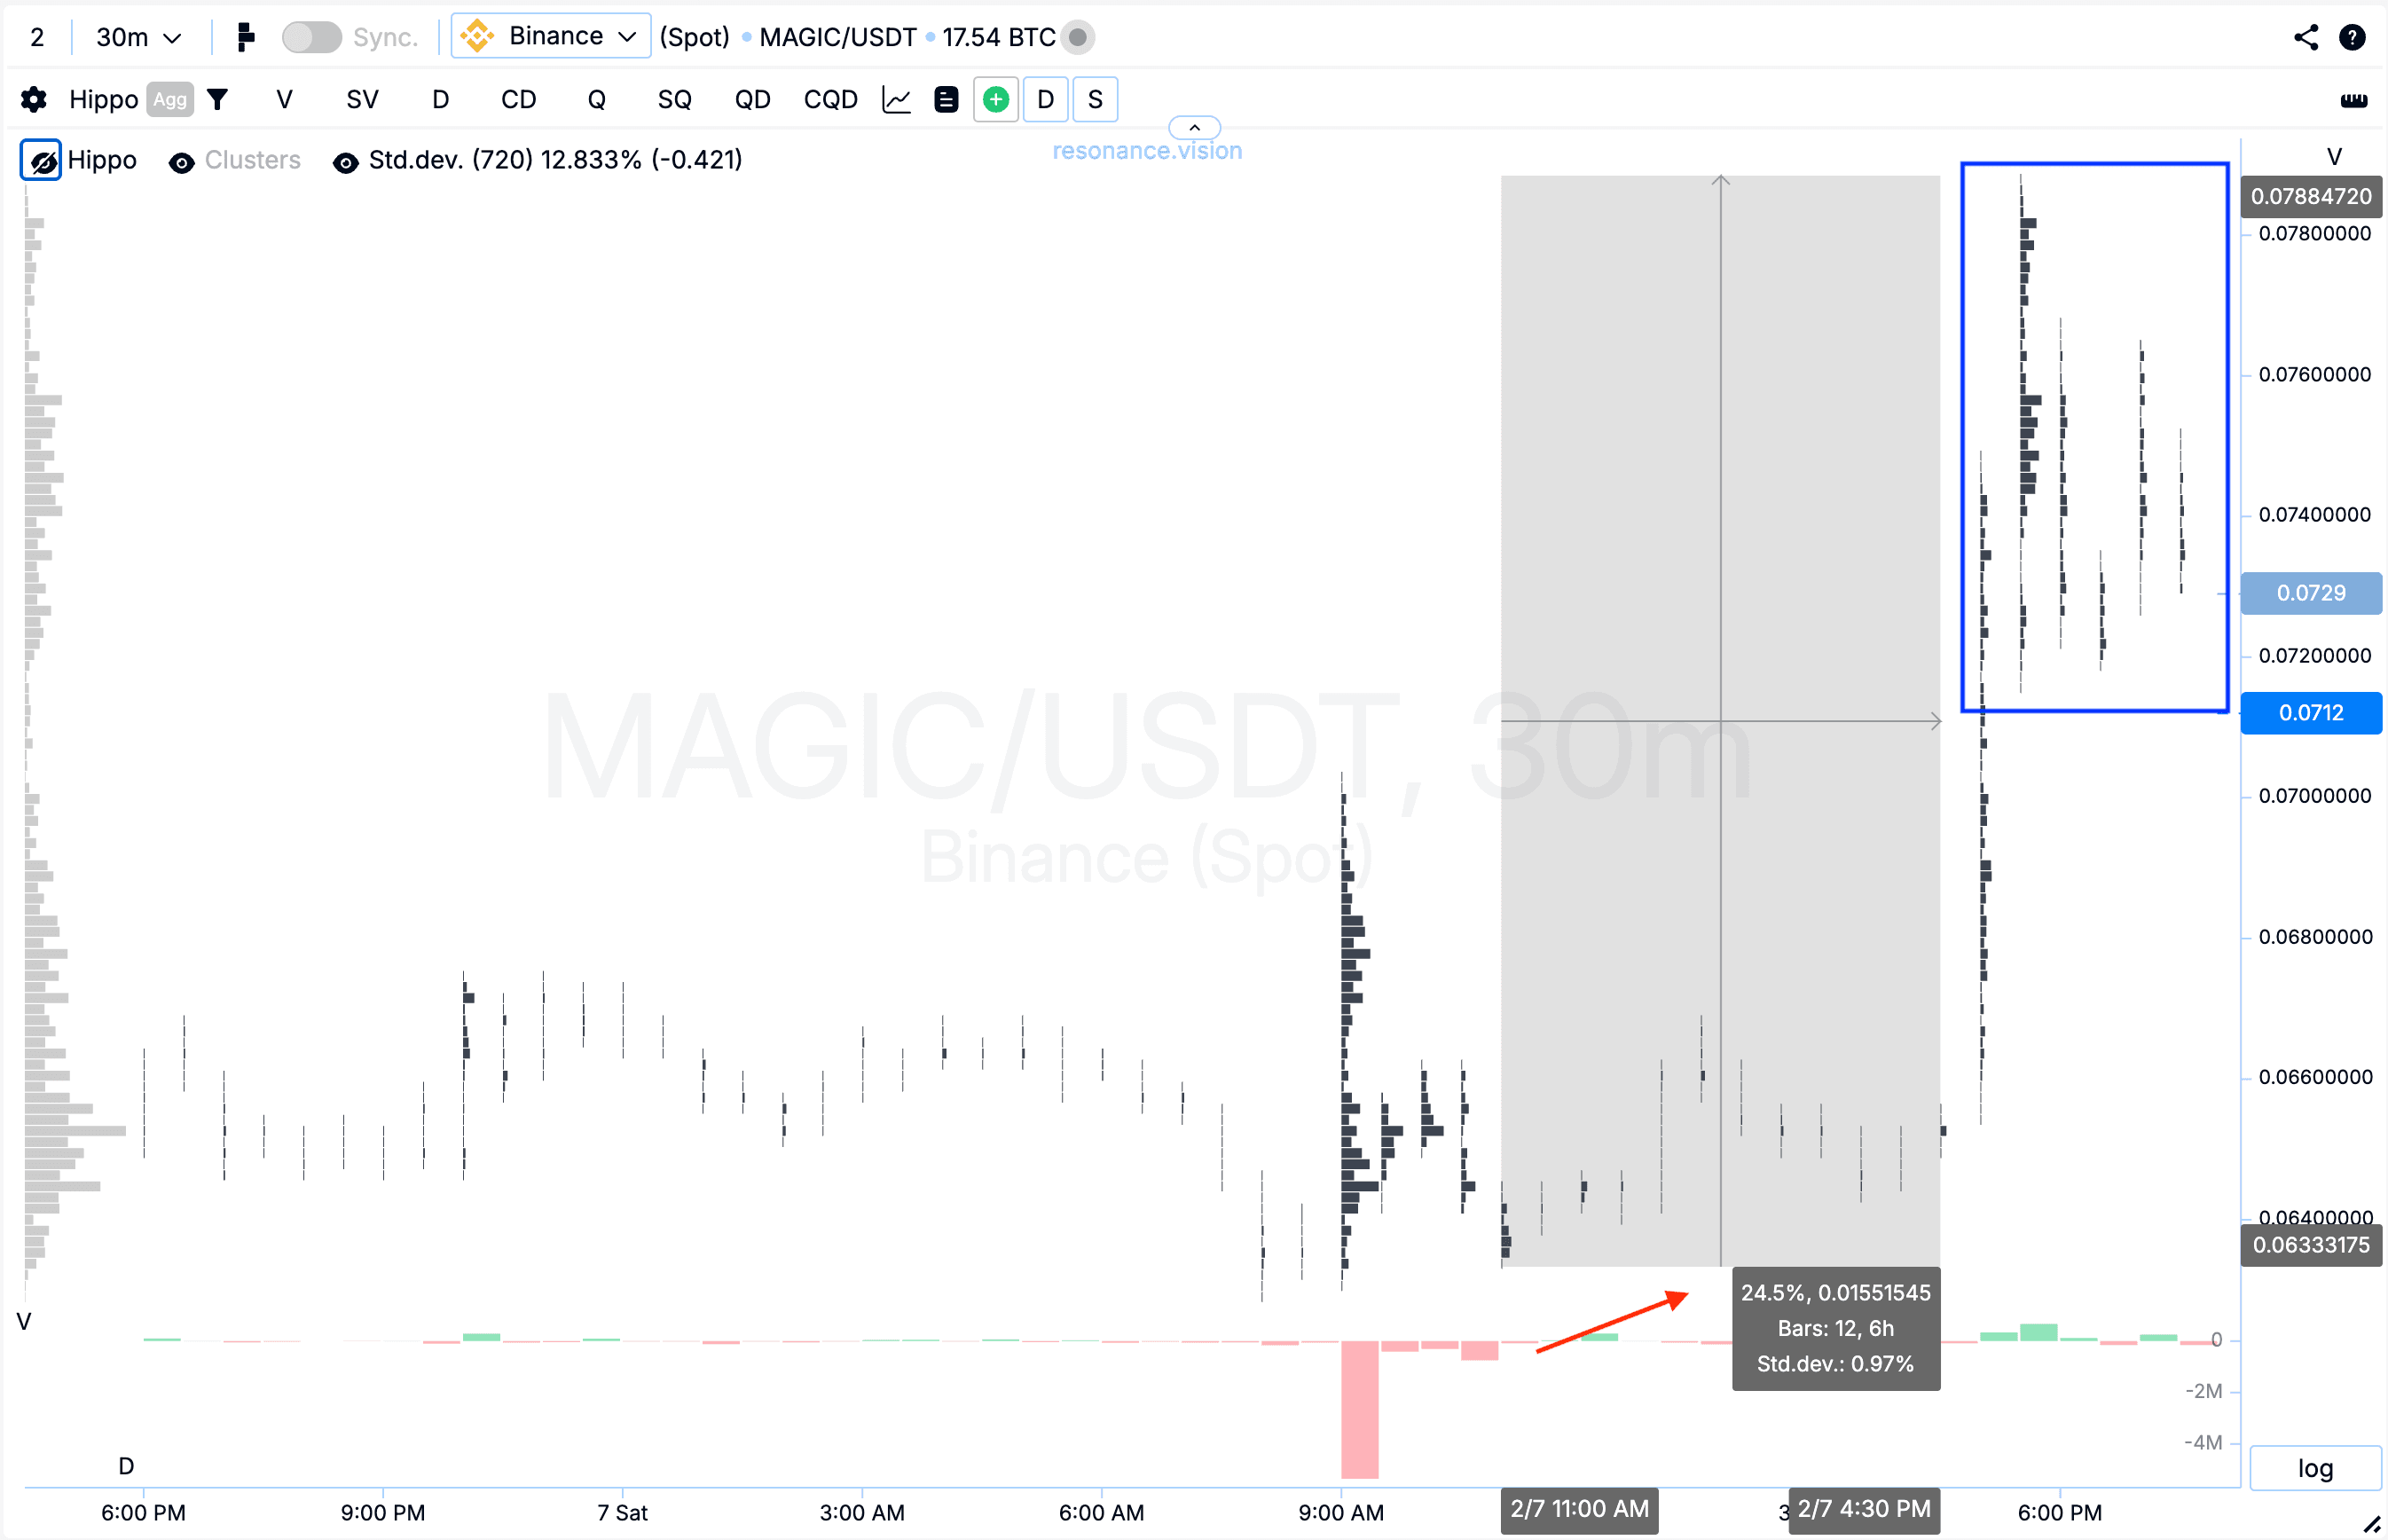
Кластерний графік: від точки входу було зафіксовано імпульсний ціновий рух, в результаті якого загальне зростання склало близько 24,5%. На цій ділянці значно зросла волатильність (синій прямокутник), після чого почав формуватись відкат.
У разі підвищеної волатильності подальше утримання позиції пов’язані з зростанням ризику, оскільки ринок часто переходить у фазу пошуку балансу. У цьому контексті фіксація позиції виглядала найбільш раціональним рішенням з погляду управління ризиком.
Висновок
Цей аналіз наочно показує, що ключовим фактором у подібних угодах є не сам об’єм, а реакція ціни на цей об’єм. Незважаючи на домінування маркет-продажів, ринок перестав знижуватися, а лімітний попит почав послідовно поглинати вхідний об’єм, формуючи локальну підтримку.
Такі ситуації виникають над ринком досить часто. При системній оцінці кластерного графіка, агрегованих даних та лімітної ліквідності подібні рухи можна знаходити регулярно в рамках дейтрейдингу, зберігаючи при цьому контроль за ризиком.
Стеж за новими статтями у нашому телеграм каналі.
Не треба вигадувати складних схем та шукати “грааль”. Використовуйте інструменти платформи Resonance.
Реєструйся за посиланням - отримуй бонус і починай заробляти:
OKX | BingX | KuCoin.
Промокод TOPBLOG дає тобі 10% знижки на будь-який тарифний план Resonance.
Рекомендовані статті


