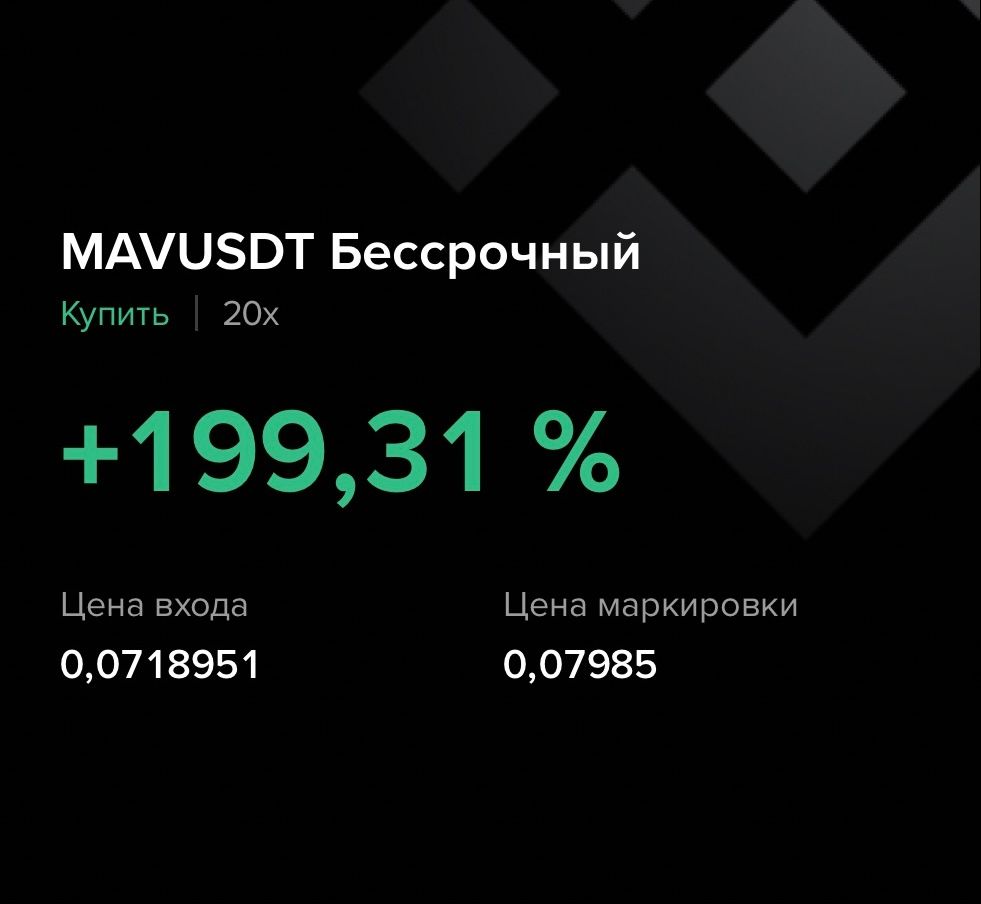
MAV +199.31% (Directional Strategy Resonance)

In this analysis, we looked at a MAV/USDT trade: from finding an entry point through clusters and delta analysis to exiting with a result of +199.31%. We will analyze what signs of deficit and surplus can be seen on the chart, and why profit taking was the best solution.
Table of contents

Coin: MAV/USDT
Risk: Medium
Skill level: Beginner
Entry reasons
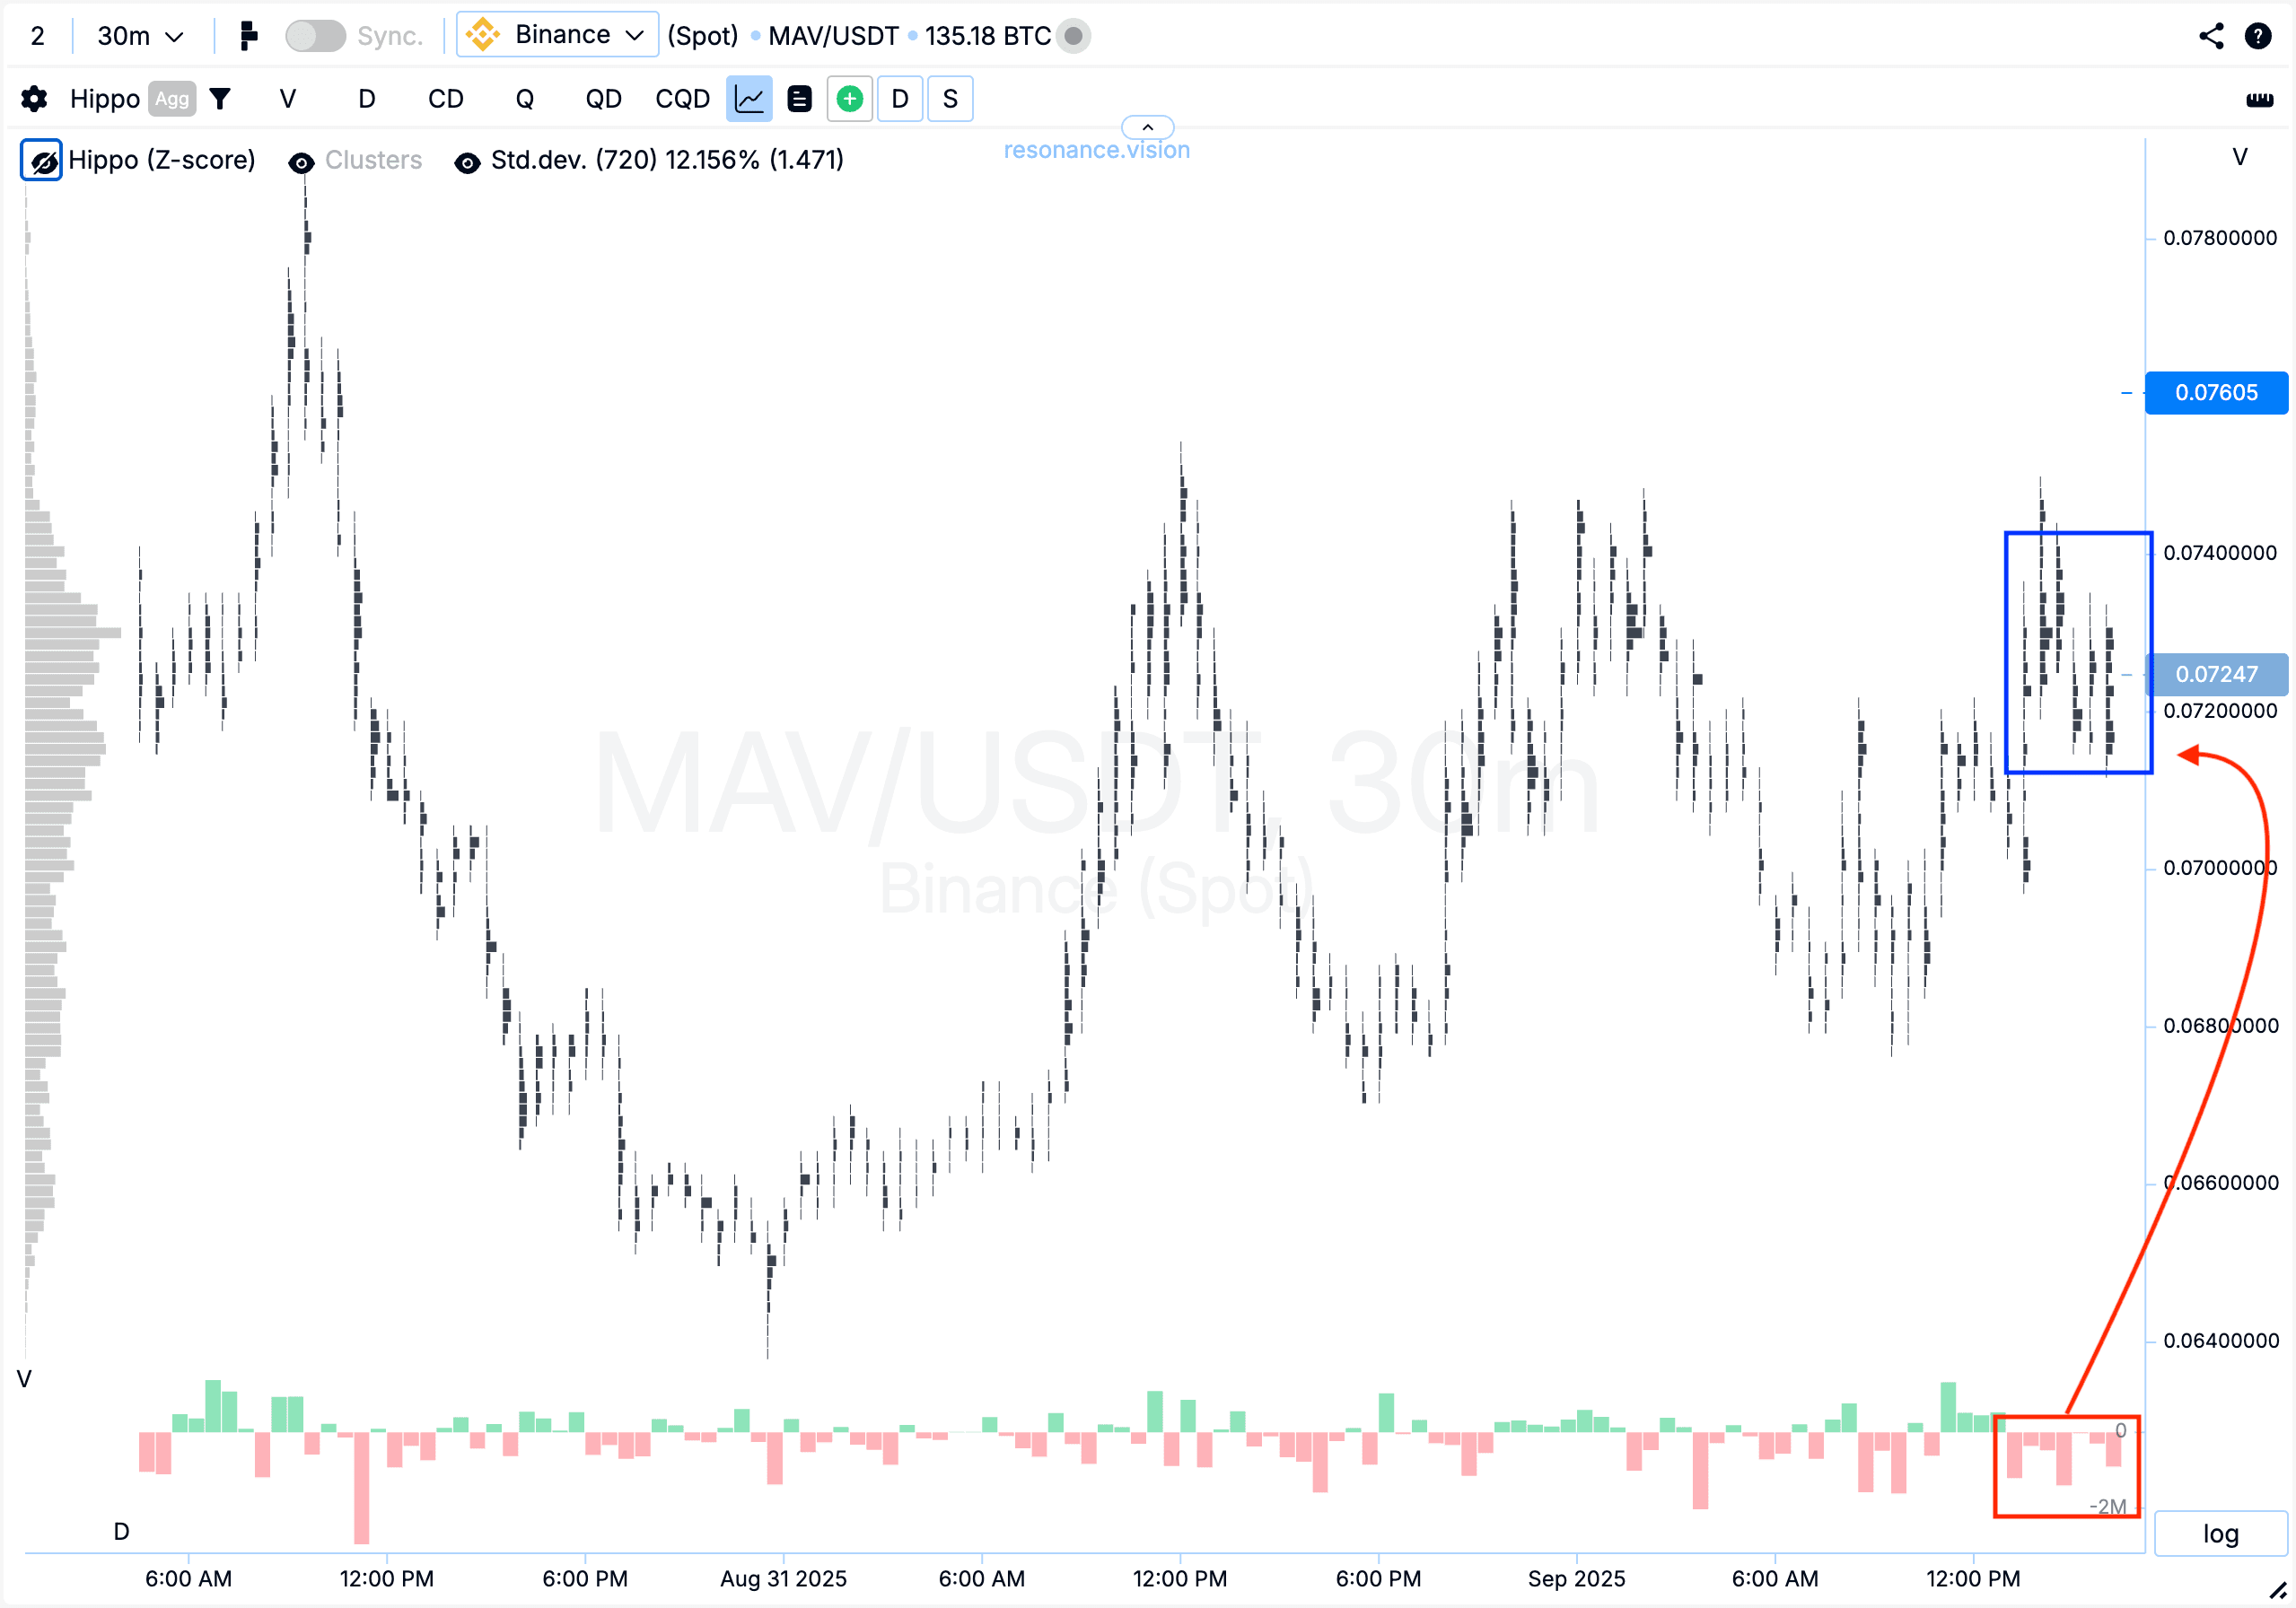
Cluster chart: Volume clusters began forming (blue rectangle), dominated by selling (red rectangle and arrow). Despite the noticeable selling pressure, price did not significantly decline and failed to update the local low. This suggested a local shortage and weakening seller initiative.
In the Dashboard
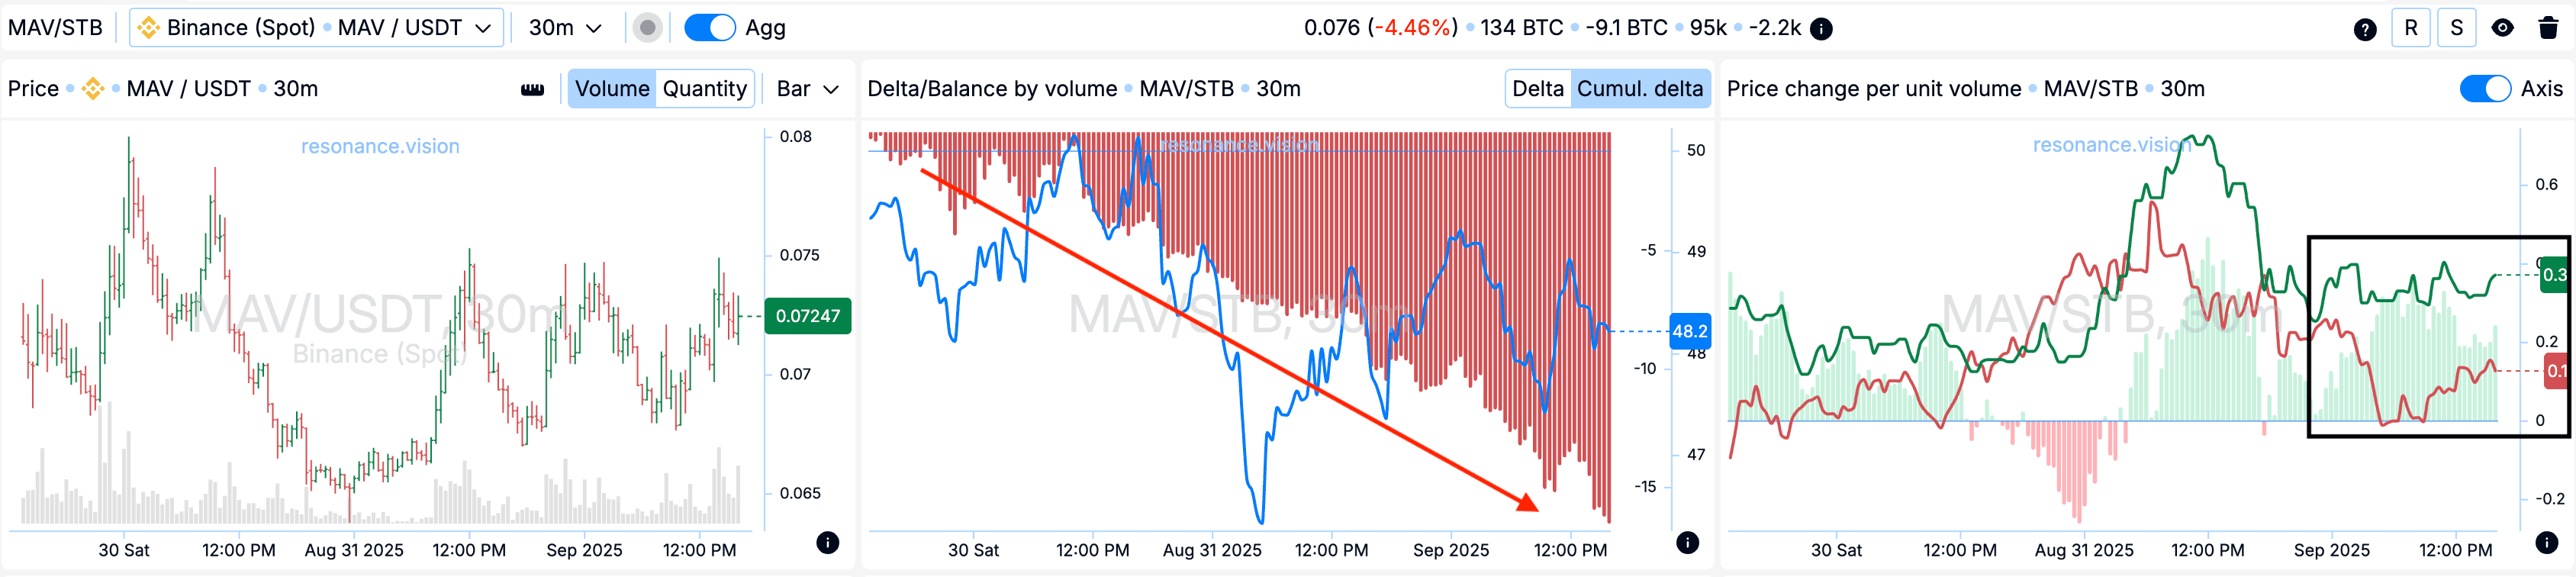
Delta / Volume balance: Market orders showed a clear dominance of selling — confirmed by the cumulative delta histogram (red arrow). However, despite this pressure, price remained stable.
Price change per unit of volume: The effectiveness of market orders shifted, with buyers gaining influence — visible from the divergence in their favor (black rectangle).
Exit reasons
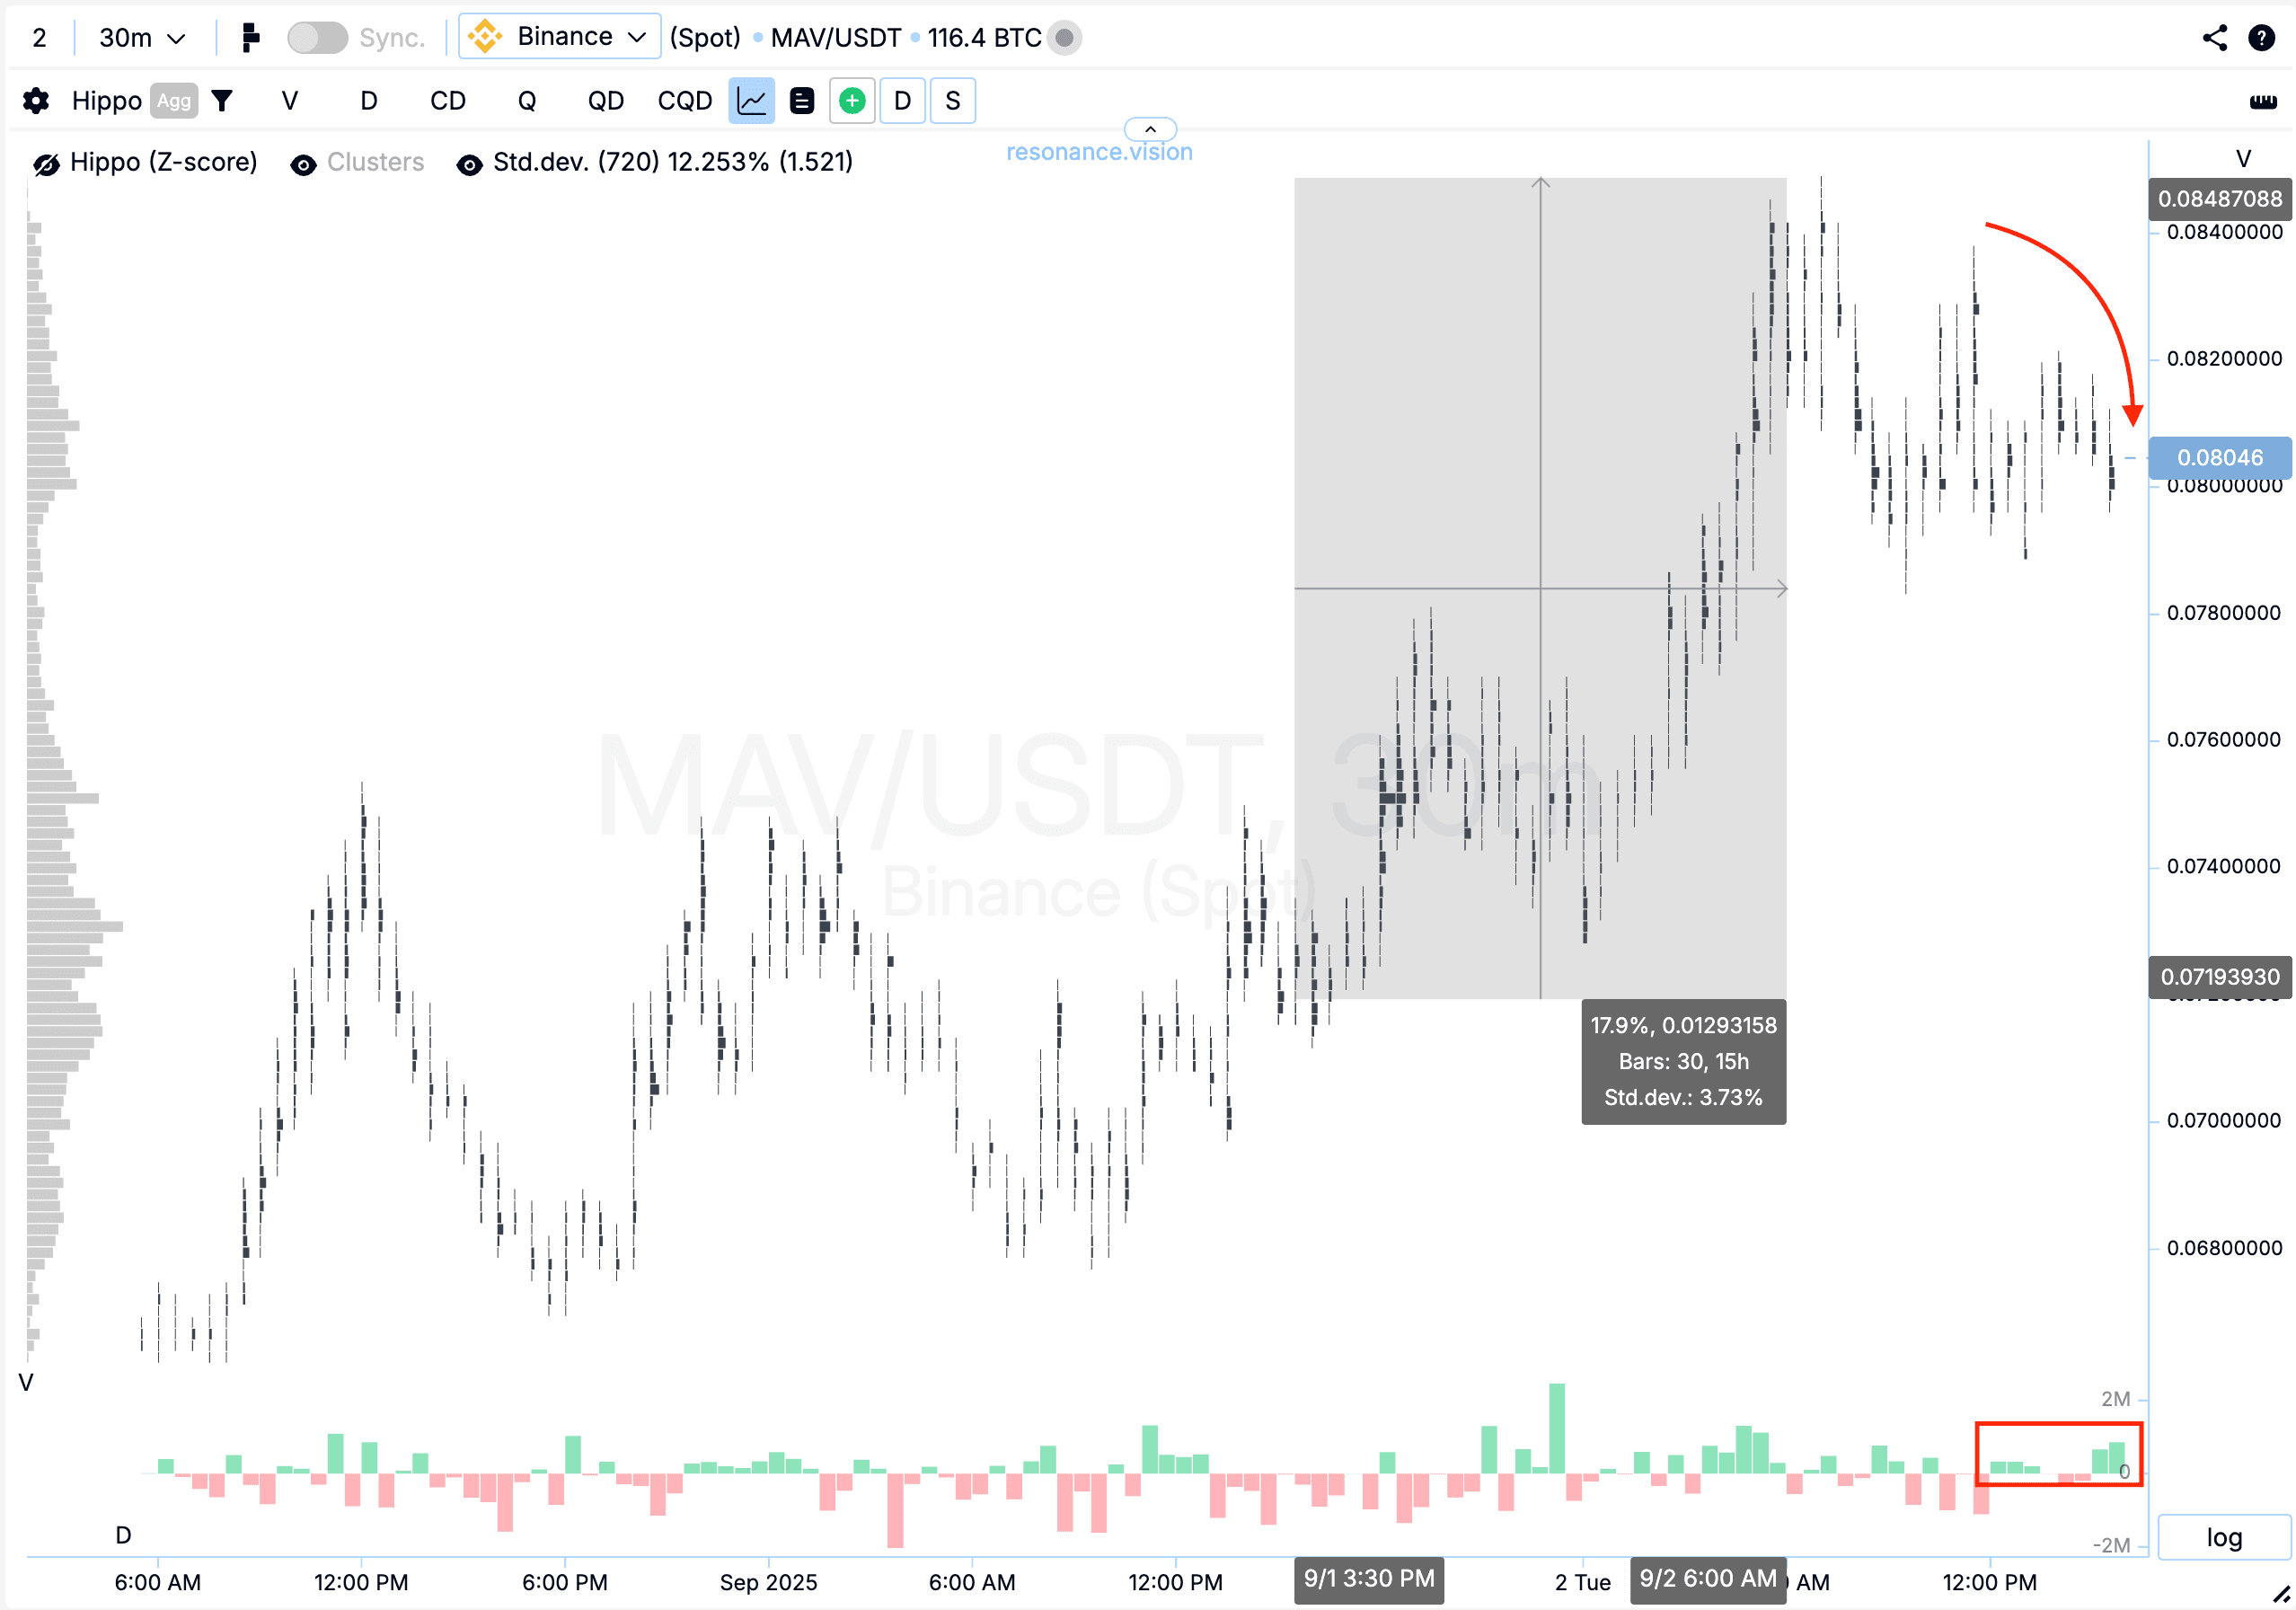
Cluster chart: From the entry point, the price moved up by about 18%, which is already a strong move. Afterwards, gradual decline began. Even during buying activity, price continued to fall (rectangle and arrow), indicating a potential local surplus and weakening buyer strength.
Result: Profit locked at +199.31%.
Conclusion
A confident move was captured in this trade. The initial entry signal was confirmed by the balance of market orders, where price showed shortage signs despite seller pressure.
However, further holding became risky — price declined even on buying activity, showing a local surplus and weakening buyer momentum. In such conditions, profit-taking was the optimal decision, securing the trade in strong positive territory.
Follow new insights in our telegram channel.
No need to invent complex schemes and look for the "grail". Use the Resonance platform tools.
Register via the link — get a bonus and start earning:
OKX | BingX.
Promo code TOPBLOG gives you a 10% discount on any Resonance tariff plan.
Recommended articles


