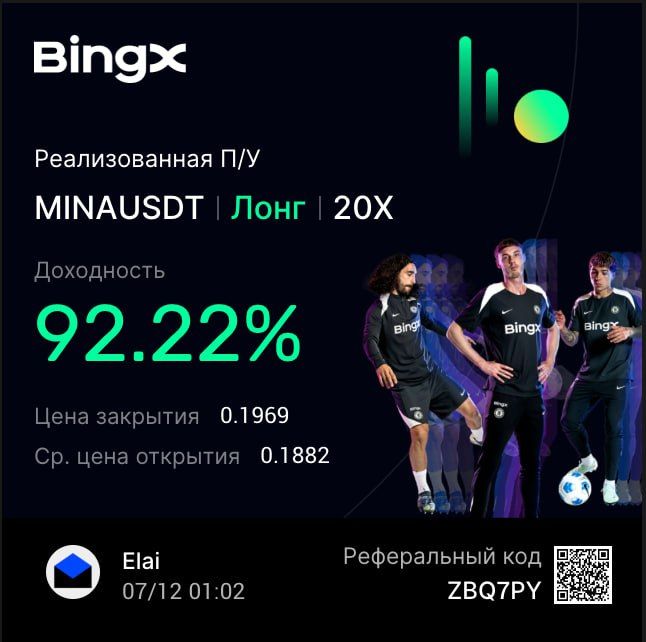
MINA +92,22% (Напрямкова стратегія Resonance)

Як розпізнати неефективні продажі, посилити позицію доборами та вчасно вийти за перших ознак невизначеності. Відмінний приклад роботи з ринку з дисципліною та розумінням обсягу.

Монета: MINA/USDT
Ризик: низький
Рівень розуміння: новачок
Тригером стала ідея одного з учнів нашого курсу.
Круто бачити, що ви не просто навчаєтесь, а реально застосовуєте знання на практиці. Сьогодні розберемо цю ситуацію докладніше.
Ось таку публікацію він написав:
Помітив MINA сьогодні вранці
Почав скрінити також на MEXC 👇
Мої думки:
Ціна поступово зростає, незважаючи на постійні продажі — це може свідчити про неефективність або дефіцит пропозиції
Більше продажів спостерігається на Huobi (найліквідніша біржа для цього тікеру)
Але на Binance червоні лише останні бари — це означає, що там більше купівельної активності
Все ще схиляюся до продовження 📈
Залиште свої думки нижче 💬
Але це лише ідея, її потрібно валідувати та реалізувати
Причини входу
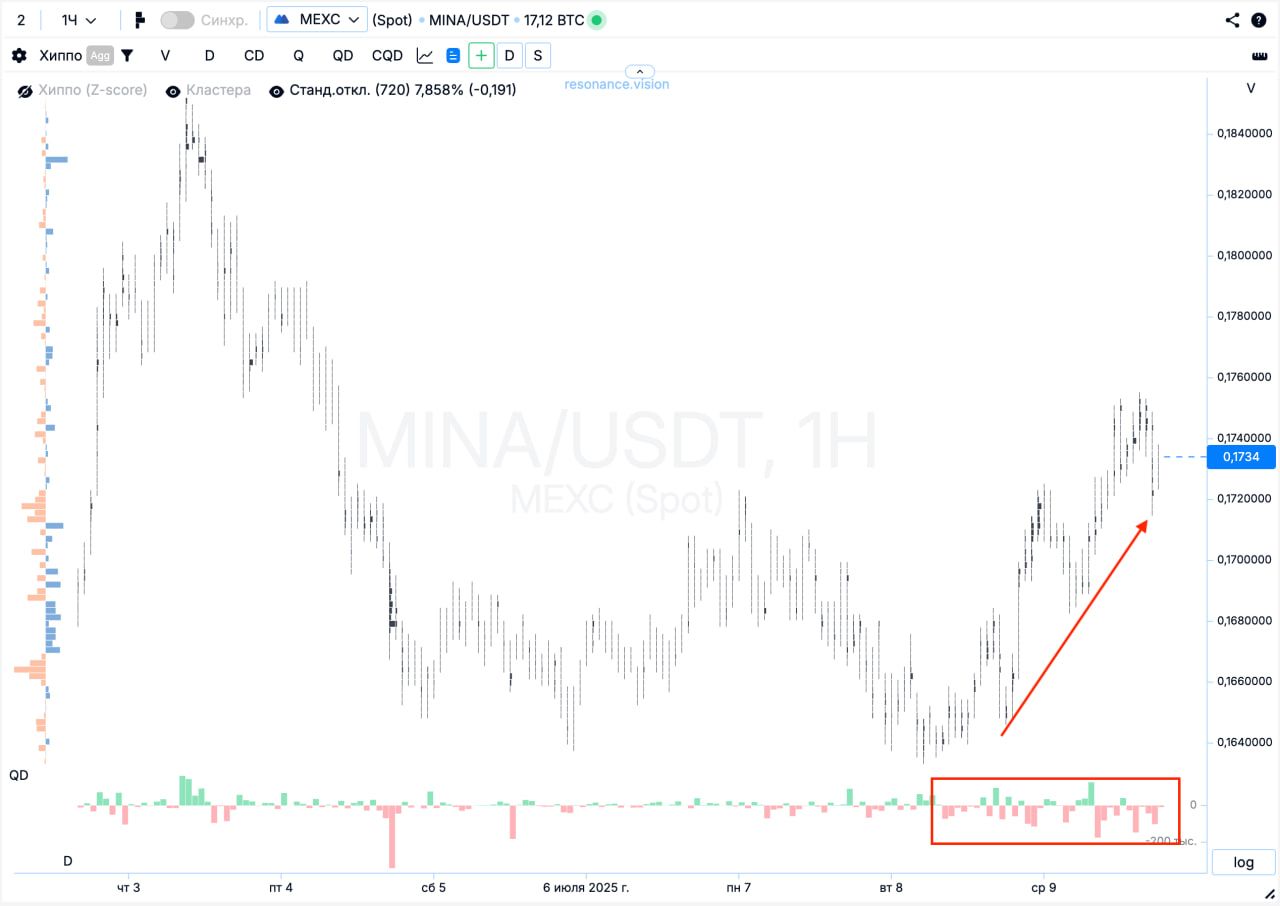
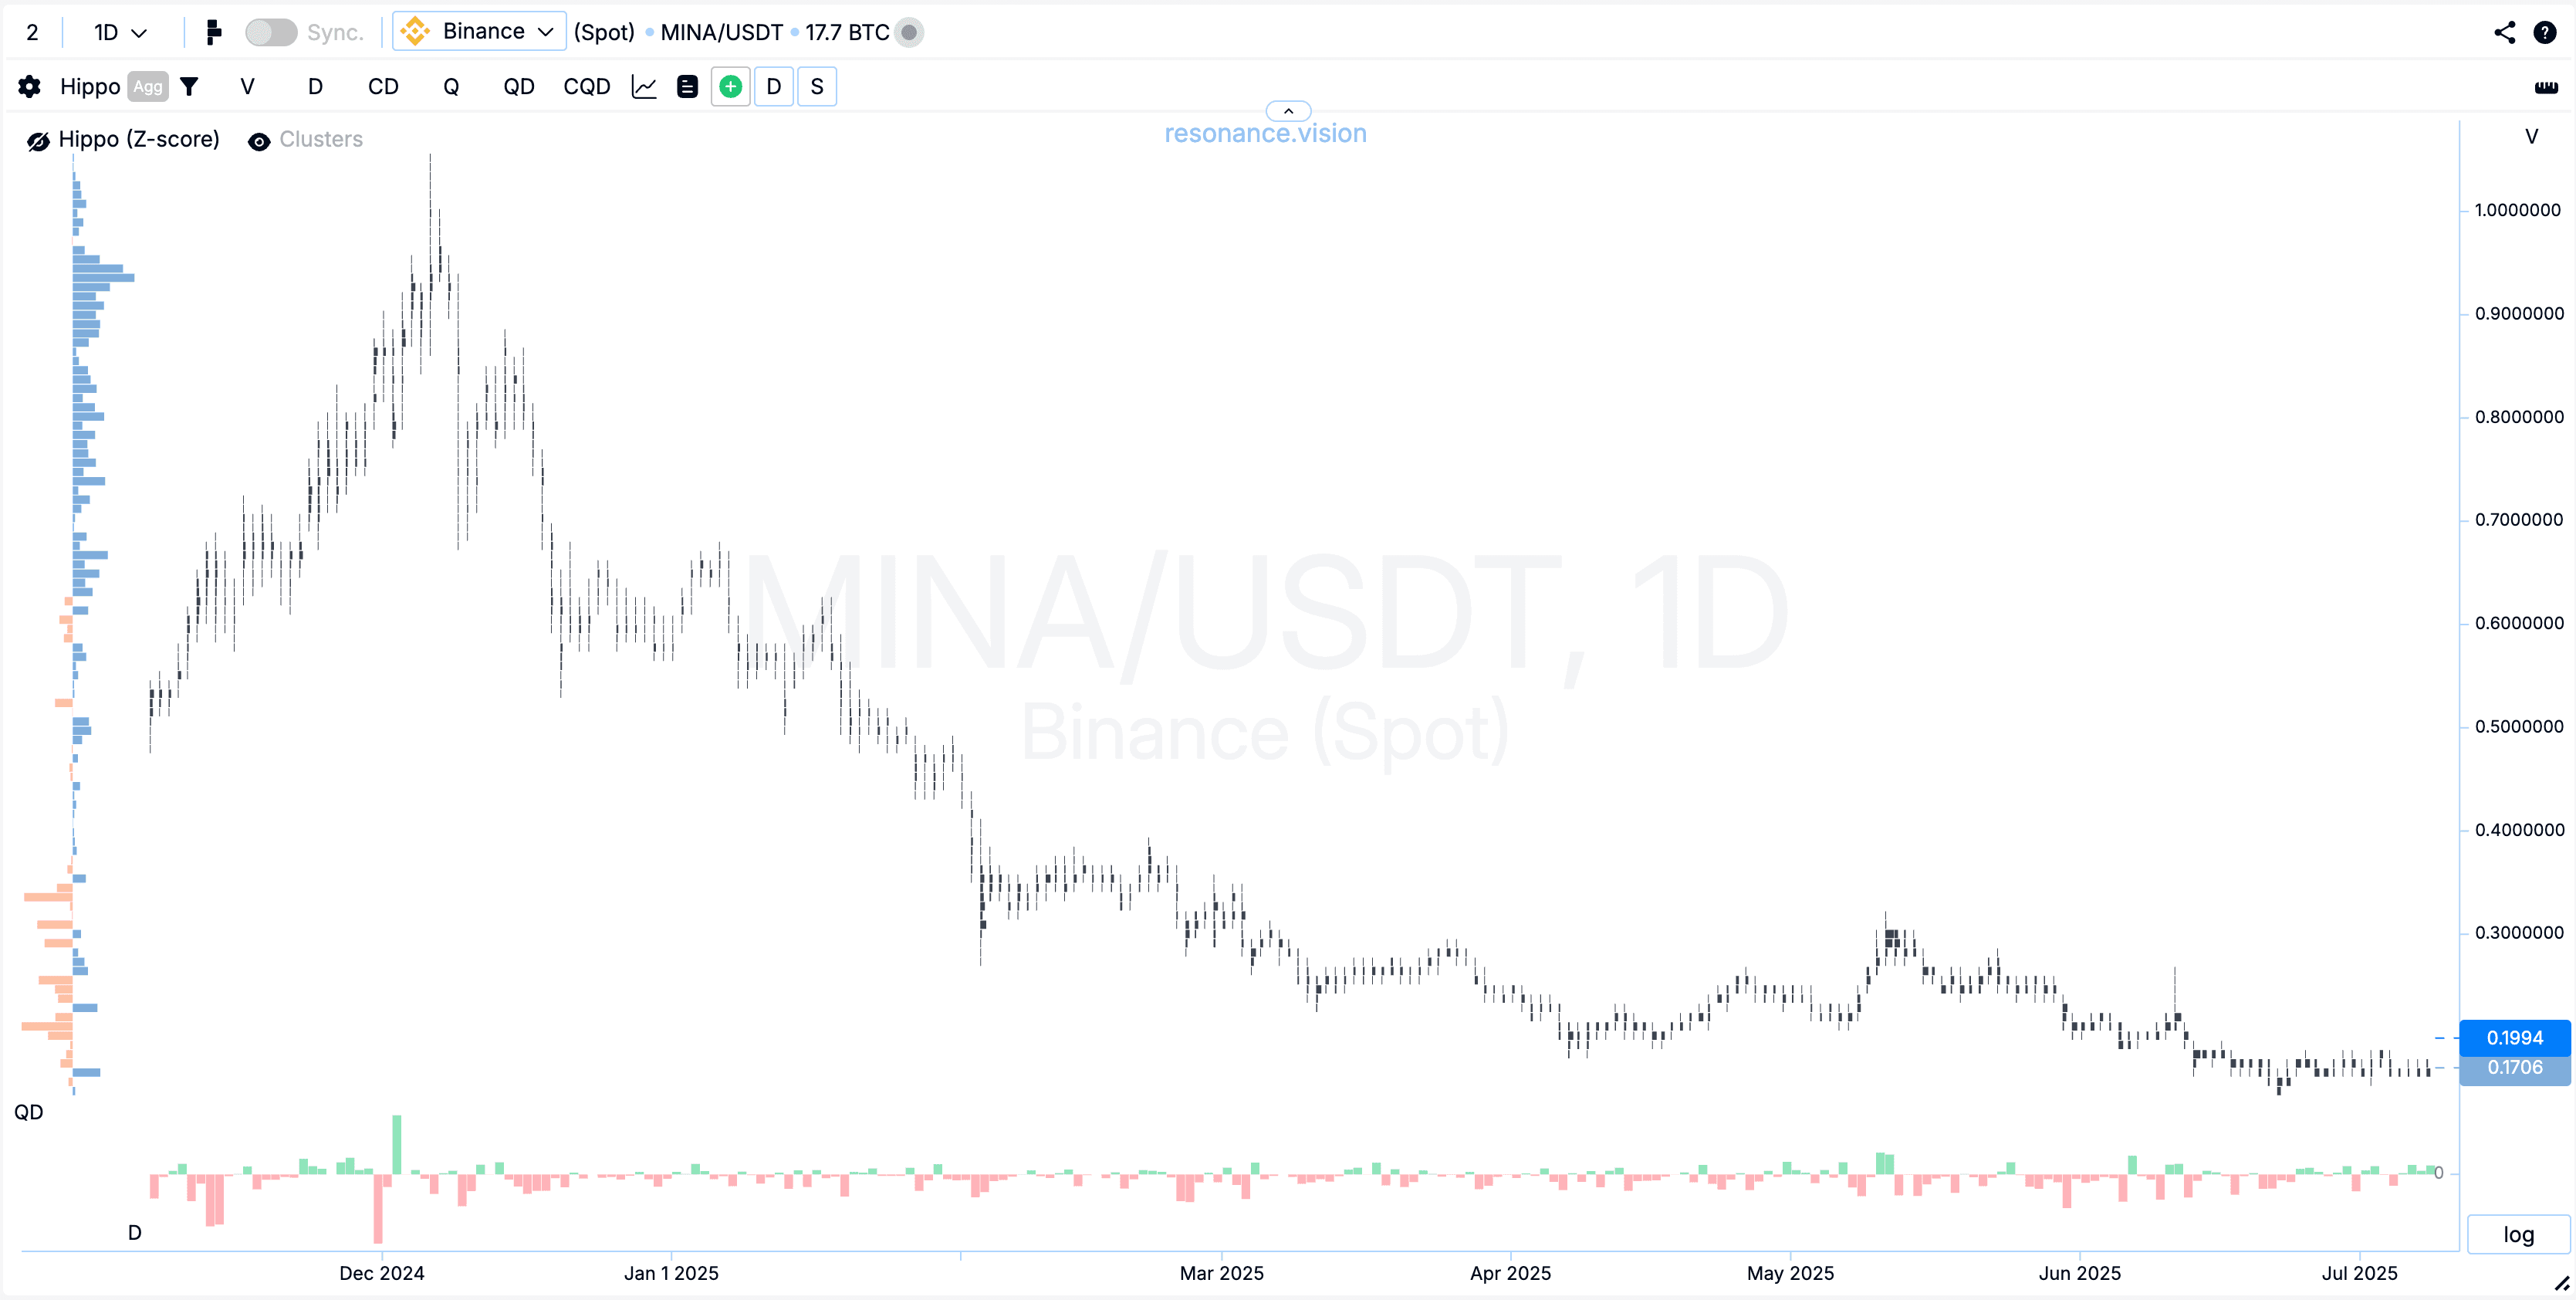
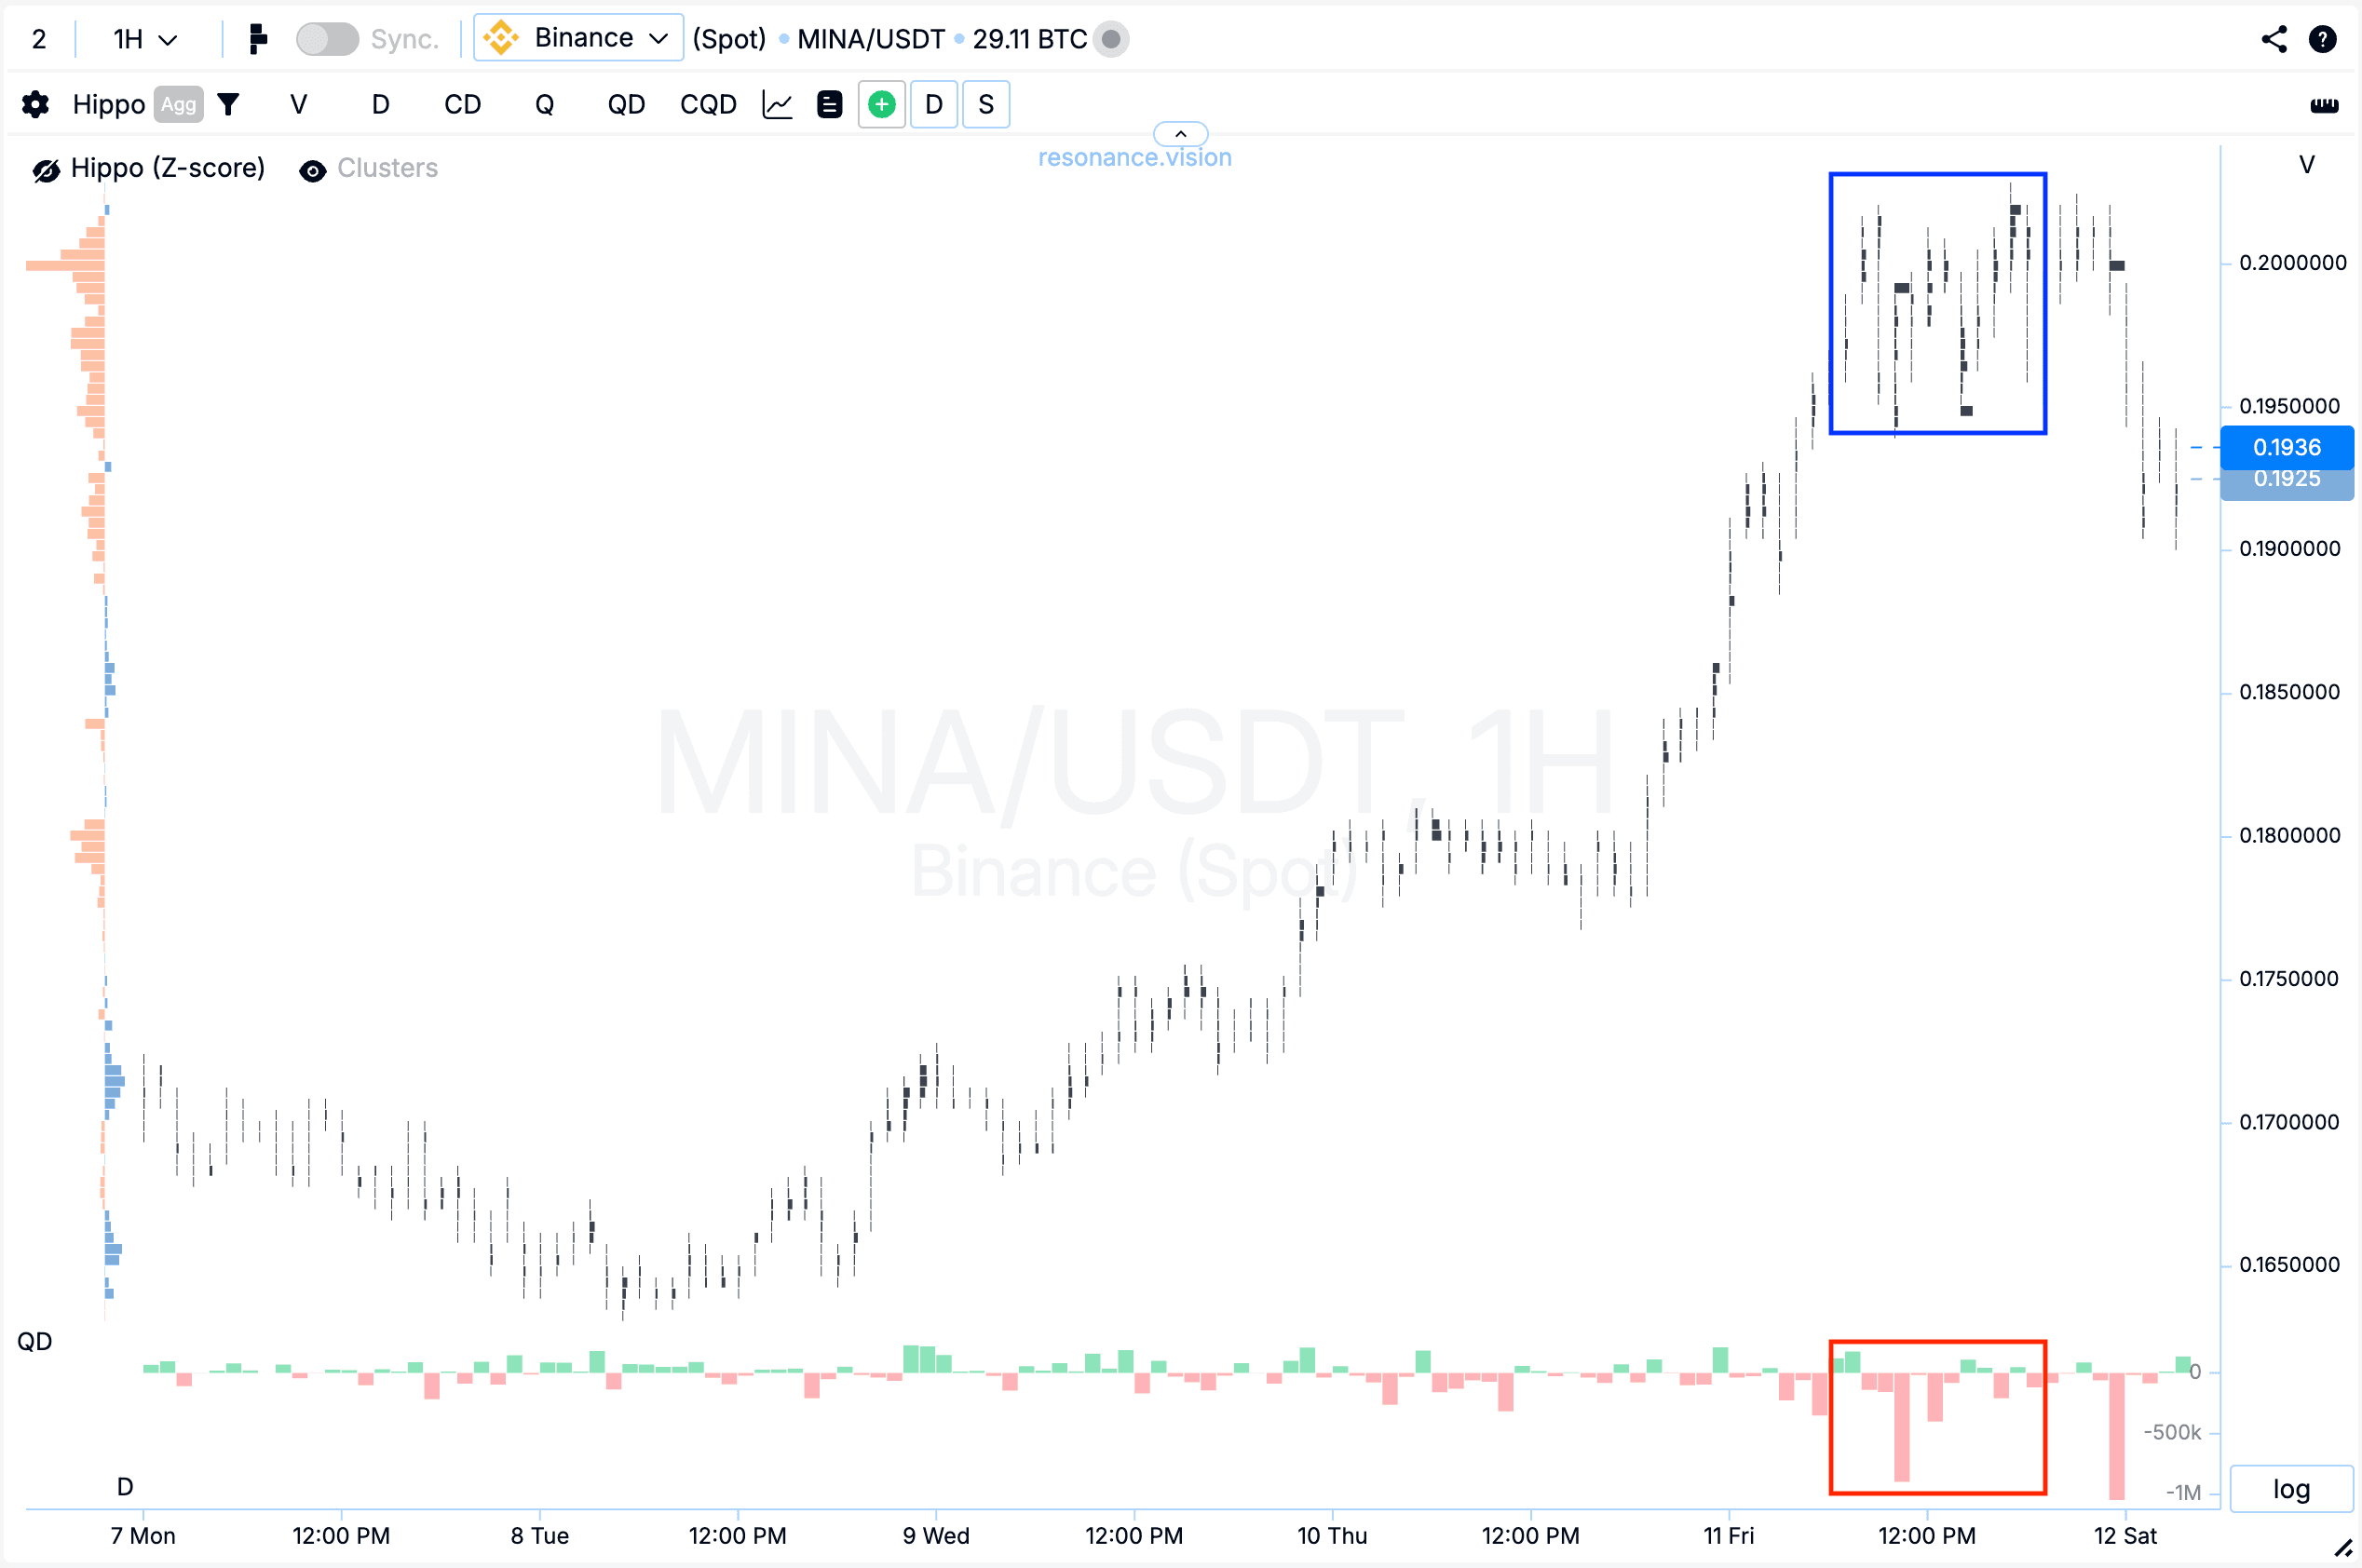
Кластерний графік: на денному таймфреймі видно, як довго ціна знижувалася на продажах. Але починаючи з травня ціна перестала падати, незважаючи на продовження ринкового продажу
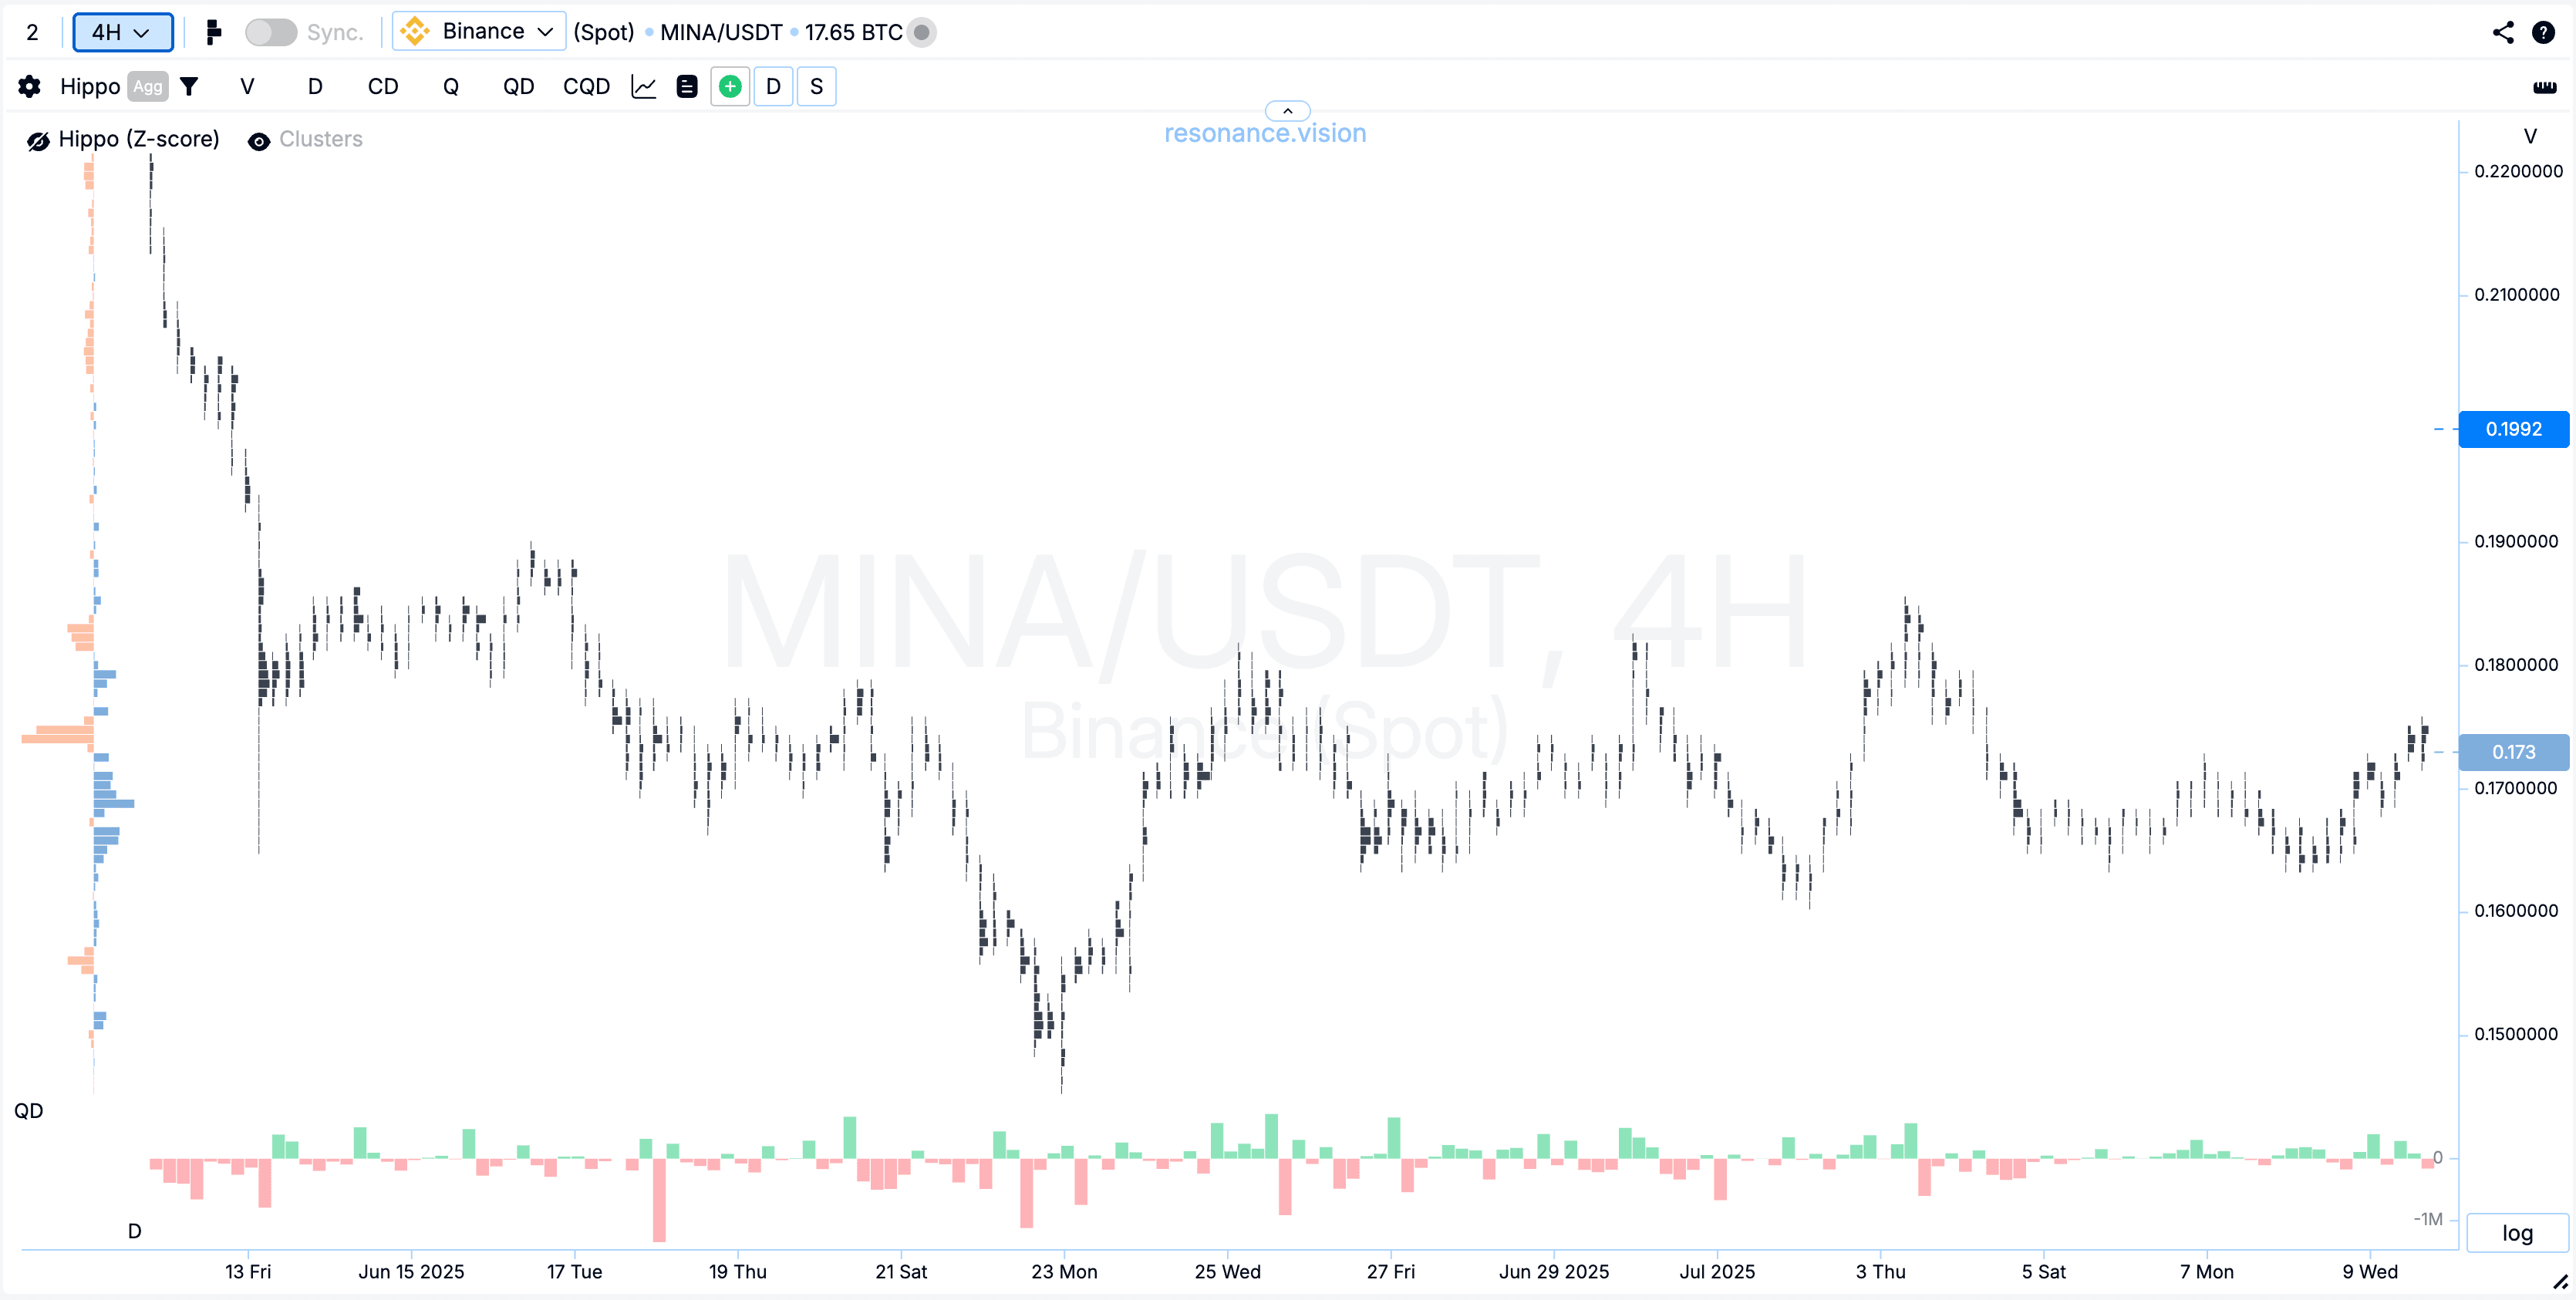
На меншому таймфреймі видно, що покупки трохи рухають ціну вище і вище.
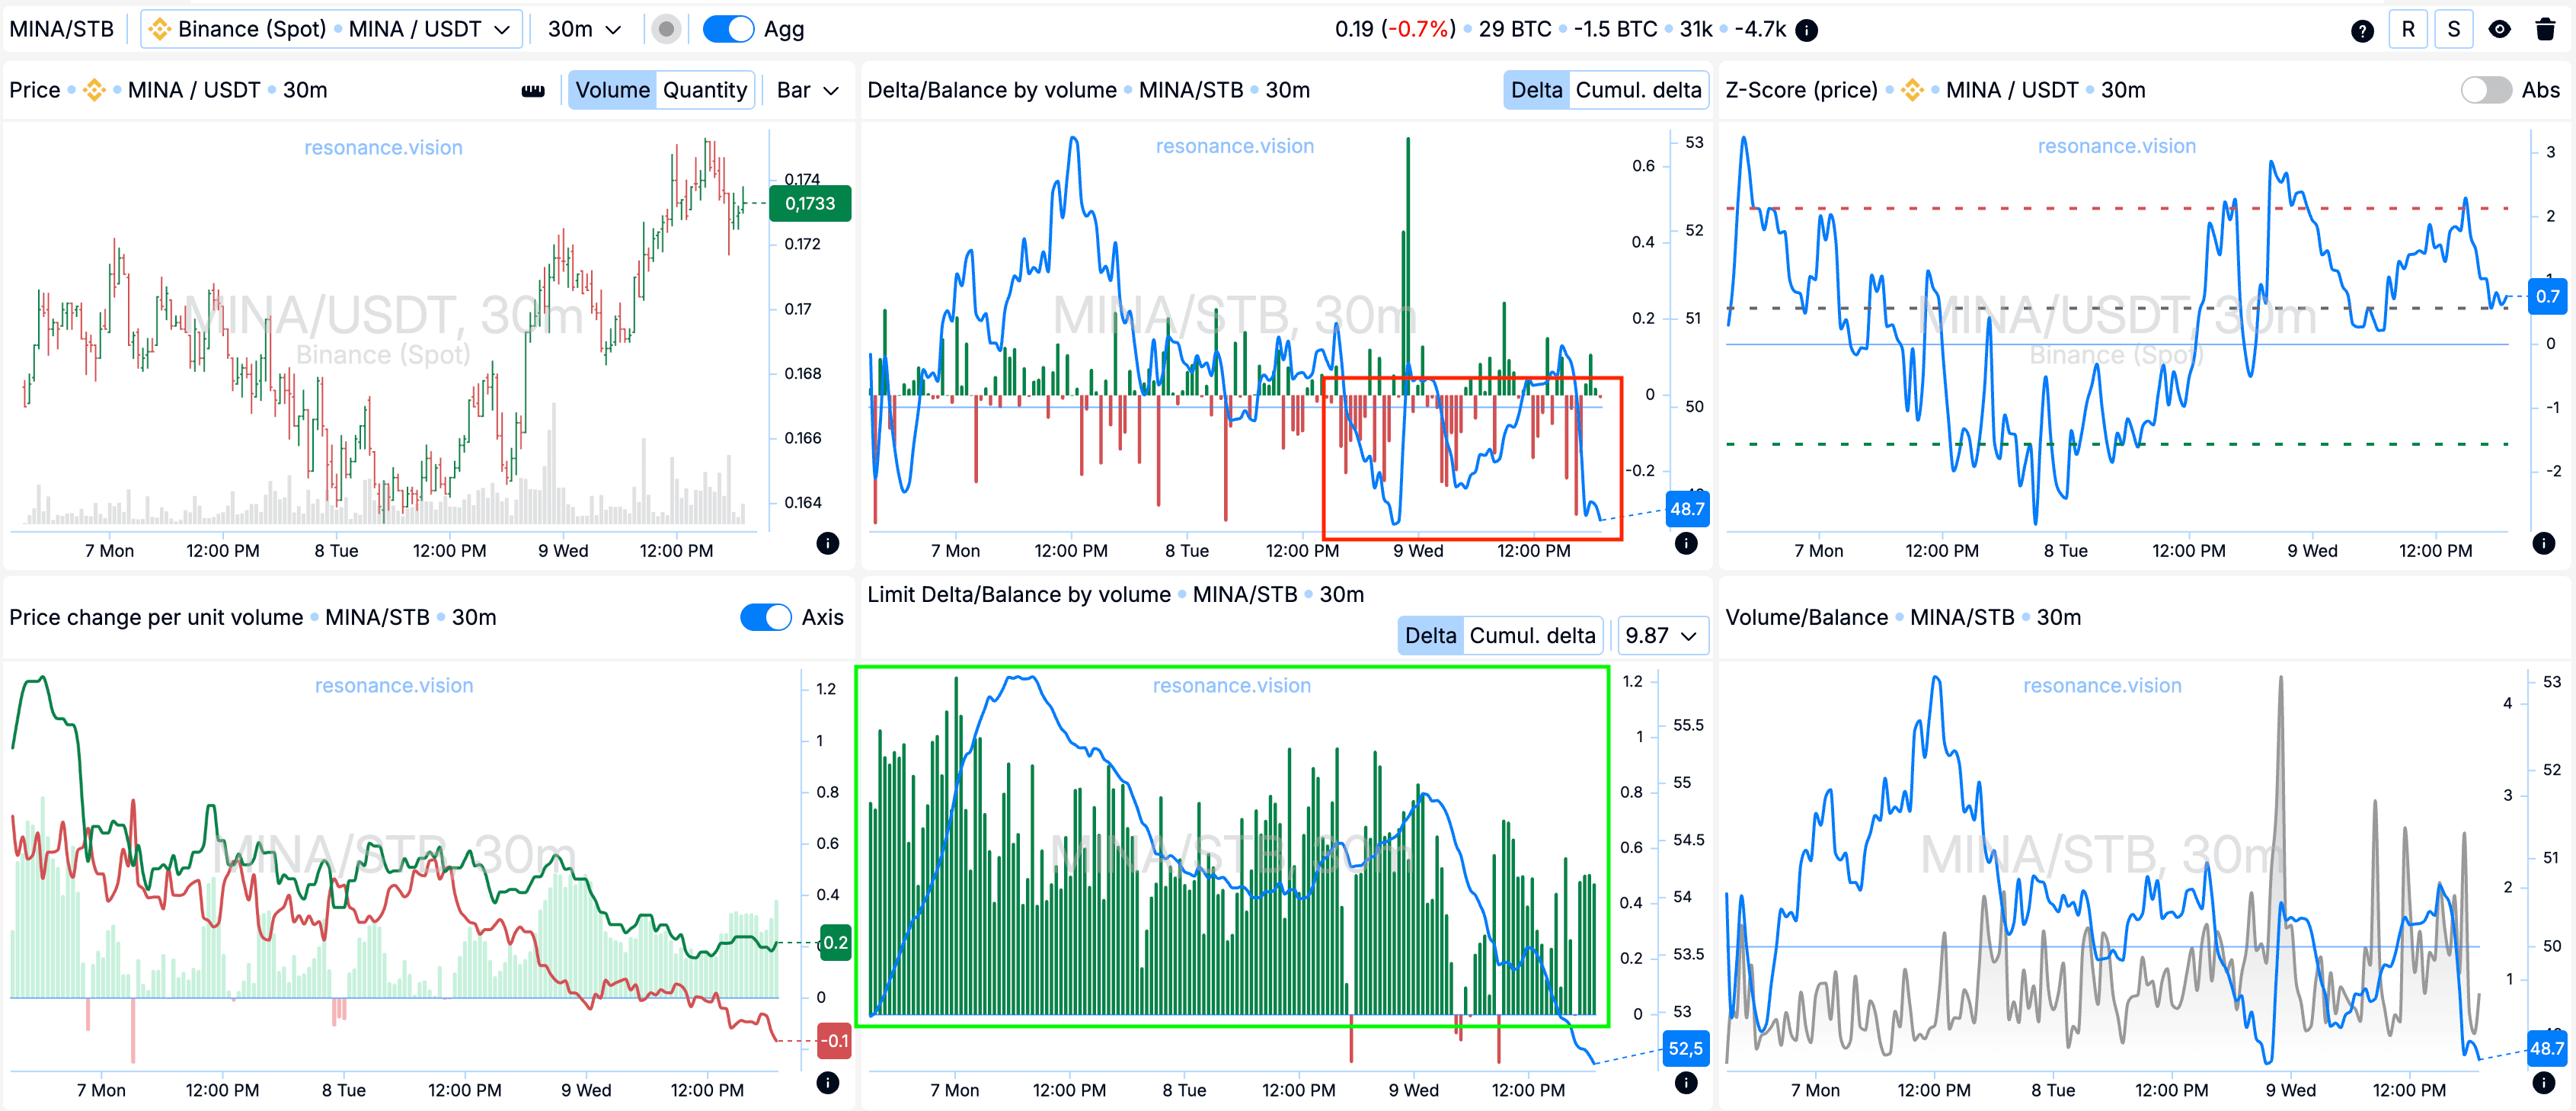
У Дешборді
Дельта/Баланс за обсягом та лімітна дельта: Згідно з агрегованими даними, переважають ринкові продажі і баланс продовжує знижуватися у бік продажів (червоний прямокутник). Однак за лімітними заявками спостерігається тривала активна підстановка ордерів на купівлю - це видно з позитивної динаміки на гістограмі дельти (зелений прямокутник).
Що в цілому підтверджує неефективність продажів, тому що при їх переважання ціна зростає, і потенційно лімітні заявки на покупку утримують обсяг маркетів продажів і підставляються все вище.
Причини виходу
Кластерний графік: Зауважив, що на зростанні в досить широкому діапазоні почали формуватися кластери за обсягом (синій прямокутник). Продажі в цей момент почали поступово зменшуватись (червоний прямокутник). Є невизначеність, що збільшує подальший ризик утримання. З цієї причини і було ухвалено рішення фіксувати позицію.
Управління позицією
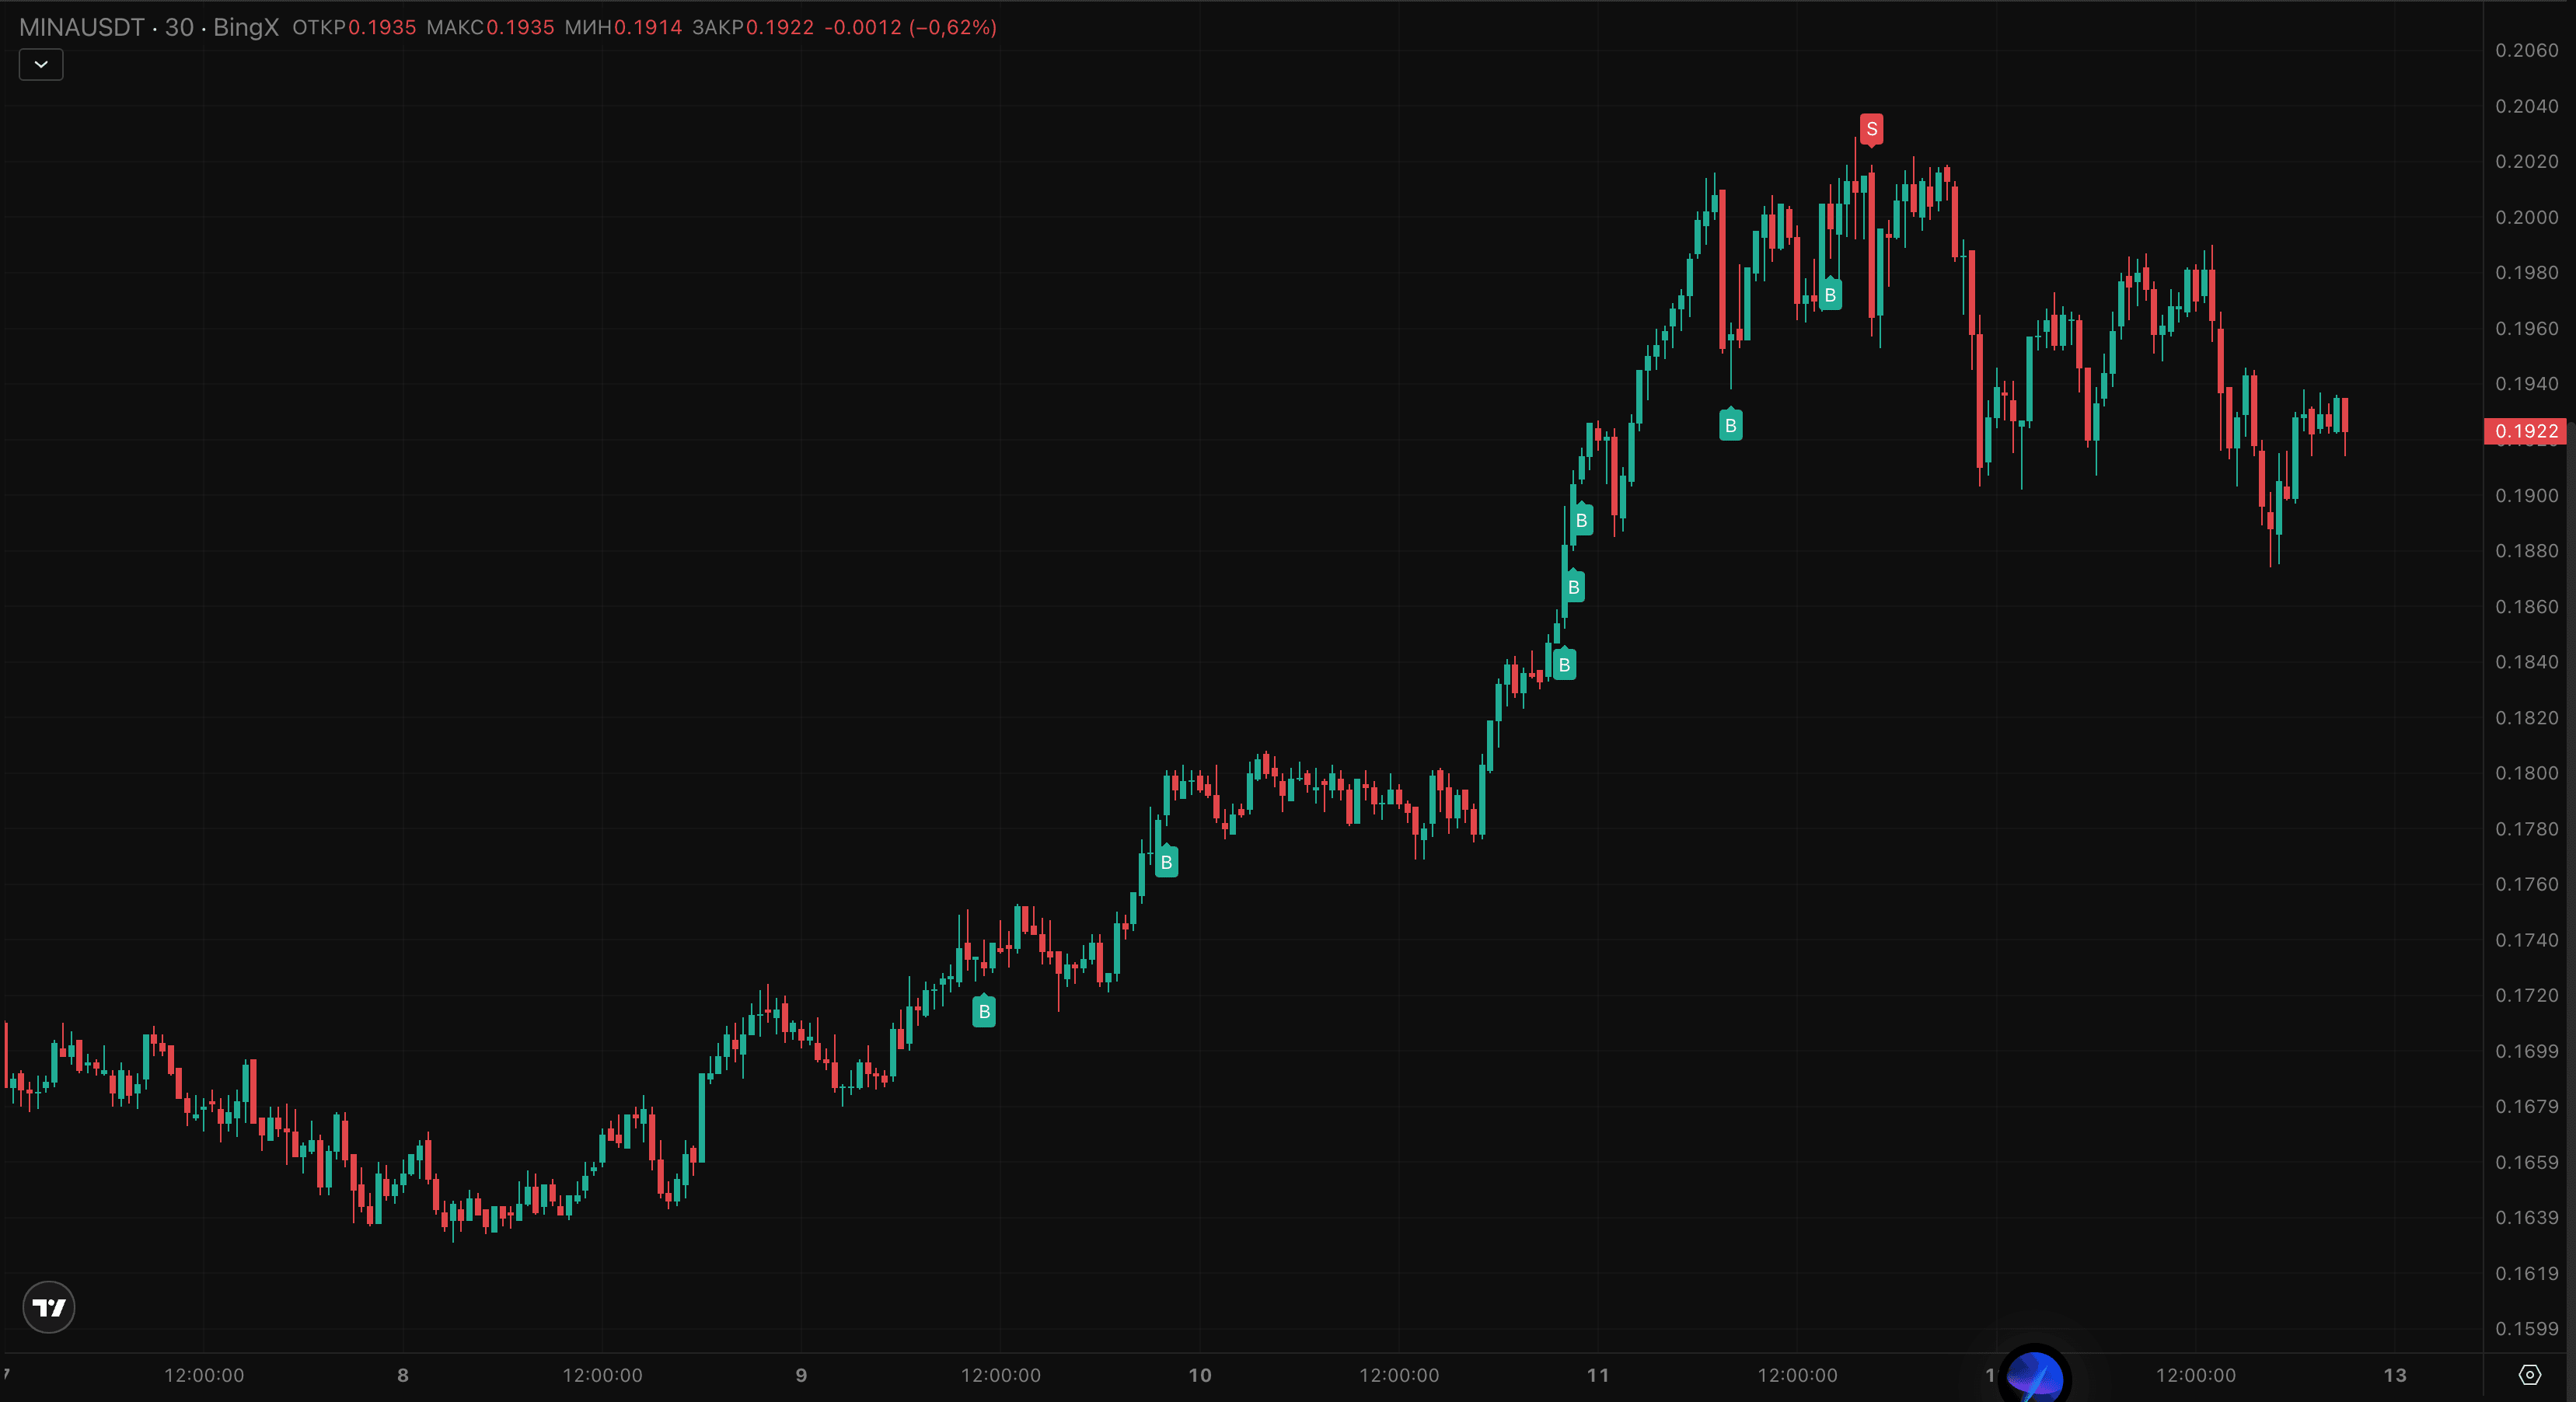
Ця позиція дала хороший результат — під час її утримання було зроблено шість доборів, що видно на скріншоті. Кожен добір посилював спільну позицію та дозволив ефективно відпрацювати ідею.
Такий підхід з послідовними доборами виявився виправданим на тлі активності покупців і неефективних продажів, що зберігається.
Підсумок
Вдалося зафіксувати прибуток у розмірі +92,22%. Звертаю увагу: через серію доборів ціна на скріншоті – усереднена точка входу.
У перерахунку на ризик/прибуток угода принесла співвідношення:
1 до 3 у ціновому русі
1 до 6 у грошах (початковий ризик / підсумковий прибуток)
Висновок
Цей трейд по MINA – чудовий приклад того, як комбінація кластерного аналізу та читання агрегованих даних допомагає побачити те, що не видно на свічковому графіку. Незважаючи на переважання продажів, ринок показав стійкість — а лімітні заявки покупців виступили в ролі підтримки, що дало змогу не лише увійти, а й посилювати позицію з підтвердженням сценарію.
Важливо: навіть за низького ризику та хорошого входу — фінальне рішення про фіксацію прибутку було ухвалено на тлі невизначеності. Це і є дисципліна: не чекати на чудеса, а забирати результат, коли ринок подає сигнали на можливий розворот.
Такий розбір — не просто звіт, а й навчальний приклад, як працювати з позицією від ідеї до результату.
Стеж за новими статтями у нашому телеграм каналі.
Не треба вигадувати складних схем та шукати “грааль”. Використовуйте інструменти платформи Resonance.
Реєструйся за посиланням - отримуй бонус і починай заробляти:
OKX | BingX | KuCoin.
Промокод TOPBLOG дає тобі 10% знижки на будь-який тарифний план Resonance.
Рекомендовані статті


