MIRA +62.4% (Напрямкова стратегія Резонанс)

У аналізі показано, як на фоні домінування маркет-продажів ціна перестає знижуватися, формуючи ознаки локального дефіциту. Аналіз реакції ціни на об’єми, агрегованих даних та ефективності ордерів дозволив об’єктивно визначити точку входу та своєчасно зафіксувати рух.
Зміст

Монета: MIRA/USDT
Ризик: високий
Рівень розуміння: новачок
Причини входу
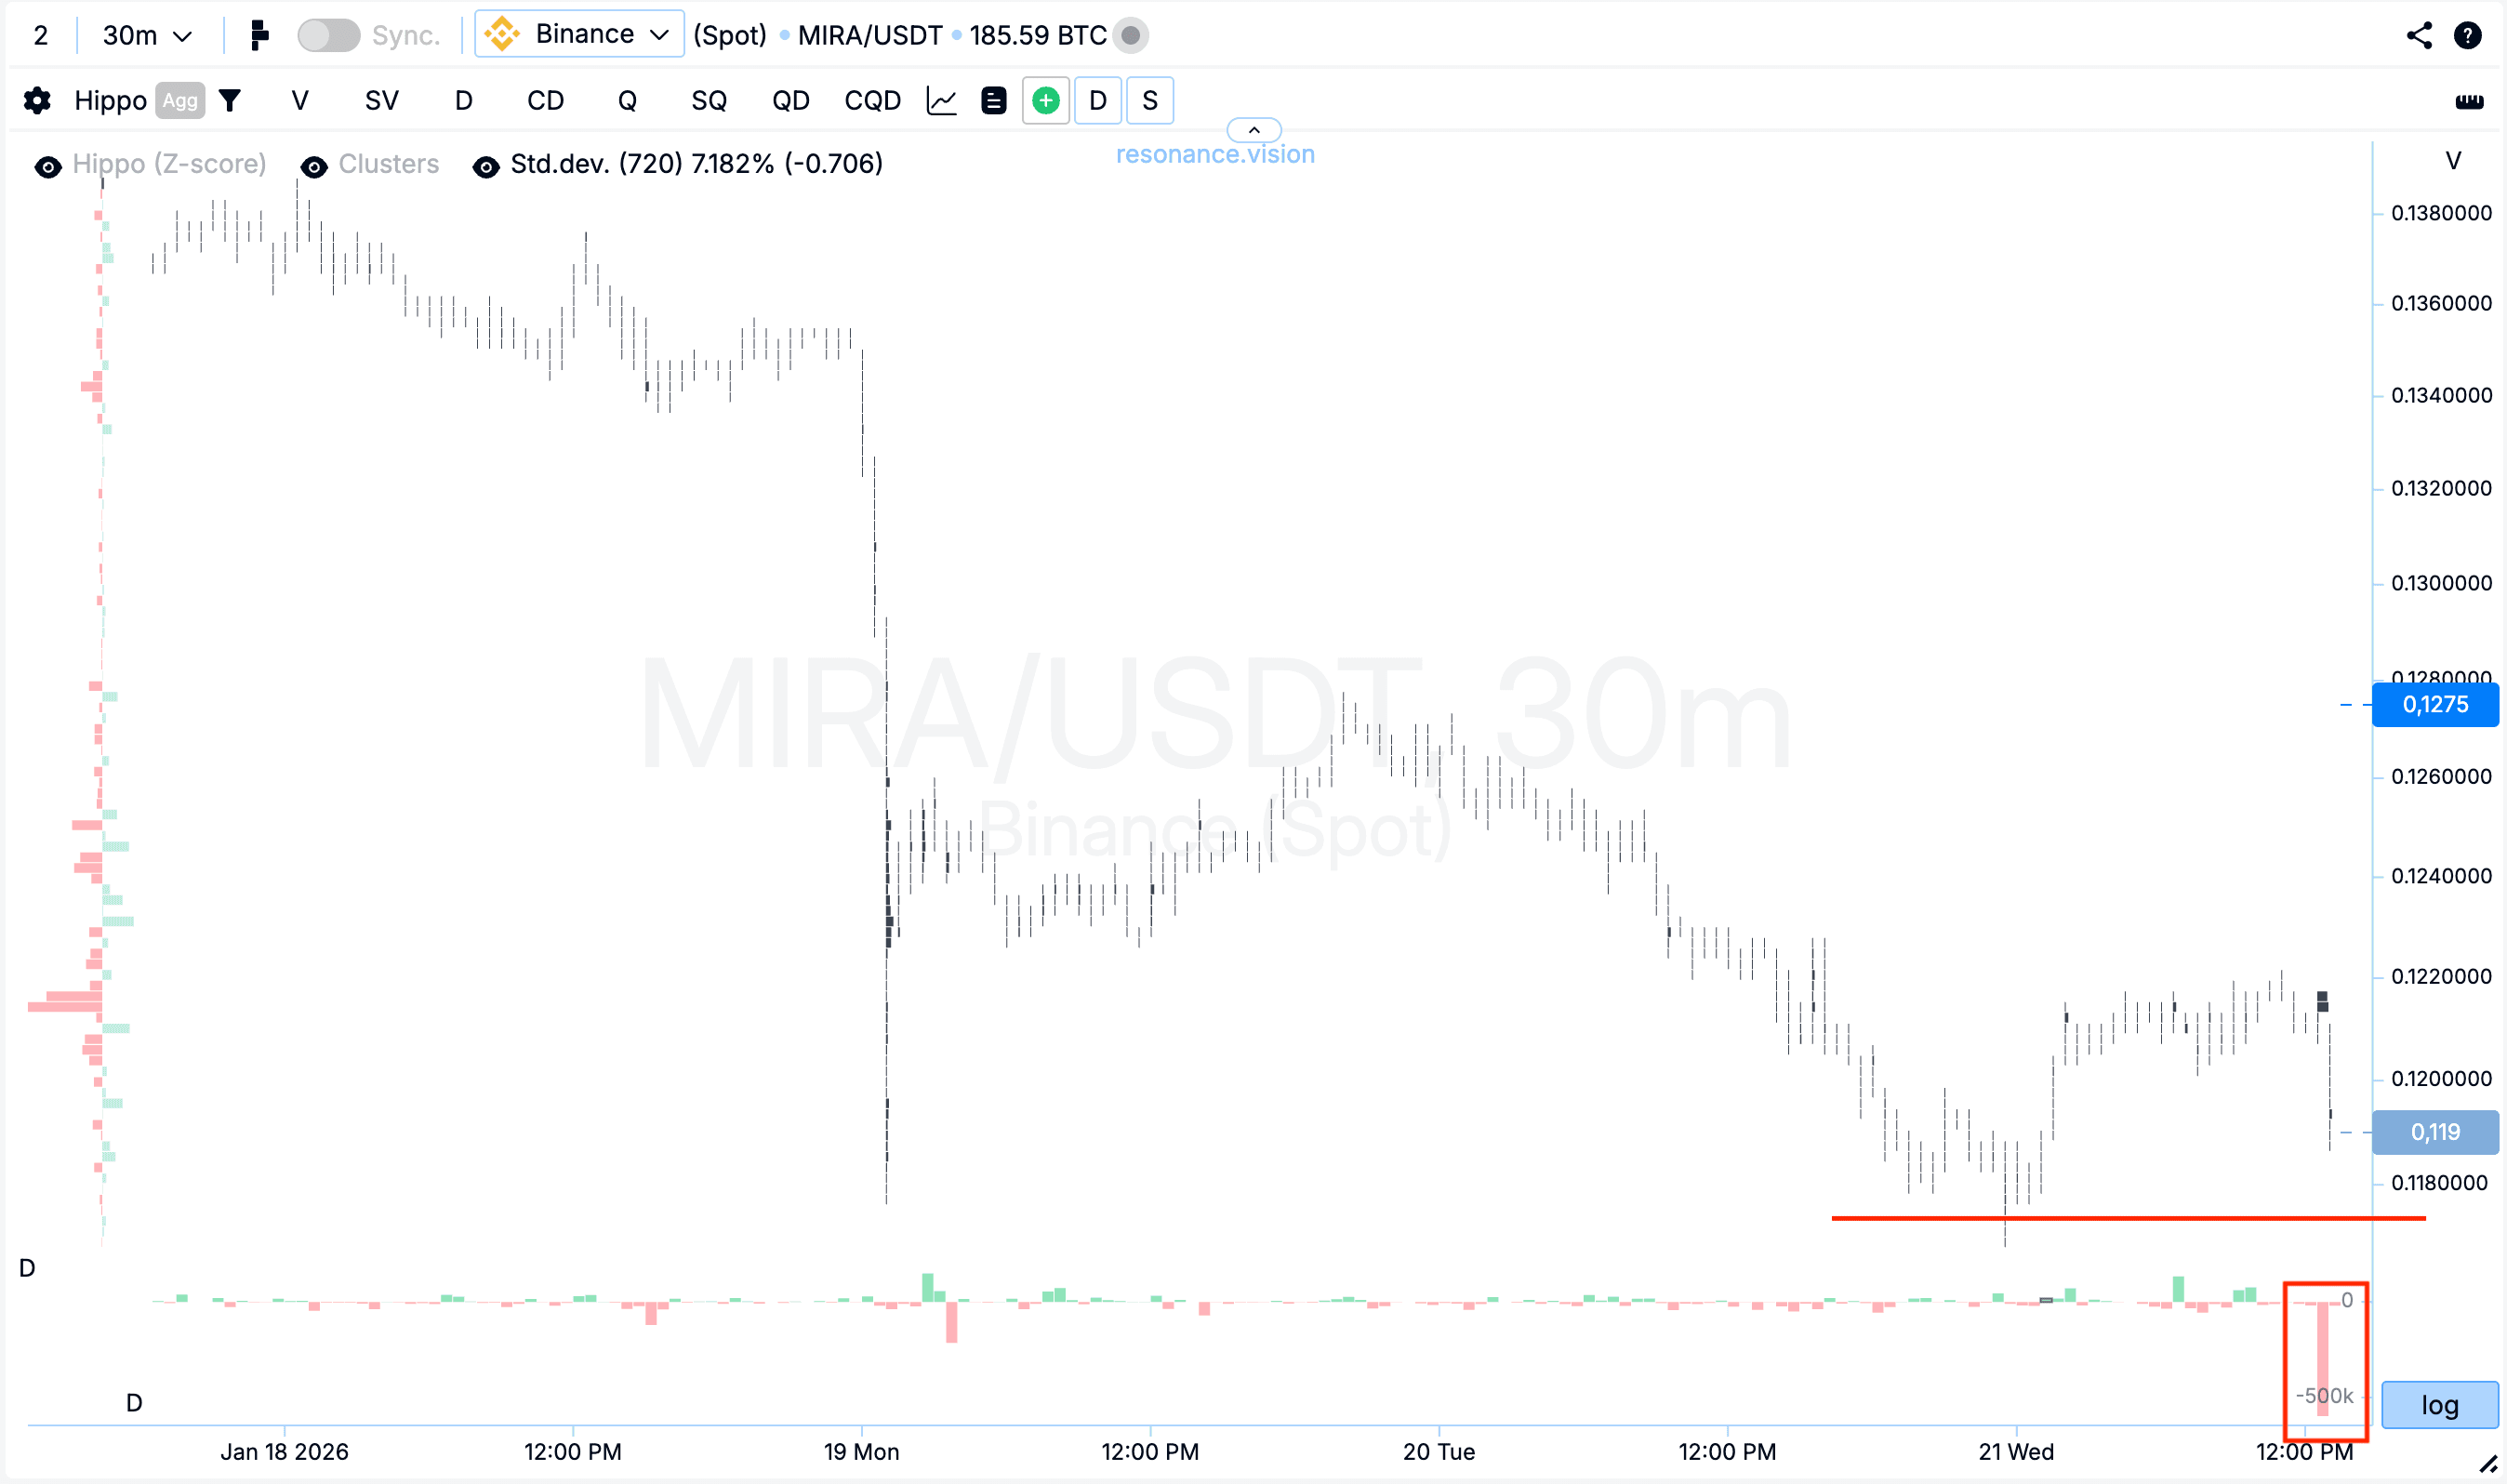
Кластерний графік: після імпульсного зниження ціна перейшла в бічне проторгування, де почали проходити суттєві об’єми маркет-ордерів на продаж (червоний прямокутник). Однак, незважаючи на такий тиск, їхня ефективність помітно знизилася - ціні не вдалося оновити локальний мінімум (червона лінія).
Така реакція вказує на формування ознак локального дефіциту з боку продавців та послаблення їхньої ініціативи. Коли значні об’єми продажу перестають призводити до зниження ціни, це часто стає першим сигналом до можливої зміни ініціативи або локального розвороту.
У Дешборді
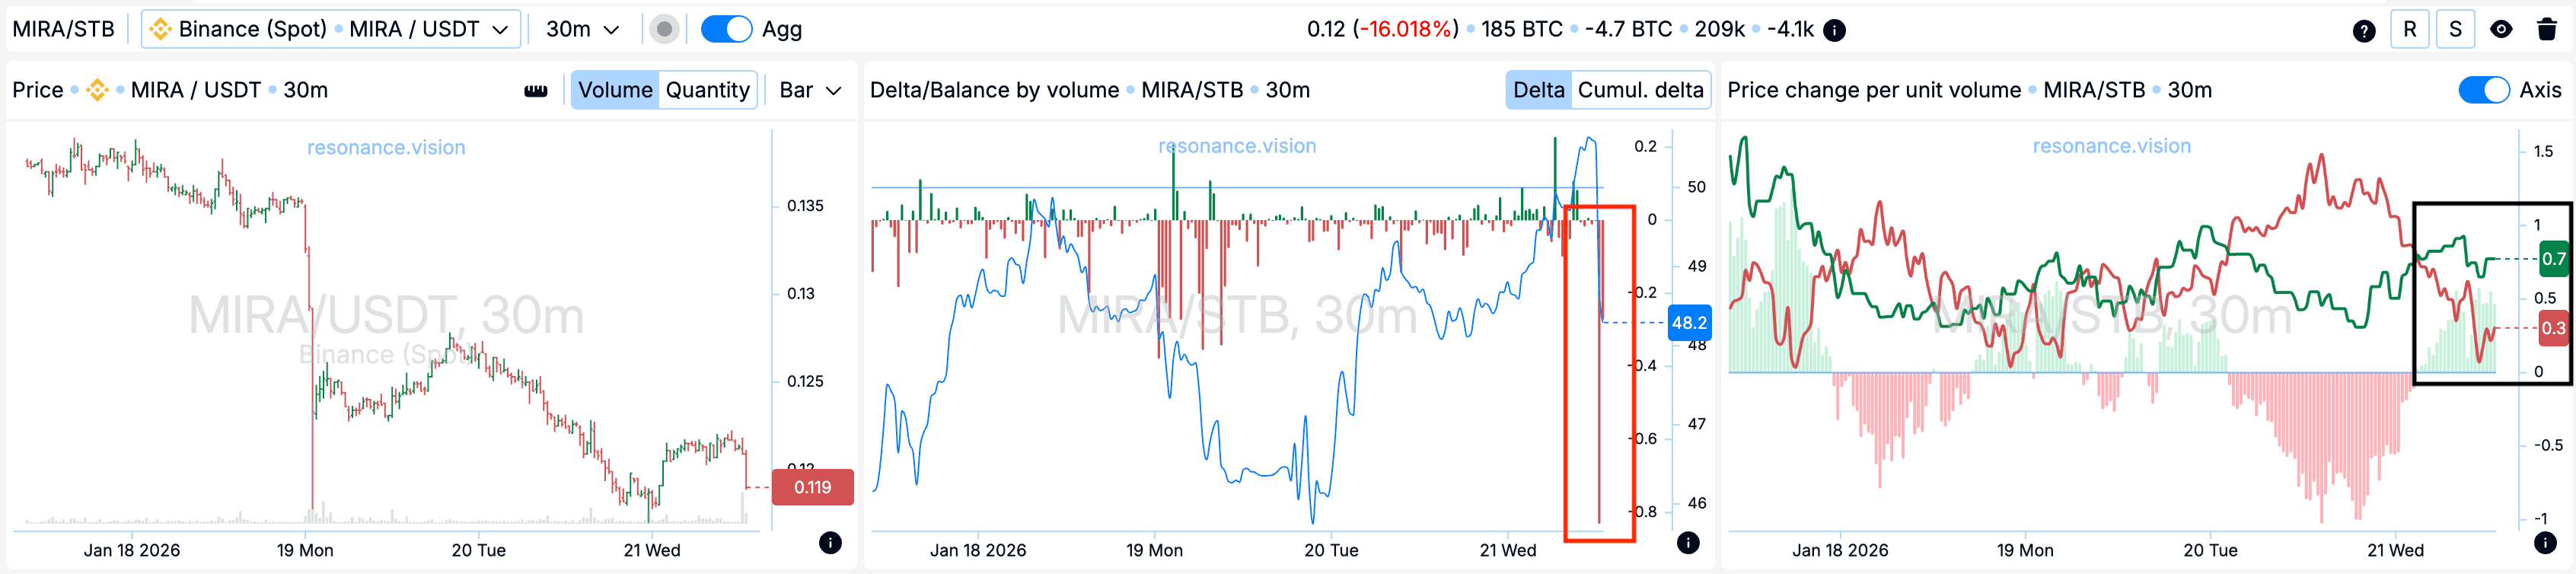
Дельта / Баланс за об’ємом: агреговані дані з усіх пар і бірж повністю підтверджують спостереження з кластерного графіка. У період, що розглядається, ринок перебував під вираженим тиском маркет-продажів, що виразно видно по гістограмі дельти (червоний прямокутник).
При цьому відсутність реакції ціни на даний об’єм вказує на активне поглинання всього ринкового об’єму, що входить, лімітними заявками на покупку. Така реакція формує локальну підтримку у поточному ціновому діапазоні.
Зміна ціни на одиницю об’єму: додатково видно, що ефективність впливу ринкових ордерів почала зміщуватися на користь покупців (чорний прямокутник). Для руху ціни вгору потрібно менший об’єм, ніж її зниження, що підтверджує ослаблення тиску із боку продавців.
Причини виходу
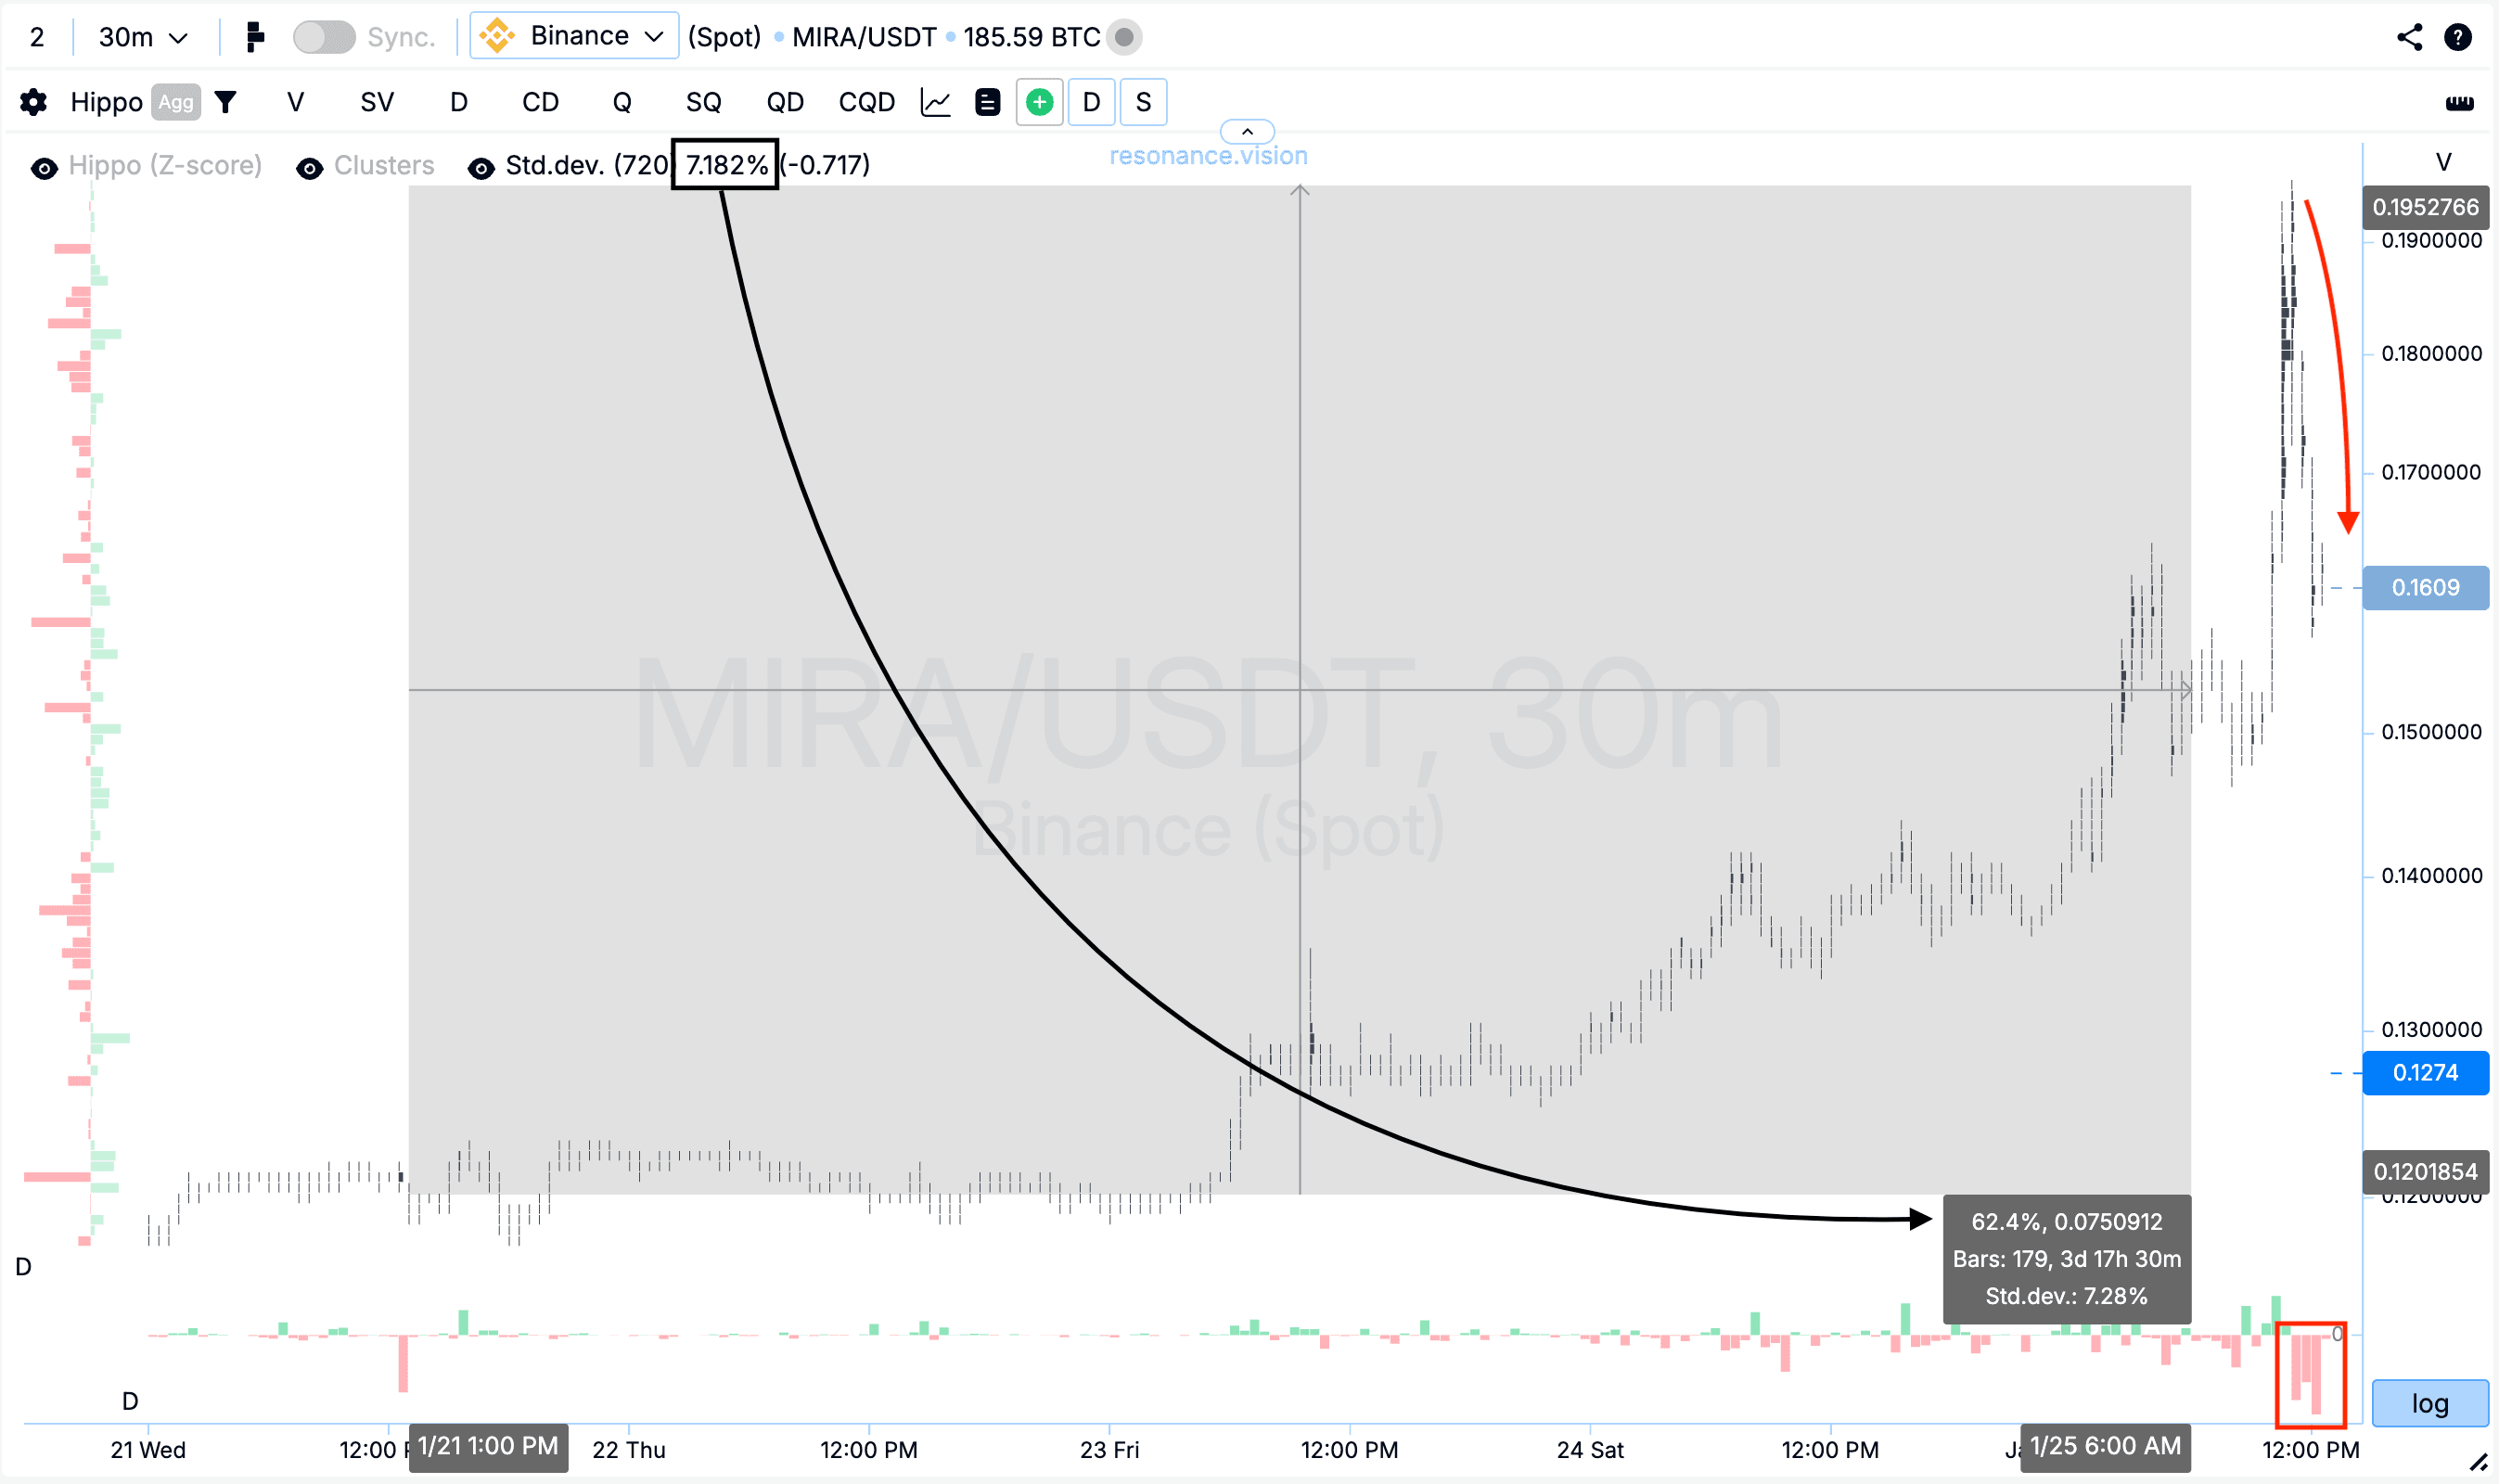
Кластерний графік: від точки входу ціна пройшла більше 60%, що відповідає понад вісім стандартних цінових рухів (чорний прямокутник та стрілка). На цьому фоні помітно зросла волатильність, сформувався суттєвий відкат (червоний прямокутник та стрілка), а також почали переважати маркет-продаж, що вказує на перехоплення ініціативи продавцями.
З високою ймовірністю ринок перейшов у фазу пошуку балансу. У таких умовах подальше утримання позиції призводило б до зростання ризику, тому фіксація прибутку виглядає найбільш виваженим та раціональним рішенням.
Висновок
Даний аналіз добре показує, що ключовим фактором у роботі з об’ємами є не сам факт їх появи, а реакція ціни на ці об’єми. Незважаючи на домінування маркет-продажів, ціна перестала оновлювати мінімуми, що вказувало на зниження ефективності продавців та формування локального дефіциту.
Подібні ситуації на ринку виникають досить часто, проте стійкі рухи вдається забирати саме тоді, коли об’єм підтверджується поведінкою ціни. Оцінка ефективності ринкових ордерів, у поєднанні з агрегованими даними та статистичними відхиленнями, дозволяє діяти об’єктивно та приймати виважені торговельні рішення без опори на очікування та прогнози.
Стеж за новими статтями у нашому телеграм каналі.
Не треба вигадувати складних схем та шукати “грааль”. Використовуйте інструменти платформи Resonance.
Реєструйся за посиланням - отримуй бонус і починай заробляти:
OKX | BingX | KuCoin.
Промокод TOPBLOG дає тобі 10% знижки на будь-який тарифний план Resonance.
Рекомендовані статті


