NIL +44.3% (Resonance Directional Strategy)

A breakdown of the NIL/USDT trade: why the entry was based on weakening sellers and increasing buying efficiency, and how a combination of clusters, aggregated data, and their impact on price allowed for a timely lock-in after a strong move.
Table of contents

Coin: NIL/USDT
Risk: Medium
Understanding level: Beginner
Entry Reasons
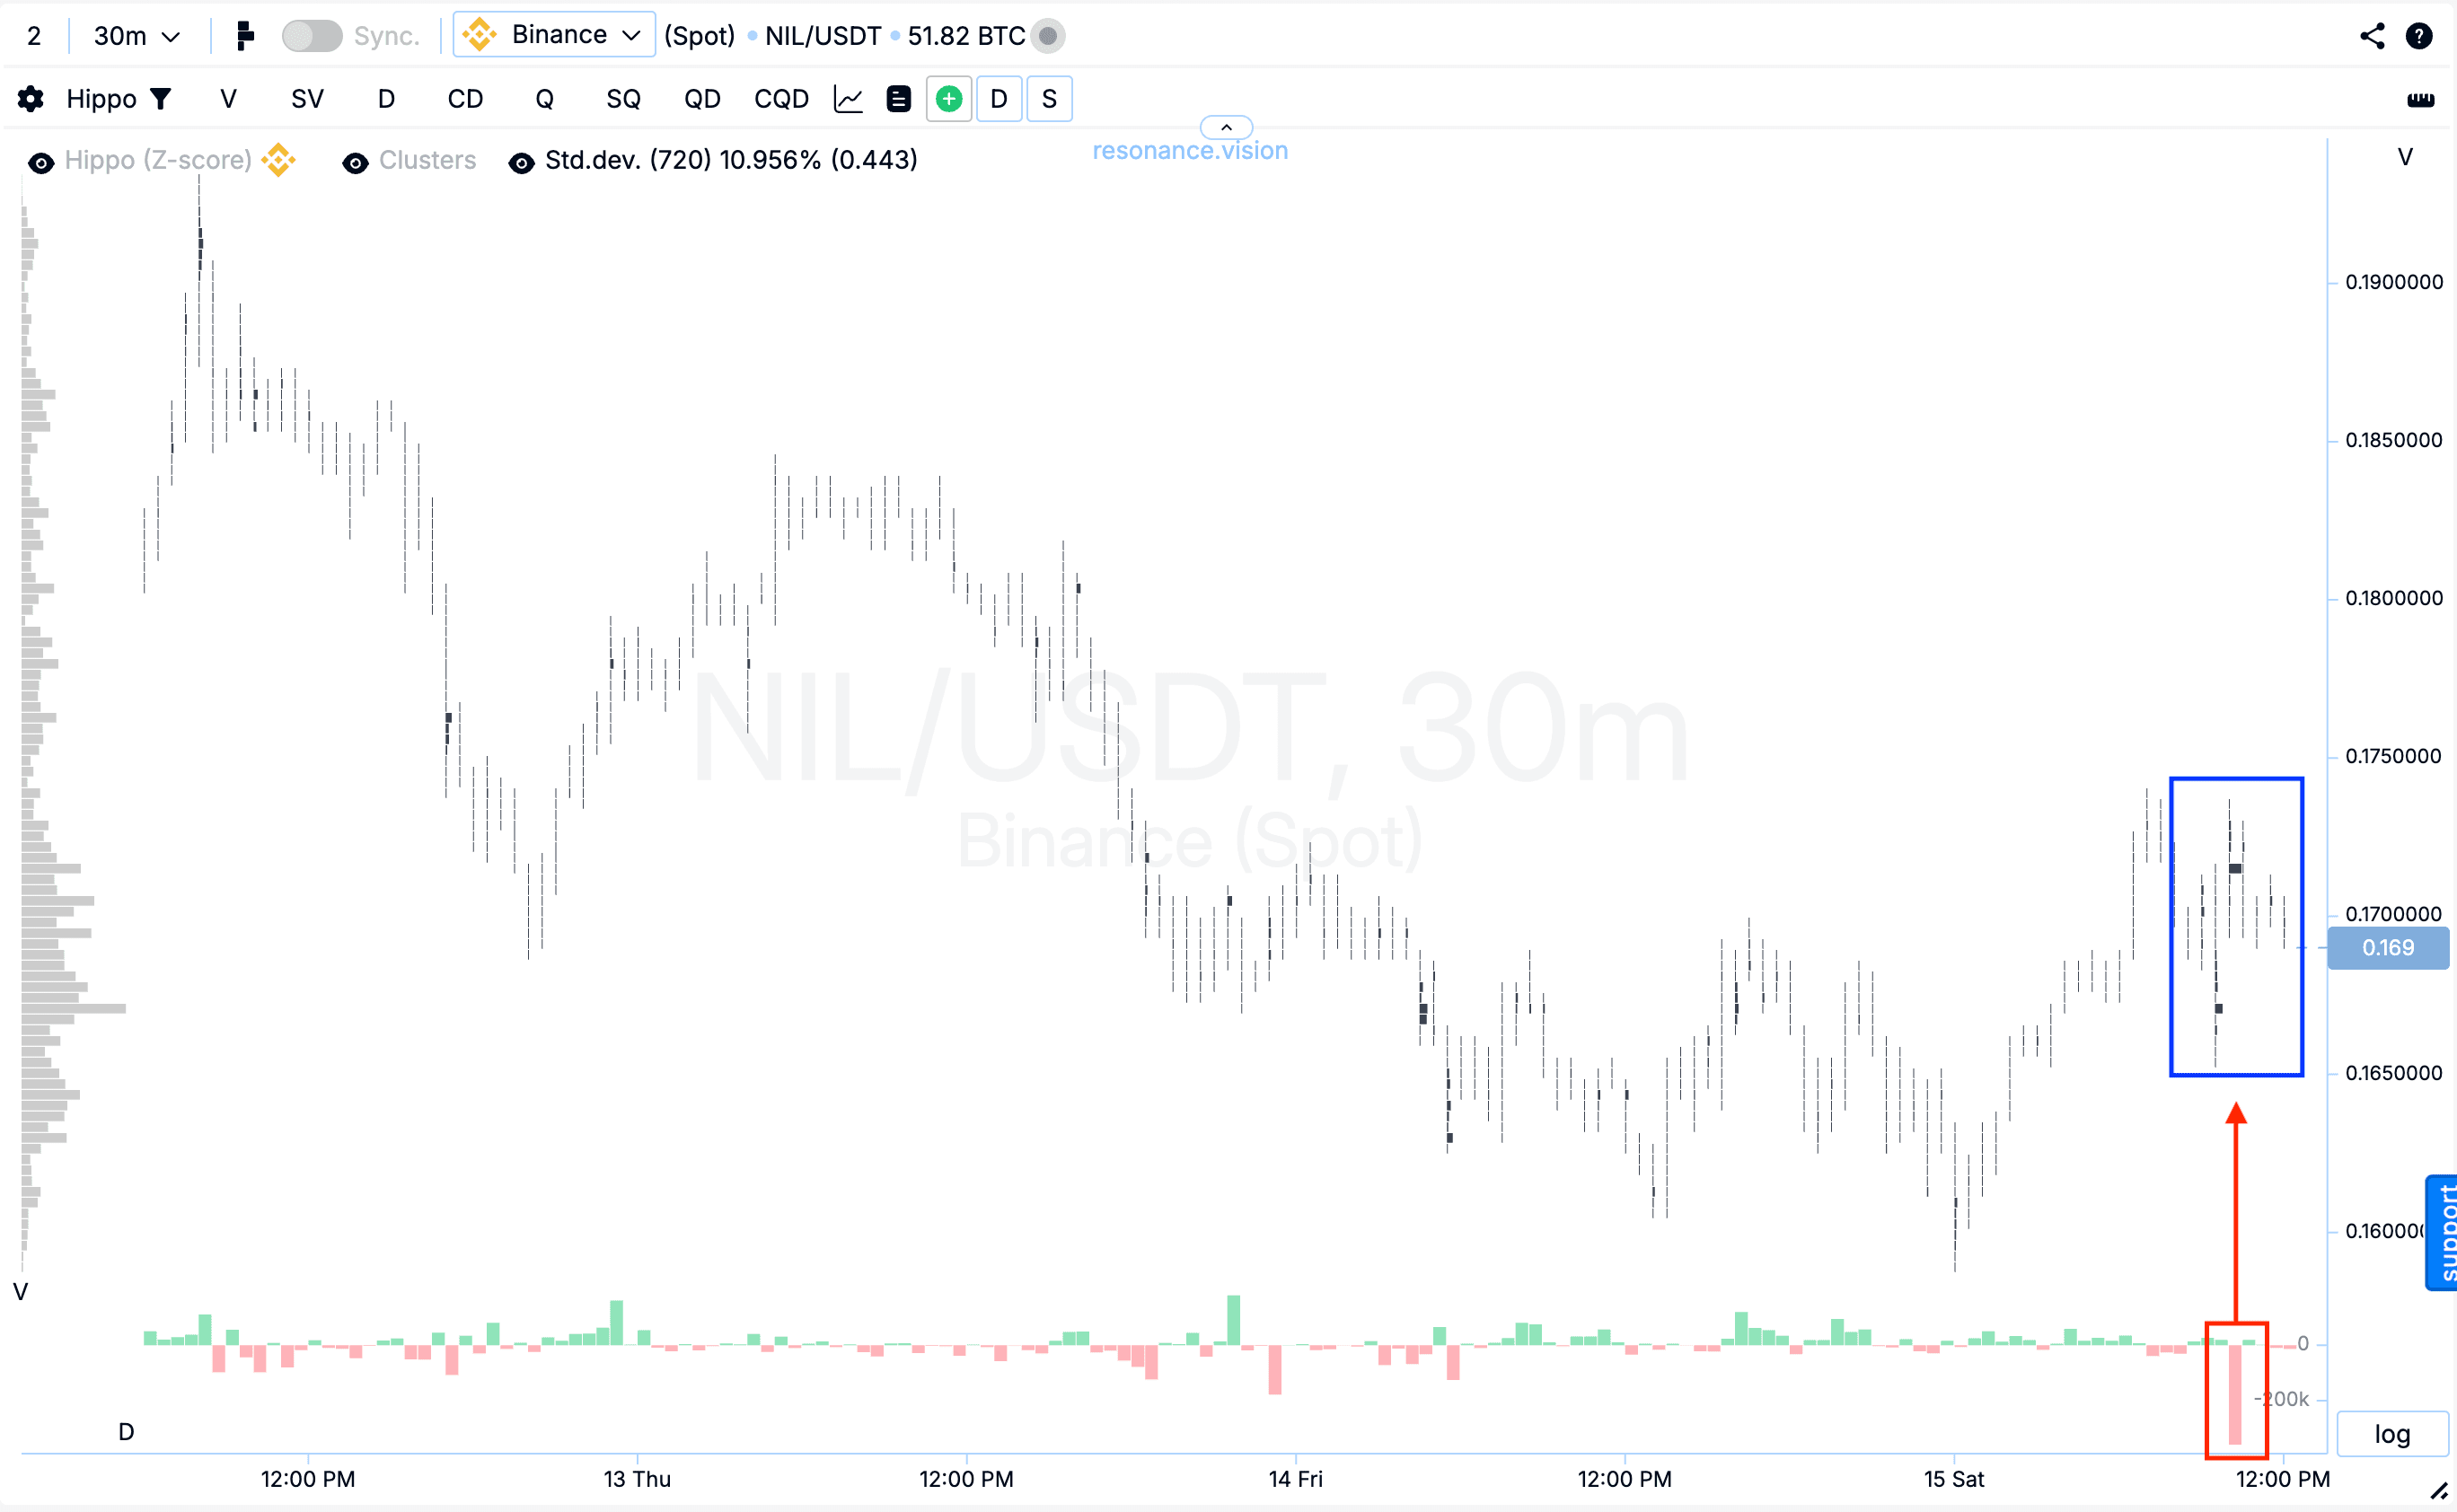
Cluster chart: during the decline, relatively large volume clusters began to appear (blue rectangle), within which selling volume clearly dominated. However, despite the pressure from sellers, the price did not continue to fall (red rectangle and arrow). This reaction indicates the early formation of local deficit signals.
In the Dashboard
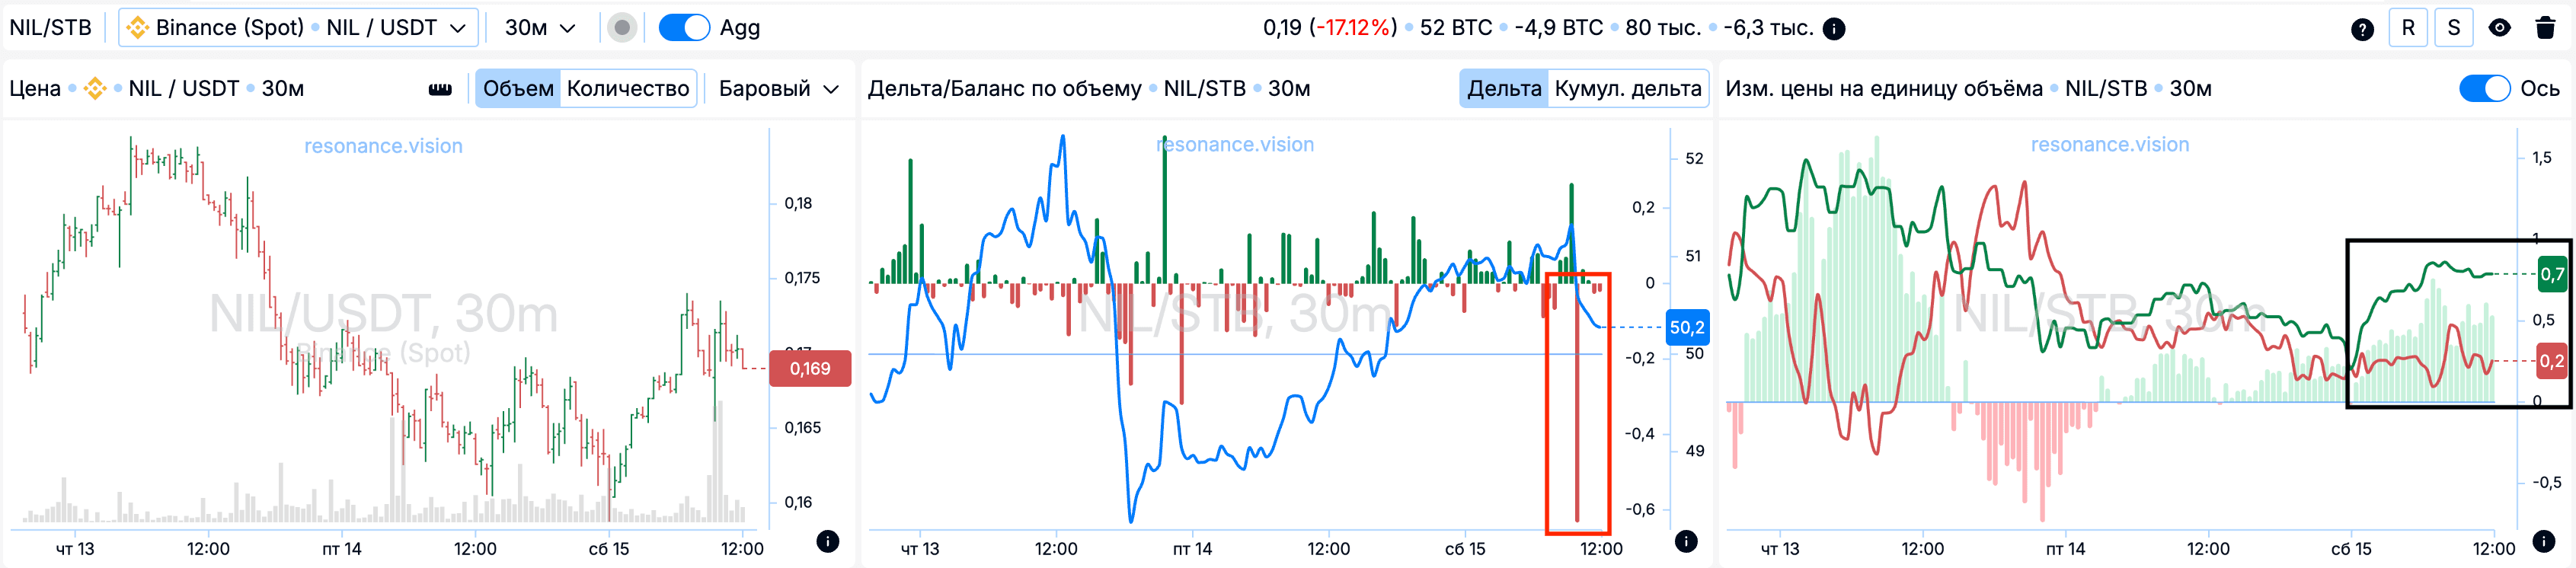
Delta / Volume Balance: aggregated data confirms the picture observed on the cluster chart. Despite significant selling volumes across all exchanges and pairs (red rectangle), the price does not show a proportional decline relative to the volume spent. This dynamic indicates inefficient market selling and a potential shift of initiative toward buyers.
Price change per unit of volume: the efficiency of market orders’ impact on price also began shifting in favor of buyers (black rectangle), which acts as an additional argument for opening a long position.
Exit Reasons
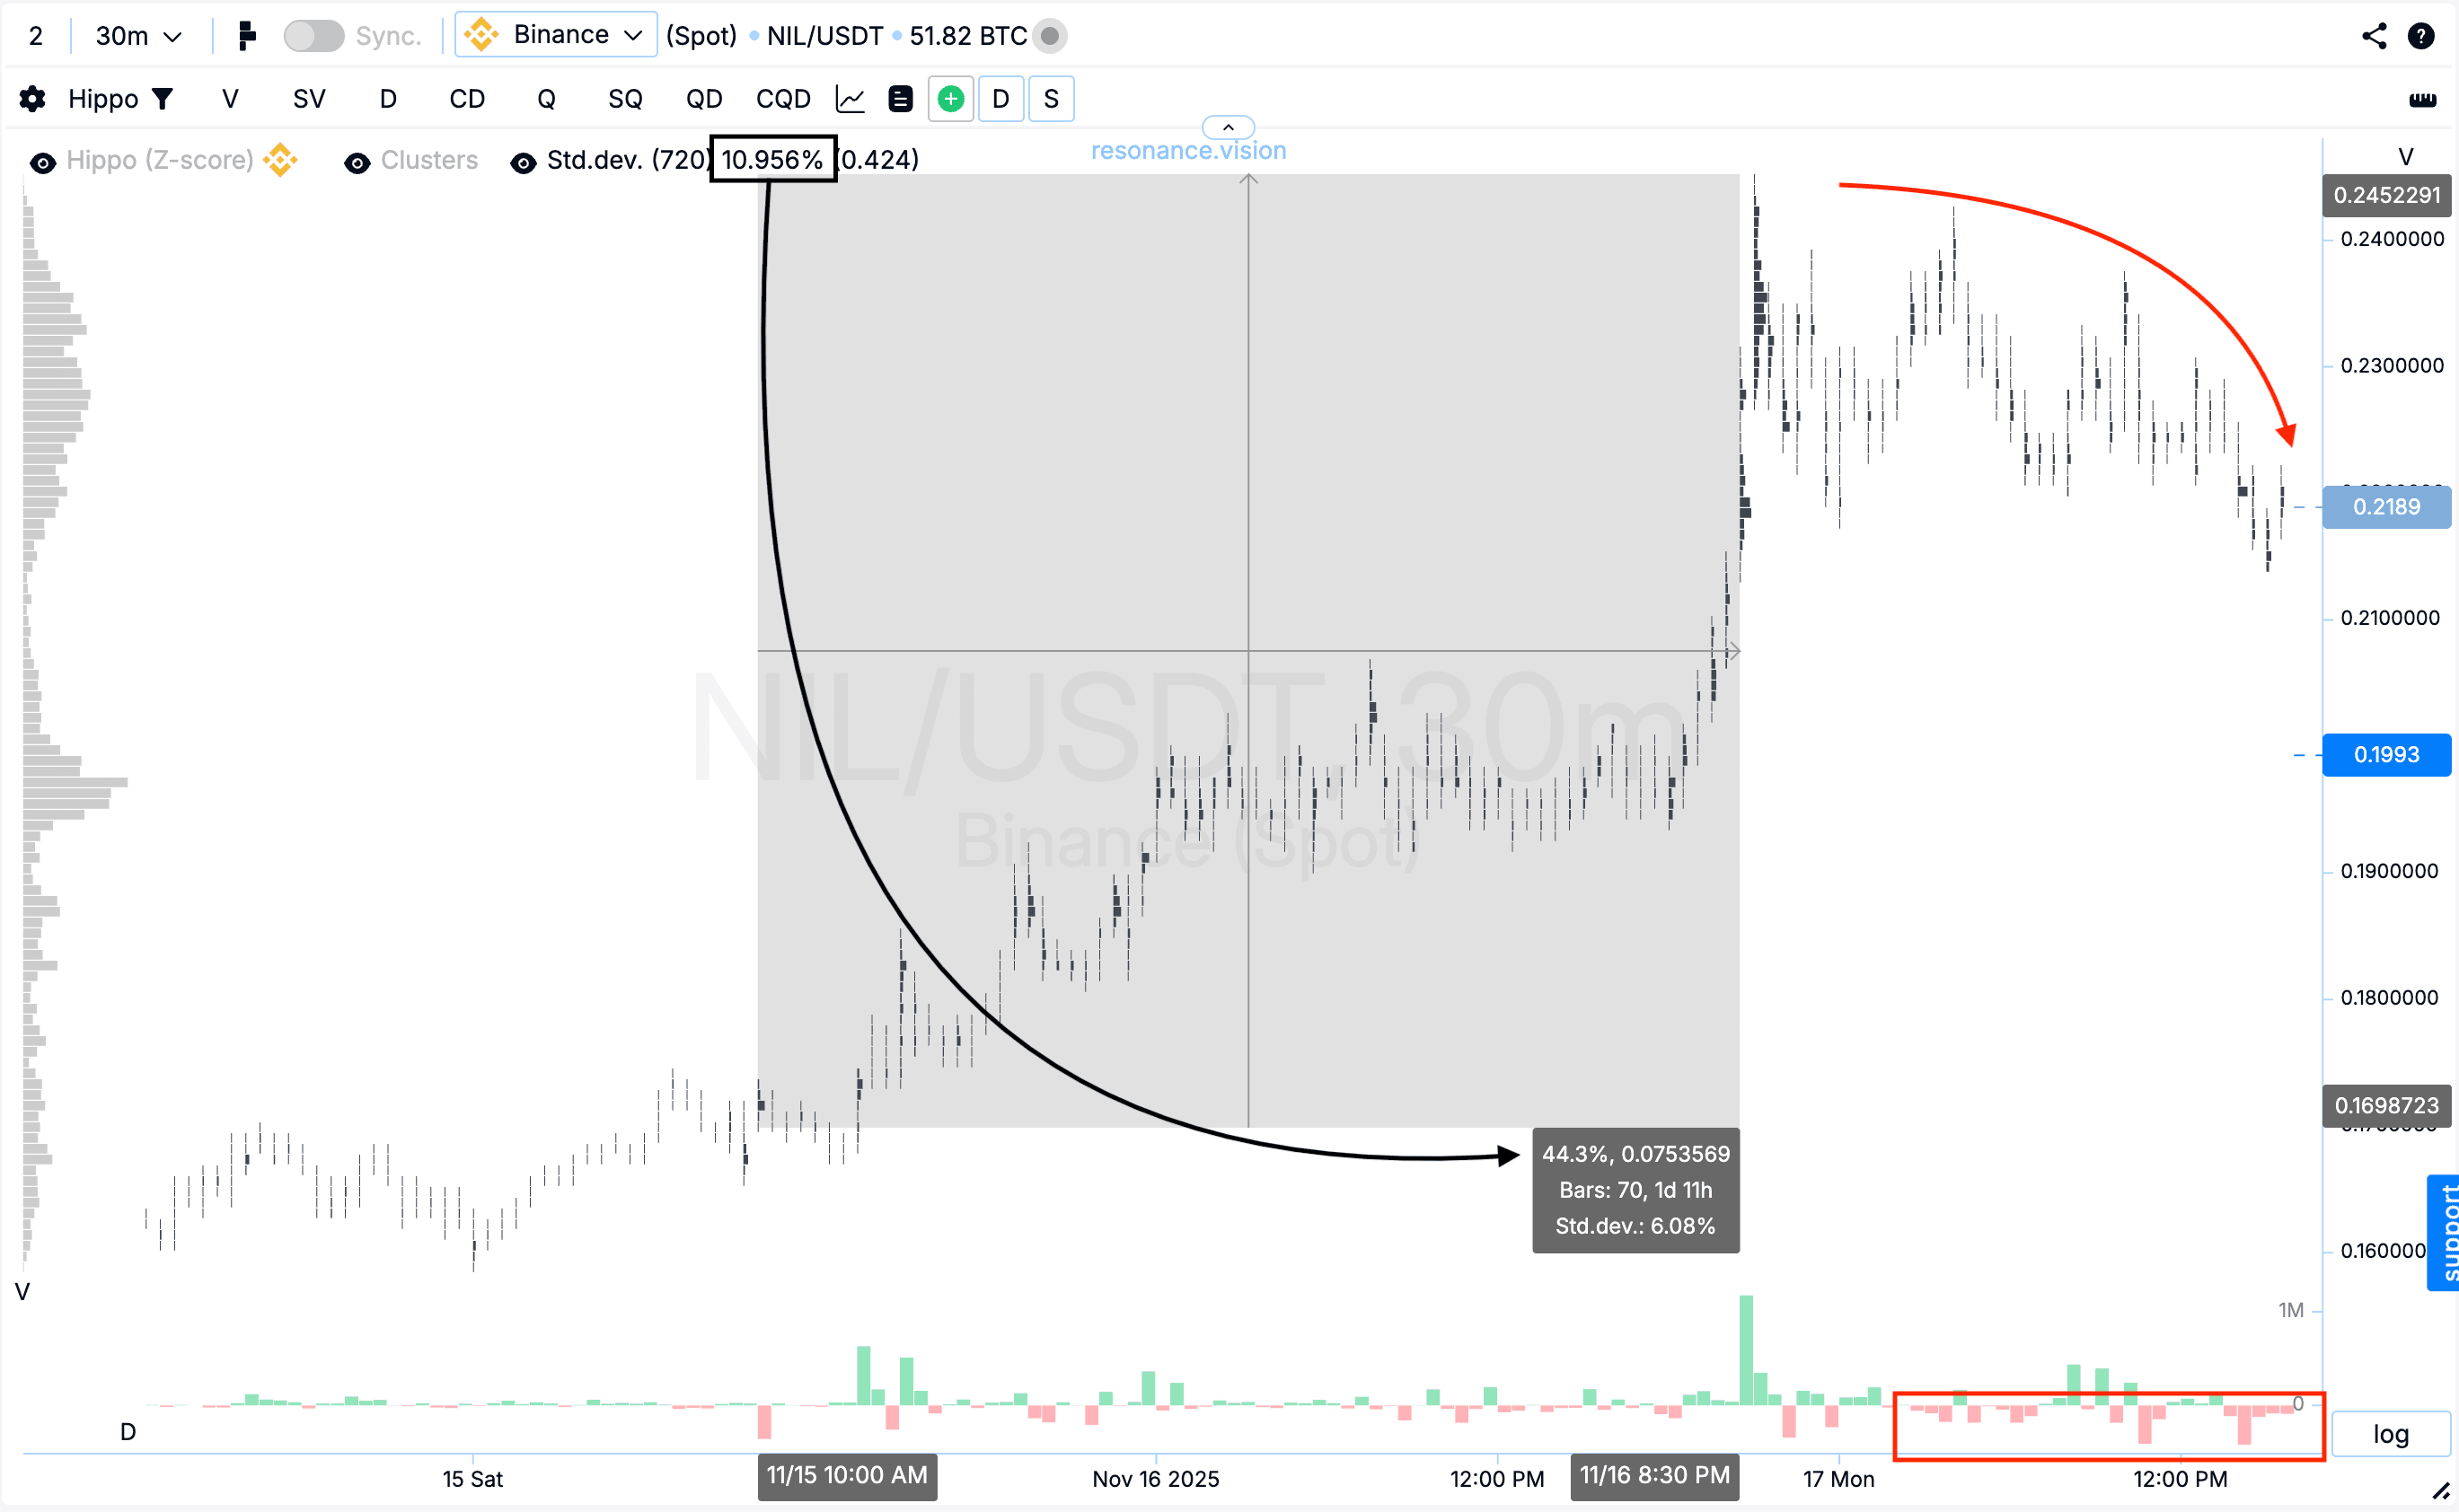
Cluster chart: after the entry point, the price increased by more than 40%, which corresponds to over four standard movements (black rectangle and arrow). At the same time, volatility increased noticeably, and more market sell orders started coming in, after which the price transitioned into a gradual decline (red rectangle and arrow). This behavior reflects decreasing buying efficiency: volumes were no longer pushing the price upward. Under these conditions, closing the position was the most rational decision, as further holding would have exposed the trade to elevated risk.
Conclusion
We observed signs of weakening sellers, confirmed them through aggregated data, and entered the position based on increasing buying efficiency. The subsequent price movement provided excellent potential — the asset covered a significant distance, volatility increased, market selling began to appear, and the price’s reaction to buying weakened.
Taking profit at that moment was not just correct but strategically sound: we captured a strong move and avoided unnecessary risk. This trade is a solid example of how combining cluster charts, aggregated data, and volume efficiency analysis allows you to enter early and exit on time.
Follow new insights in our telegram channel.
No need to invent complex schemes and look for the "grail". Use the Resonance platform tools.
Register via the link — get a bonus and start earning:
OKX | BingX | KuCoin.
Promo code TOPBLOG gives you a 10% discount on any Resonance tariff plan.
Recommended articles


