NOT +32.1% (Напрямкова стратегія Резонанс)

Розбір угоди з NOT/USDT: як кластерний аналіз, дельта та ефективність об’єму допомогли помітити ослаблення продавців, знайти точку входу та вчасно зафіксувати прибуток після аномального зростання та посилення волатильності.
Зміст

Монета: NOT/USDT
Ризик: середній
Рівень розуміння: новачок
Причини входу
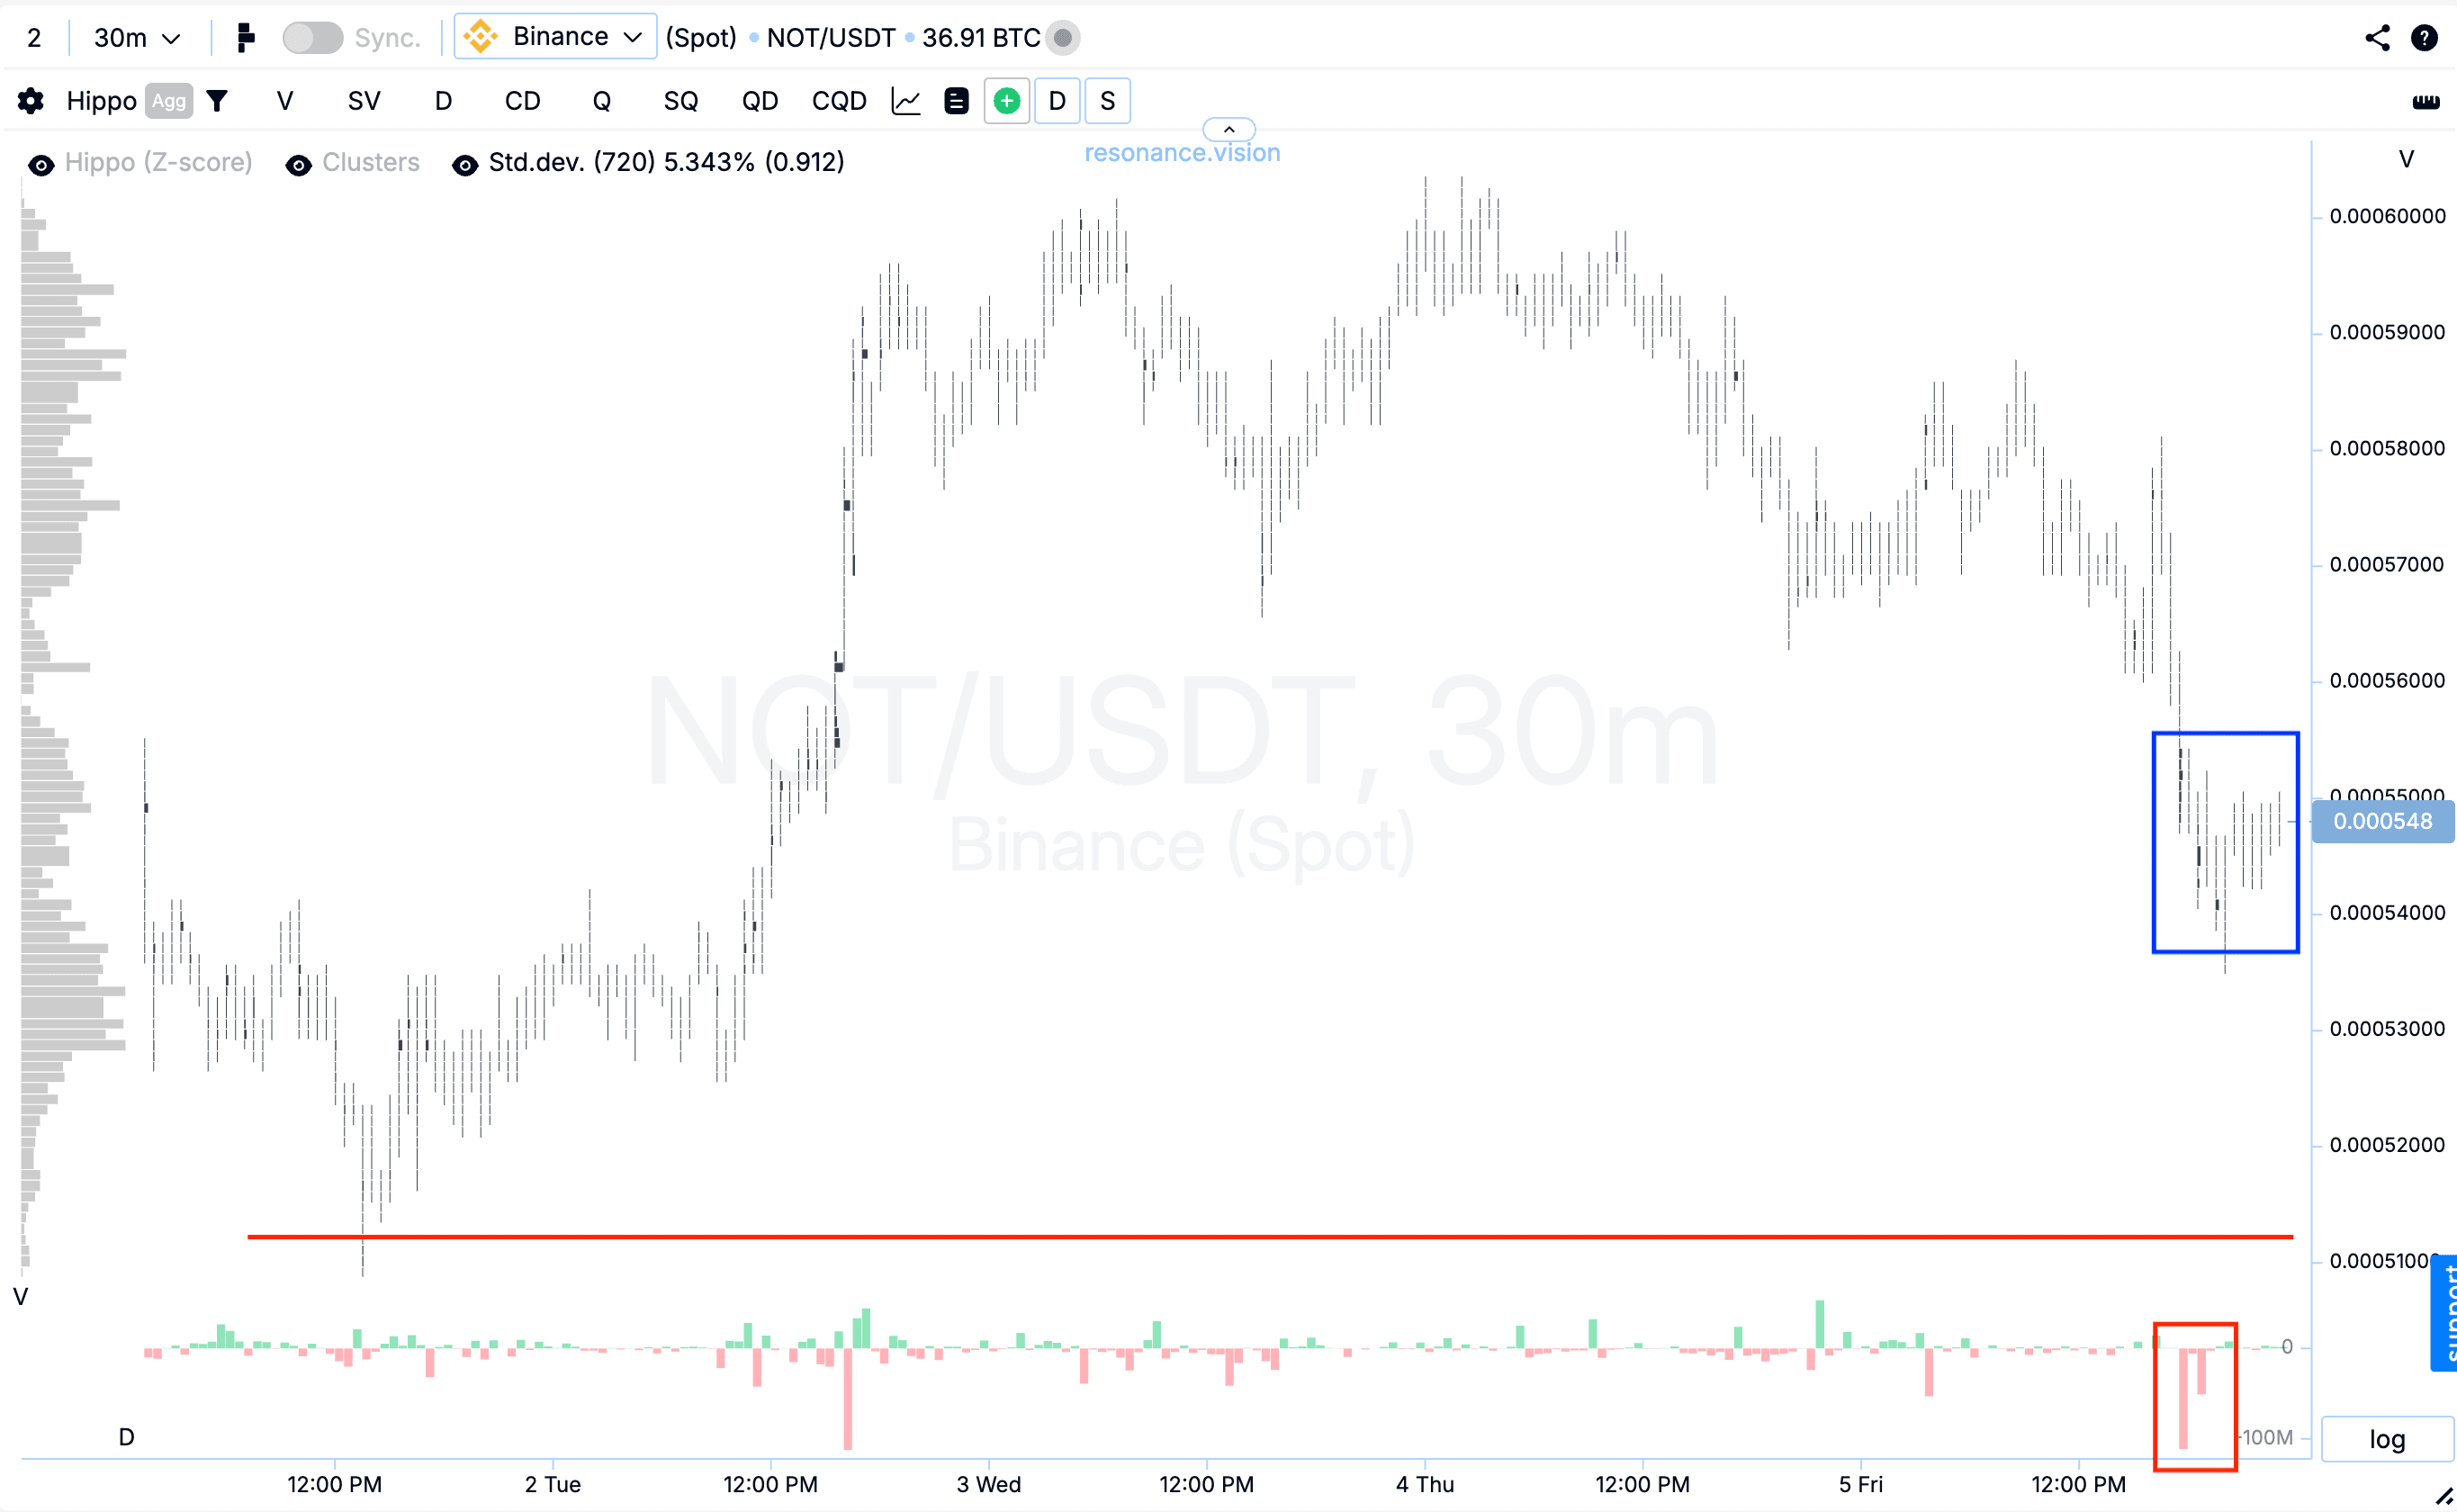
Кластерний графік: на зниженні сформувалися об’ємні кластери (синій прямокутник), усередині яких помітно збільшення об’ємів на продаж (червоний прямокутник). Однак, незважаючи на тиск, ціна не змогла поновити локальний мінімум (червона лінія). Така реакція ринку говорить про формування локального дефіциту та ослаблення сили продавців - їх повторні спроби продавити ціну вниз вже не дають результату.
У Дешборді
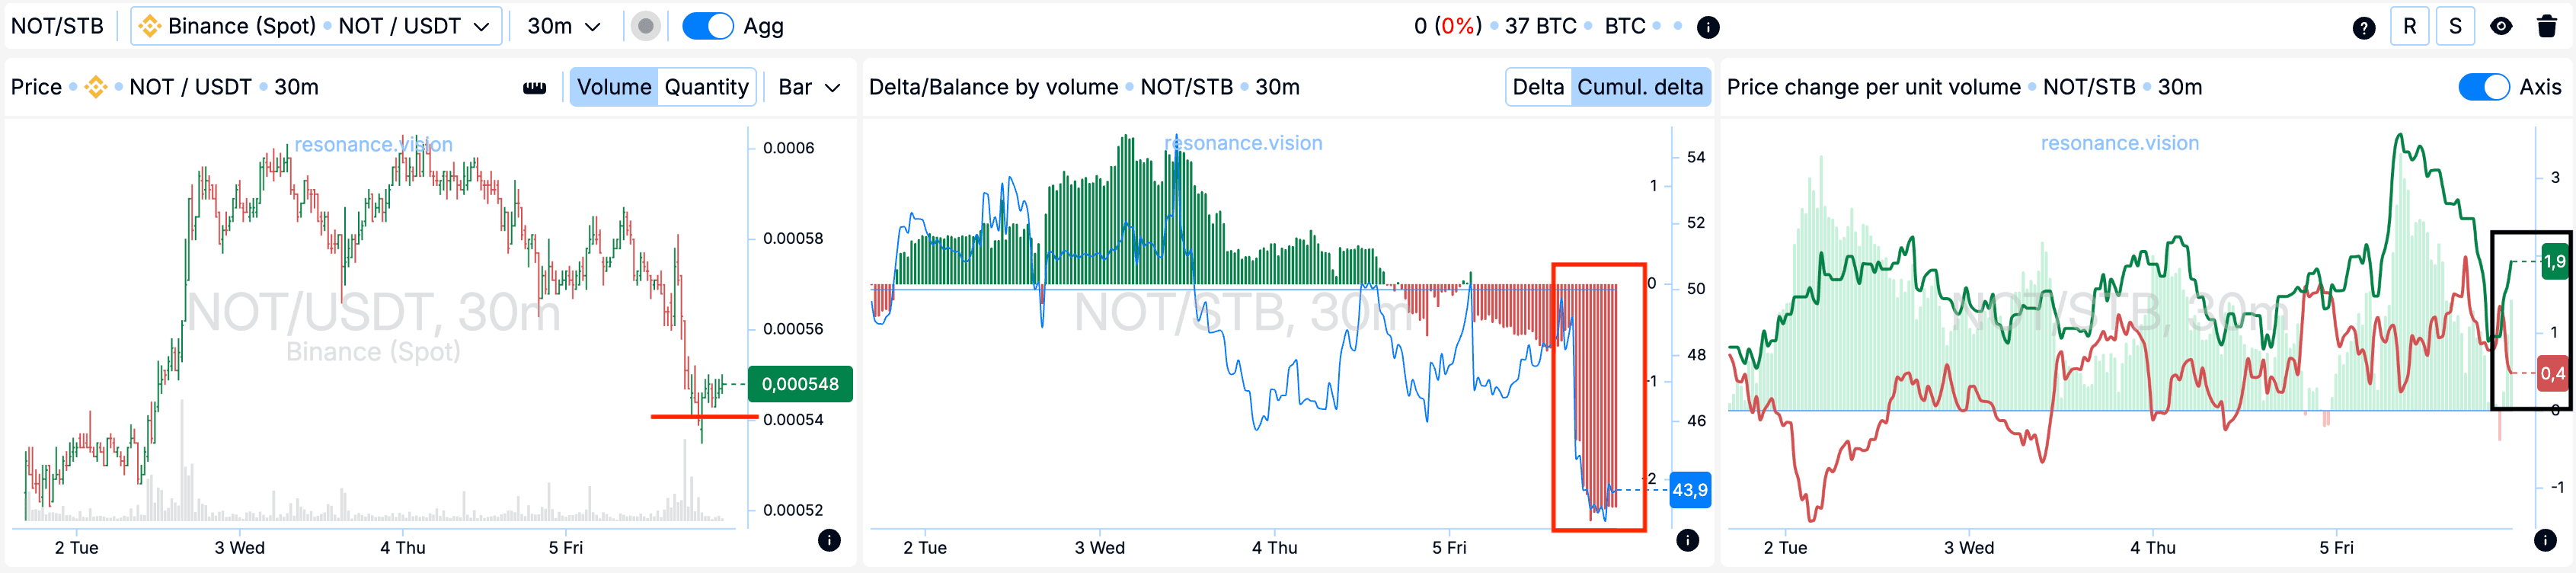
Дельта / Баланс за об’ємом: агреговані дані з усіх пар і бірж повністю підтверджують картину, яку показує кластерний графік. У цей період на крайніх барах помітно переважали ринкові продажі – це добре видно на гістограмі кумулятивної дельти (червоний прямокутник). Однак, незважаючи на тиск, що посилюється, ціна не знижувалася. Це свідчить, що лімітні покупці локально готові поглинати весь вихідний маркет-об’єм, формуючи локальну підтримку і показуючи ослаблення продавців.
Зміна ціни на одиницю об’єму: ефективність впливу ринкових ордерів на ціну почала зміщуватися на користь покупців (чорний прямокутник). Це означає, що навіть за порівнянних об’ємах угод покупці почали впливати на ціну більший вплив, ніж продавці. Такє зміщення ефективності виступає додатковим аргументом на користь відкриття позиції в лонг.
Причини виходу
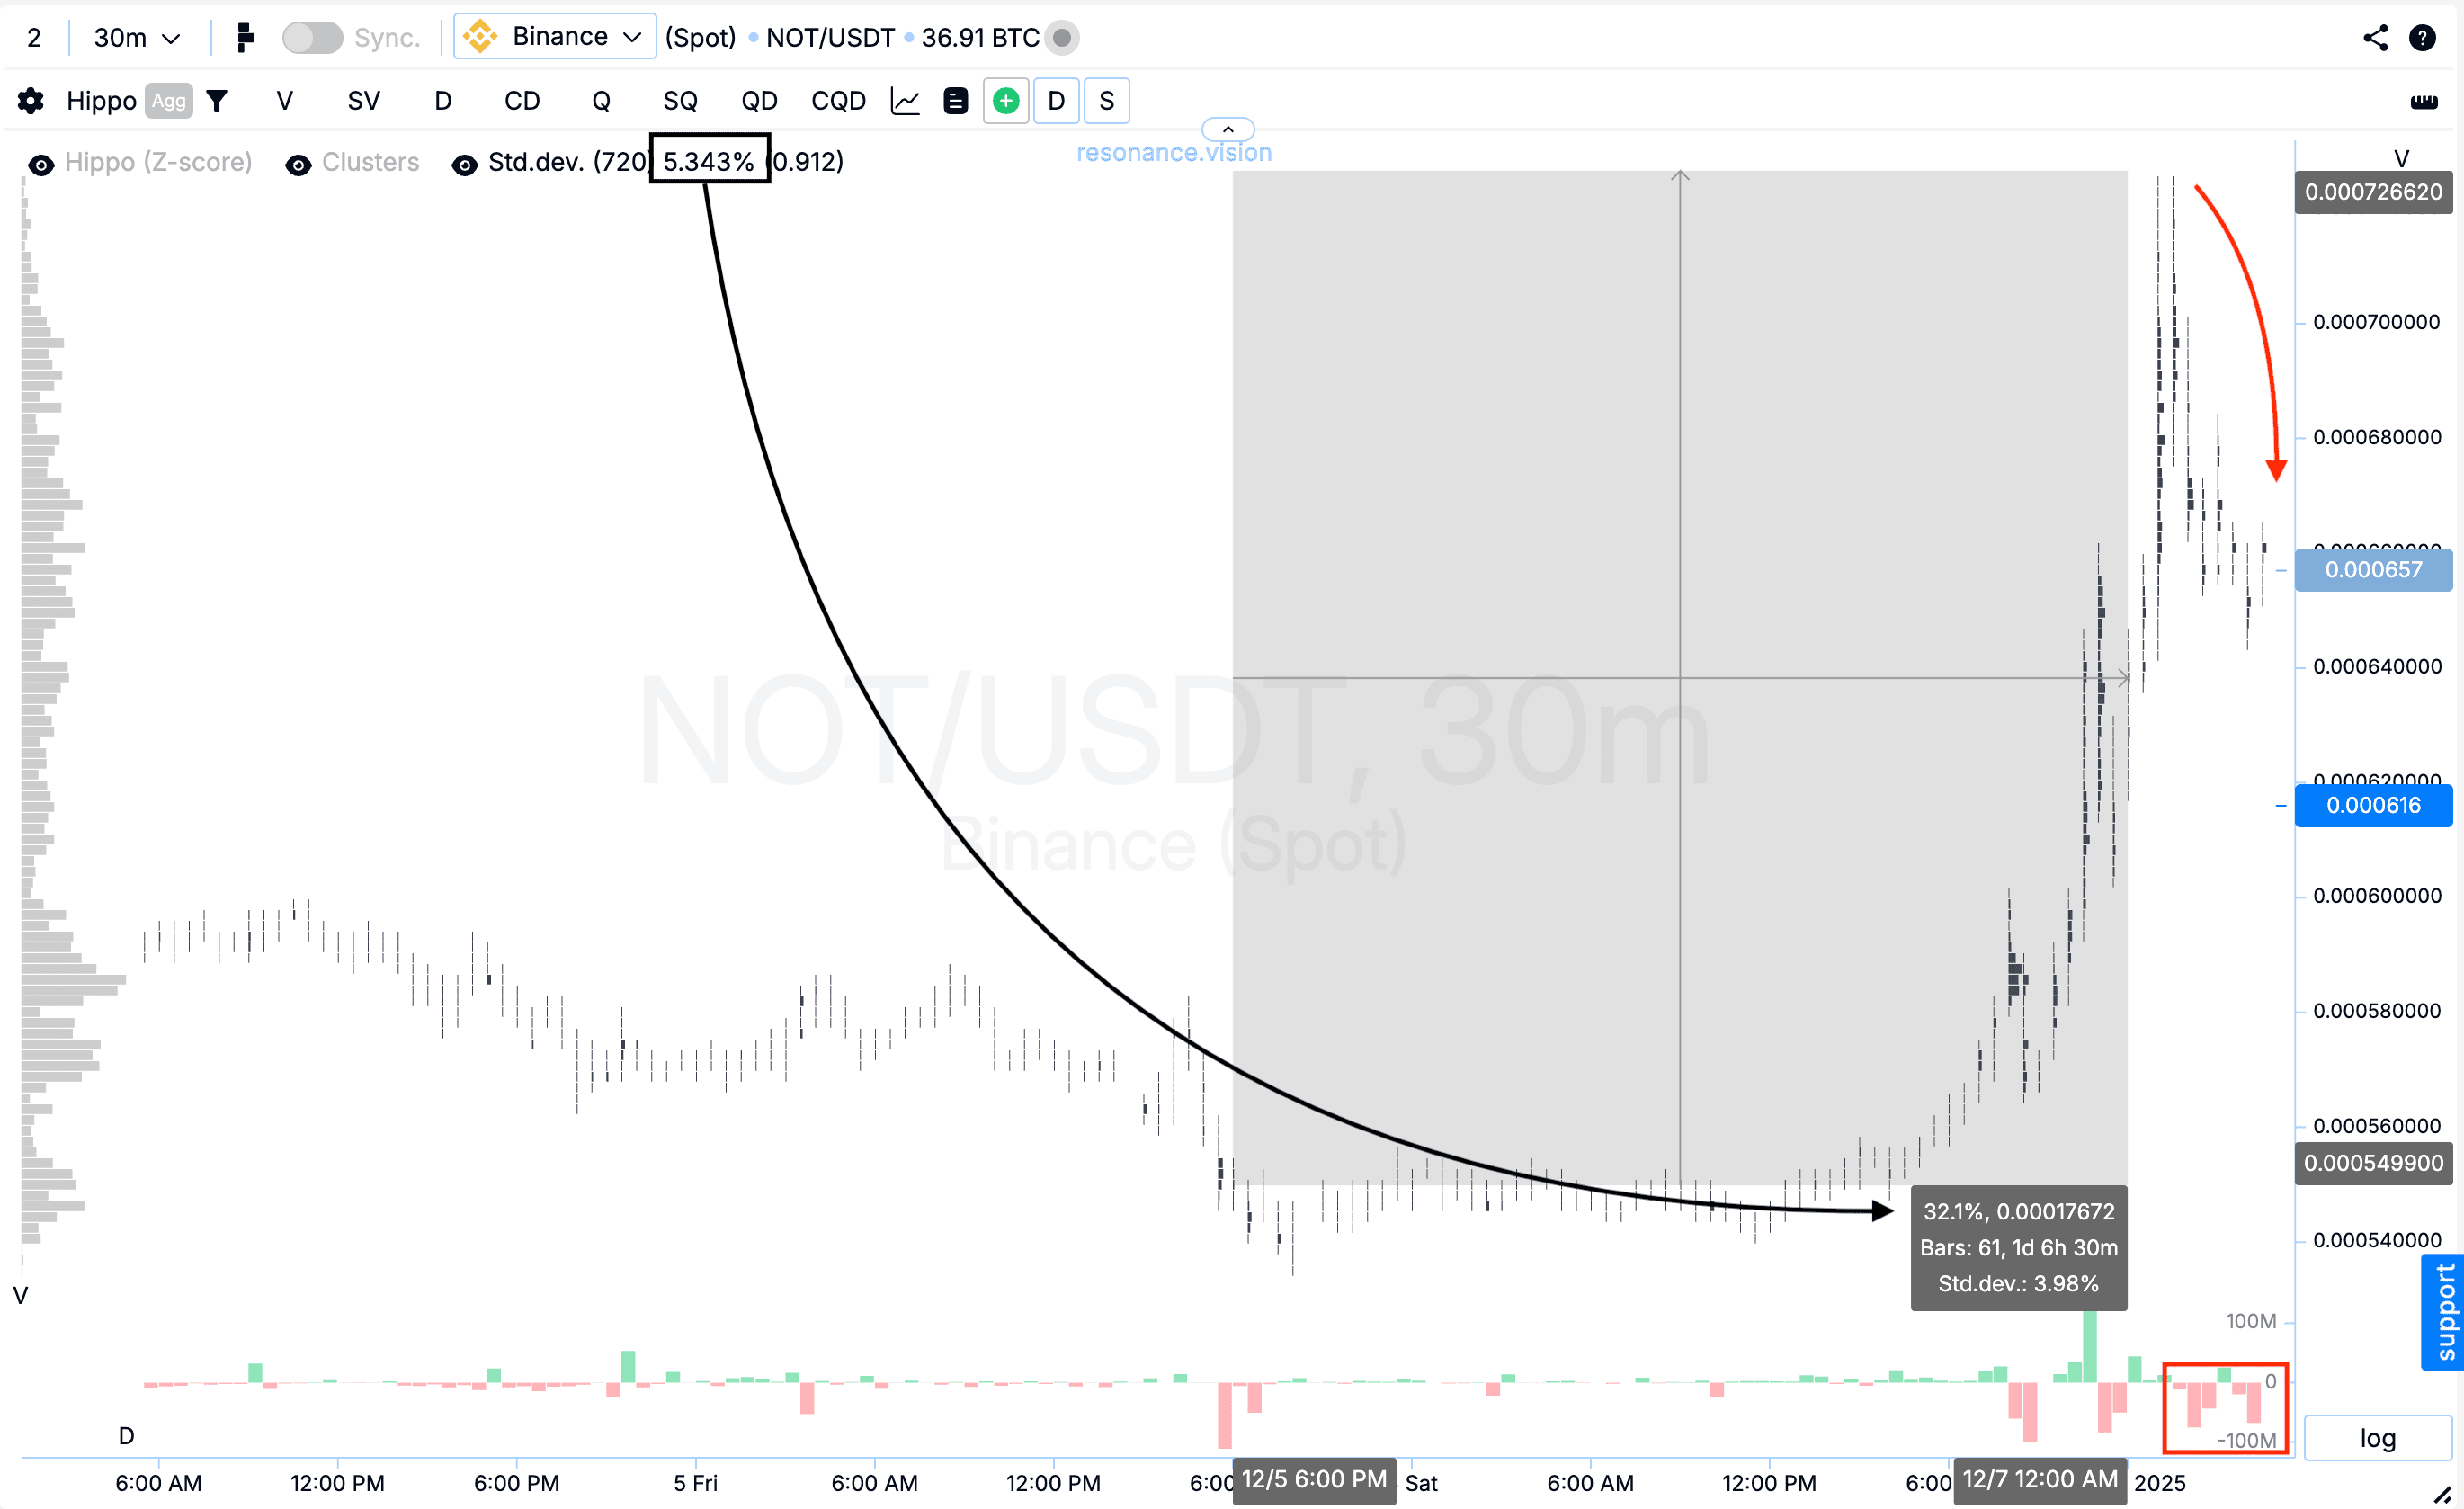
Кластерний графік: після точки входу ціна зросла більш ніж на 30%, що відповідає понад шість стандартних рухів (чорний прямокутник та стрілка). На цій ділянці помітно посилилася волатильність, а по ринку почали переважати маркет-продажі, після яких ціна перейшла в плавне зниження (червоний прямокутник і стрілка). Така структура руху часто свідчить про перехід ринку на фазу пошуку балансу , у якому може бути довге зниження. У подібних умовах подальше утримання позиції несе підвищений ризик, тому фіксація прибутку була раціональним і спокійним рішенням.
Висновок
На зниженні вдалося вчасно помітити ознаки локального дефіциту: продавці посилювали тиск, але ціна більше не реагувала, що свідчить про послаблення їхньої ініціативи. Підтвердження від агрегованих даних і зміна ефективності об’єму на користь покупців додали аргументи для лонг позиції.
Зростання після входу підтвердило ідею - рух вийшов суттєвим, що перевищує шість стандартних відхилень. Але як тільки ринок почав йти у фазу пошуку балансу – волатильність зросла, покупки втратили ефективність, а продажі почали плавно тиснути ціну вниз – стало очевидно, що далі ризики зростають над потенційним прибутком.
Фіксація позиції у такій фазі – це про дисципліну. Угода закрита у момент, коли забрав основний імпульс і не став пересиджувати зайве.
Відмінний приклад того, як поєднання кластерного графіка, агрегованих даних та аналізу ефективності об’єму допомагає не тільки побачити точку входу, а й вчасно вийти, зберігши результат.
Стеж за новими статтями у нашому телеграм каналі.
Не треба вигадувати складних схем та шукати “грааль”. Використовуйте інструменти платформи Resonance.
Реєструйся за посиланням - отримуй бонус і починай заробляти:
OKX | BingX | KuCoin.
Промокод TOPBLOG дає тобі 10% знижки на будь-який тарифний план Resonance.
Рекомендовані статті


