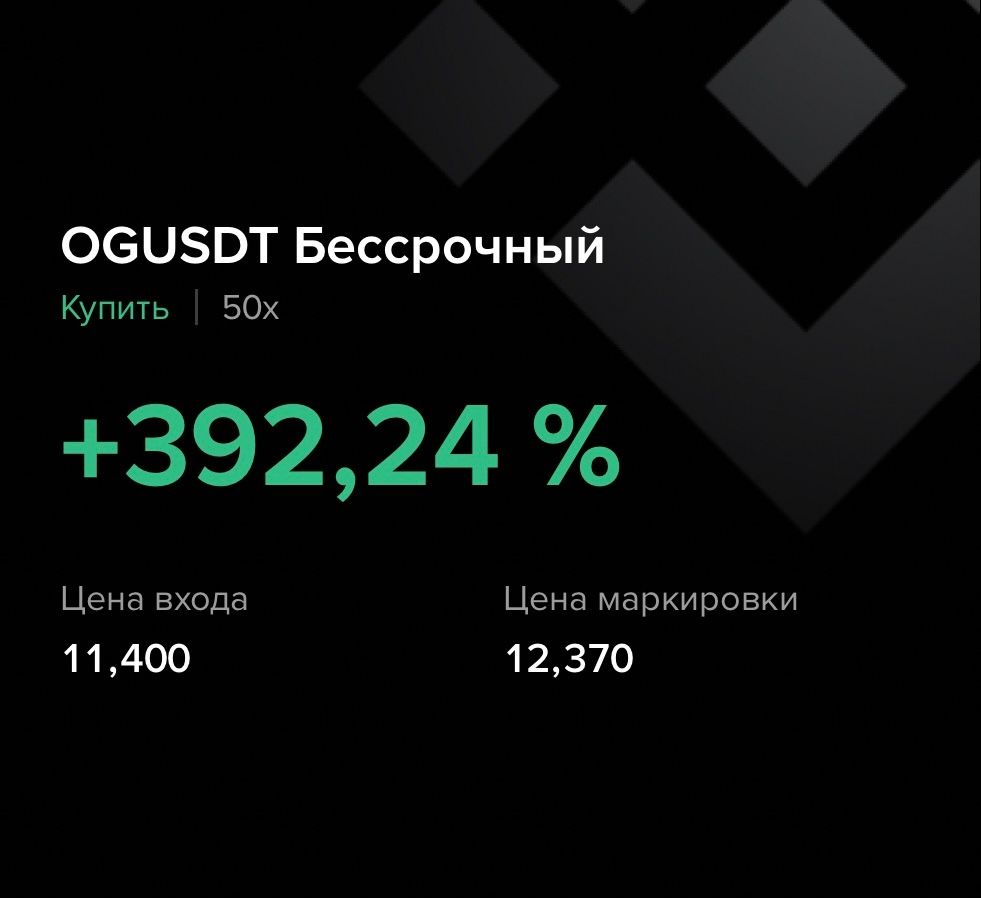
OG +392,24% (Напрямкова стратегія Резонанс)

Монета OG/USDT показала чудовий приклад, як поєднання кластерного аналізу та даних за лімітними заявками допомагає визначити момент зміни балансу сил. Незважаючи на активні продажі, ціна утримувалася за рахунок лімітних покупців, що сигналізувало про локальний дефіцит. Надалі зростання підтвердило ідею, а поява щільностей зверху стала сигналом для фіксації прибутку.
Зміст
Монета: OG/USDT
Ризик: низький
Рівень розуміння: новачок
Причини входу
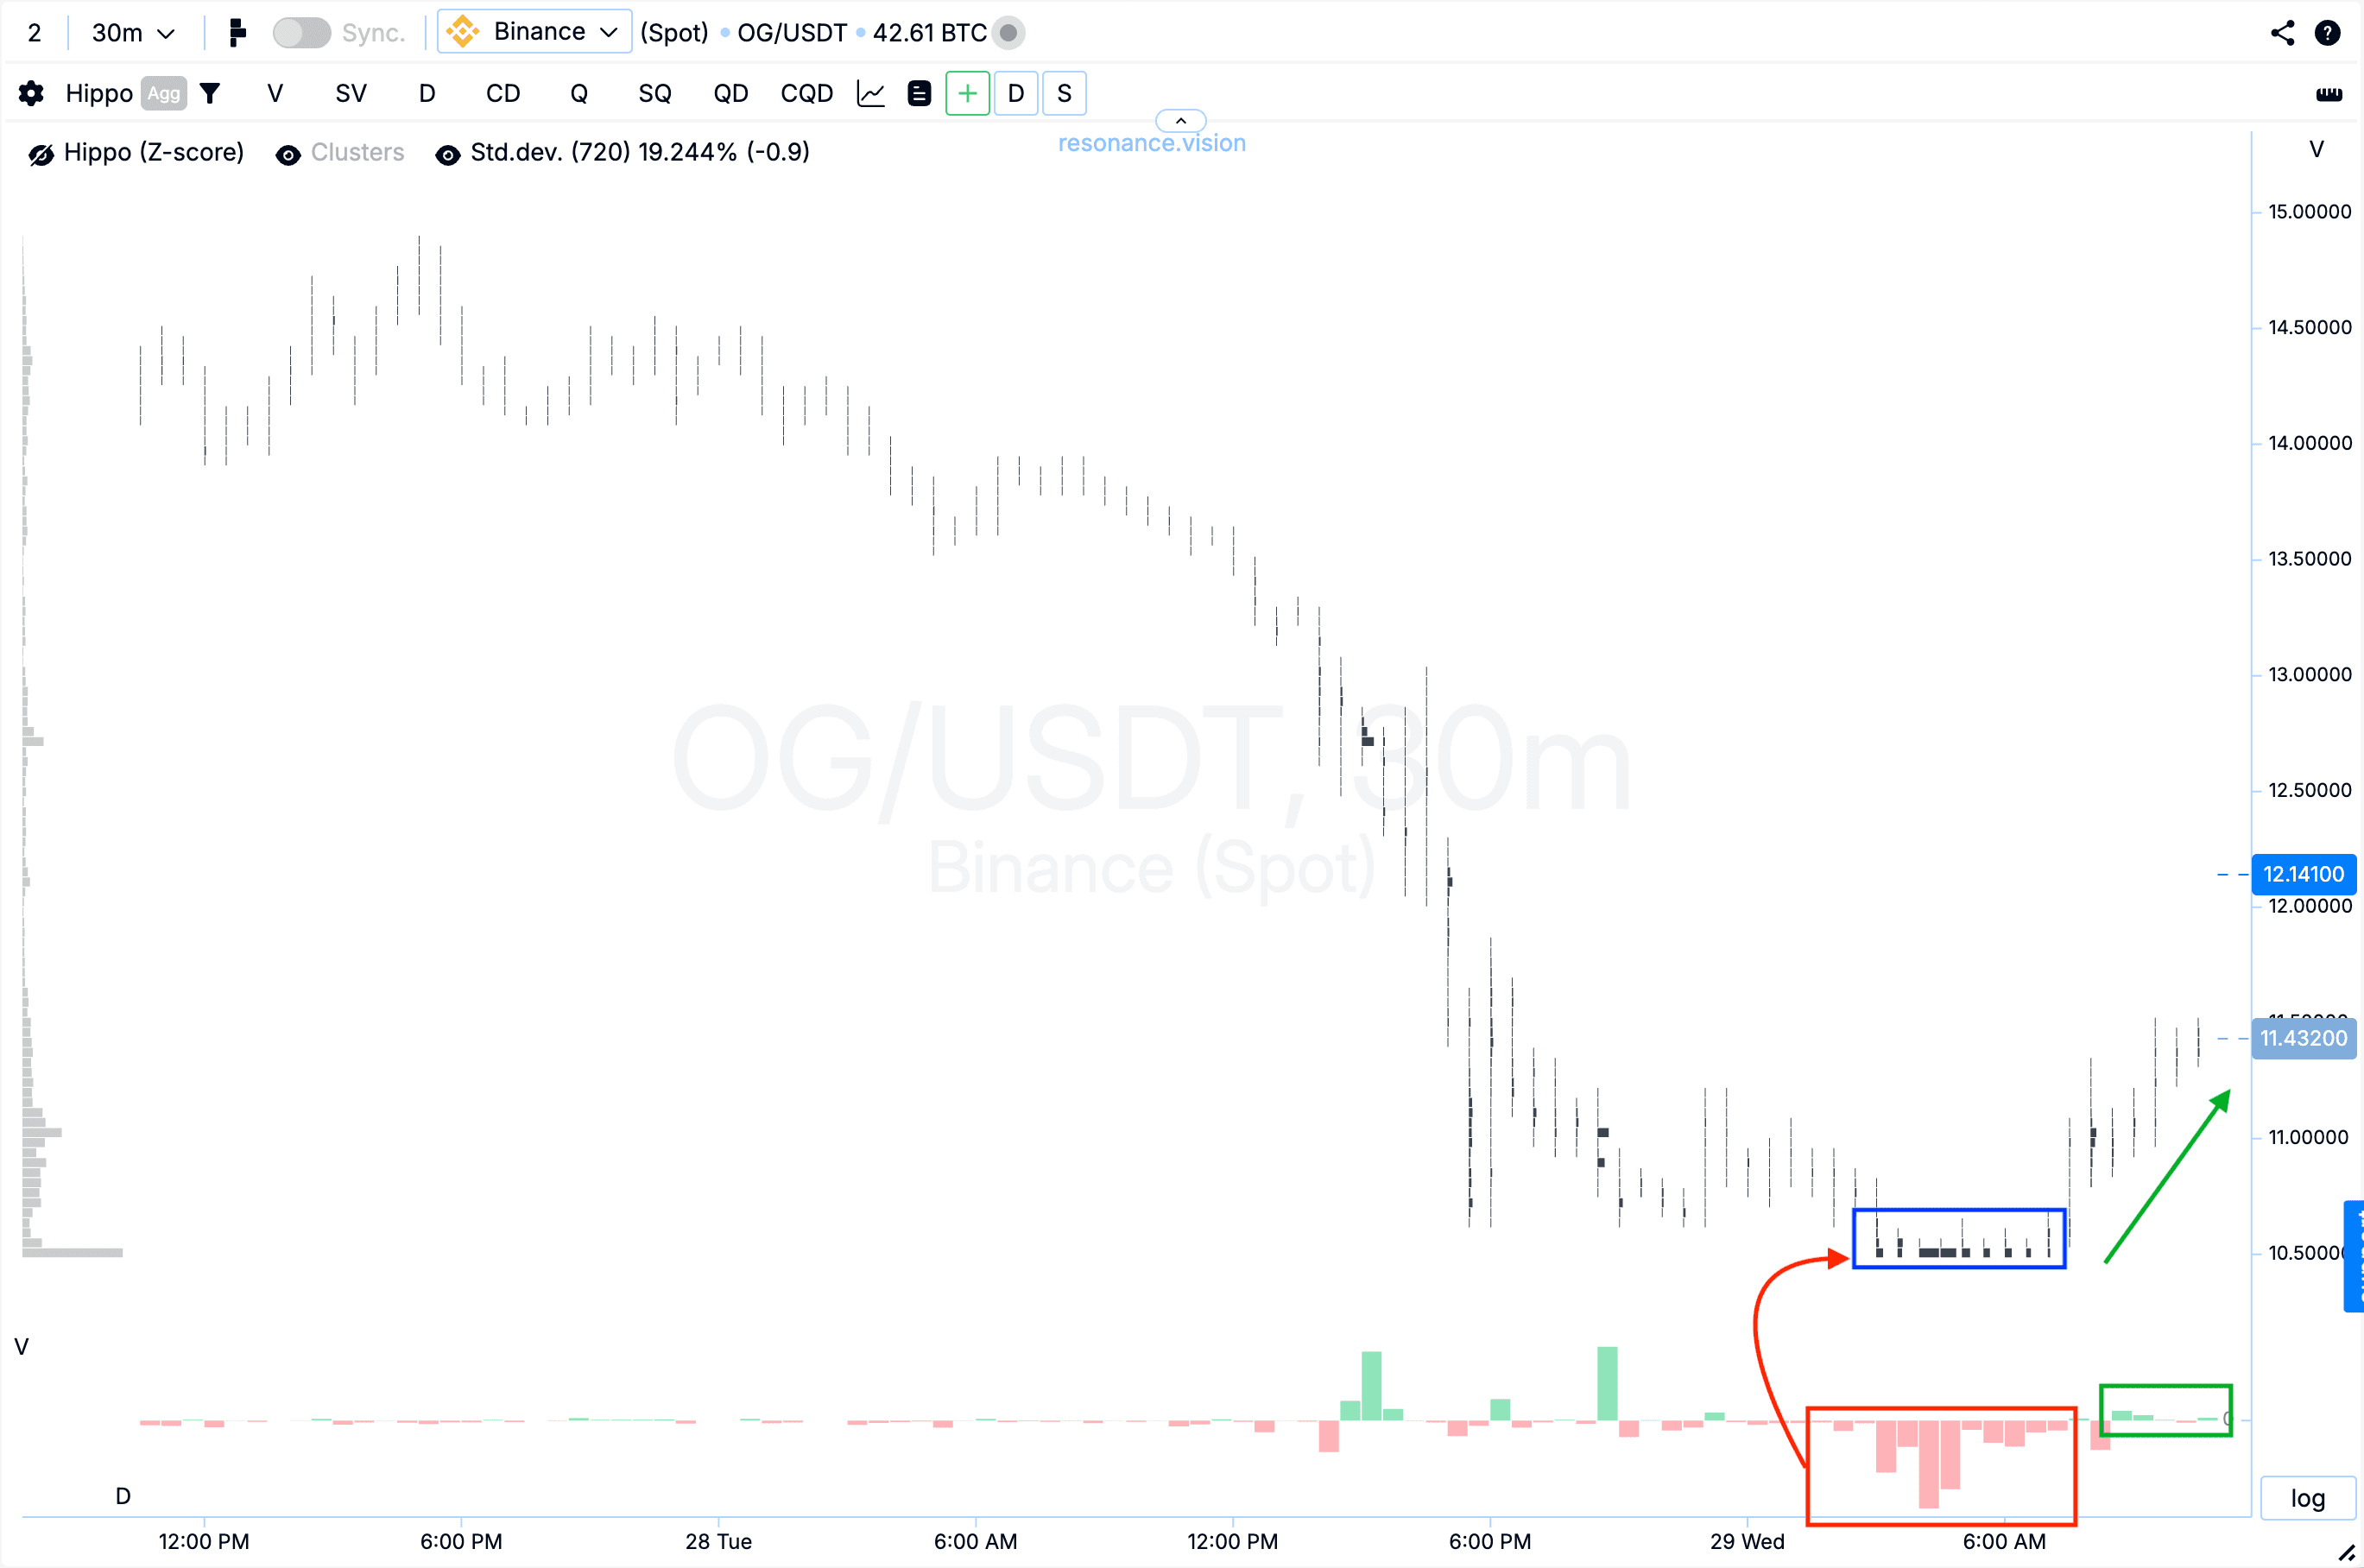
Кластерний графік: почали формуватися кластери за об’ємом (синій прямокутник). У цей момент суттєво переважали об’єми на продаж, проте ціна вже не знижувалася (червоний прямокутник зі стрілкою), це вказувало на послаблення тиску з боку продавців. Пізніше при відносно невеликих об’ємах покупок (зелений прямокутник і стрілка) ціна почала зростати, що підтверджує зміну локального балансу на користь покупців.
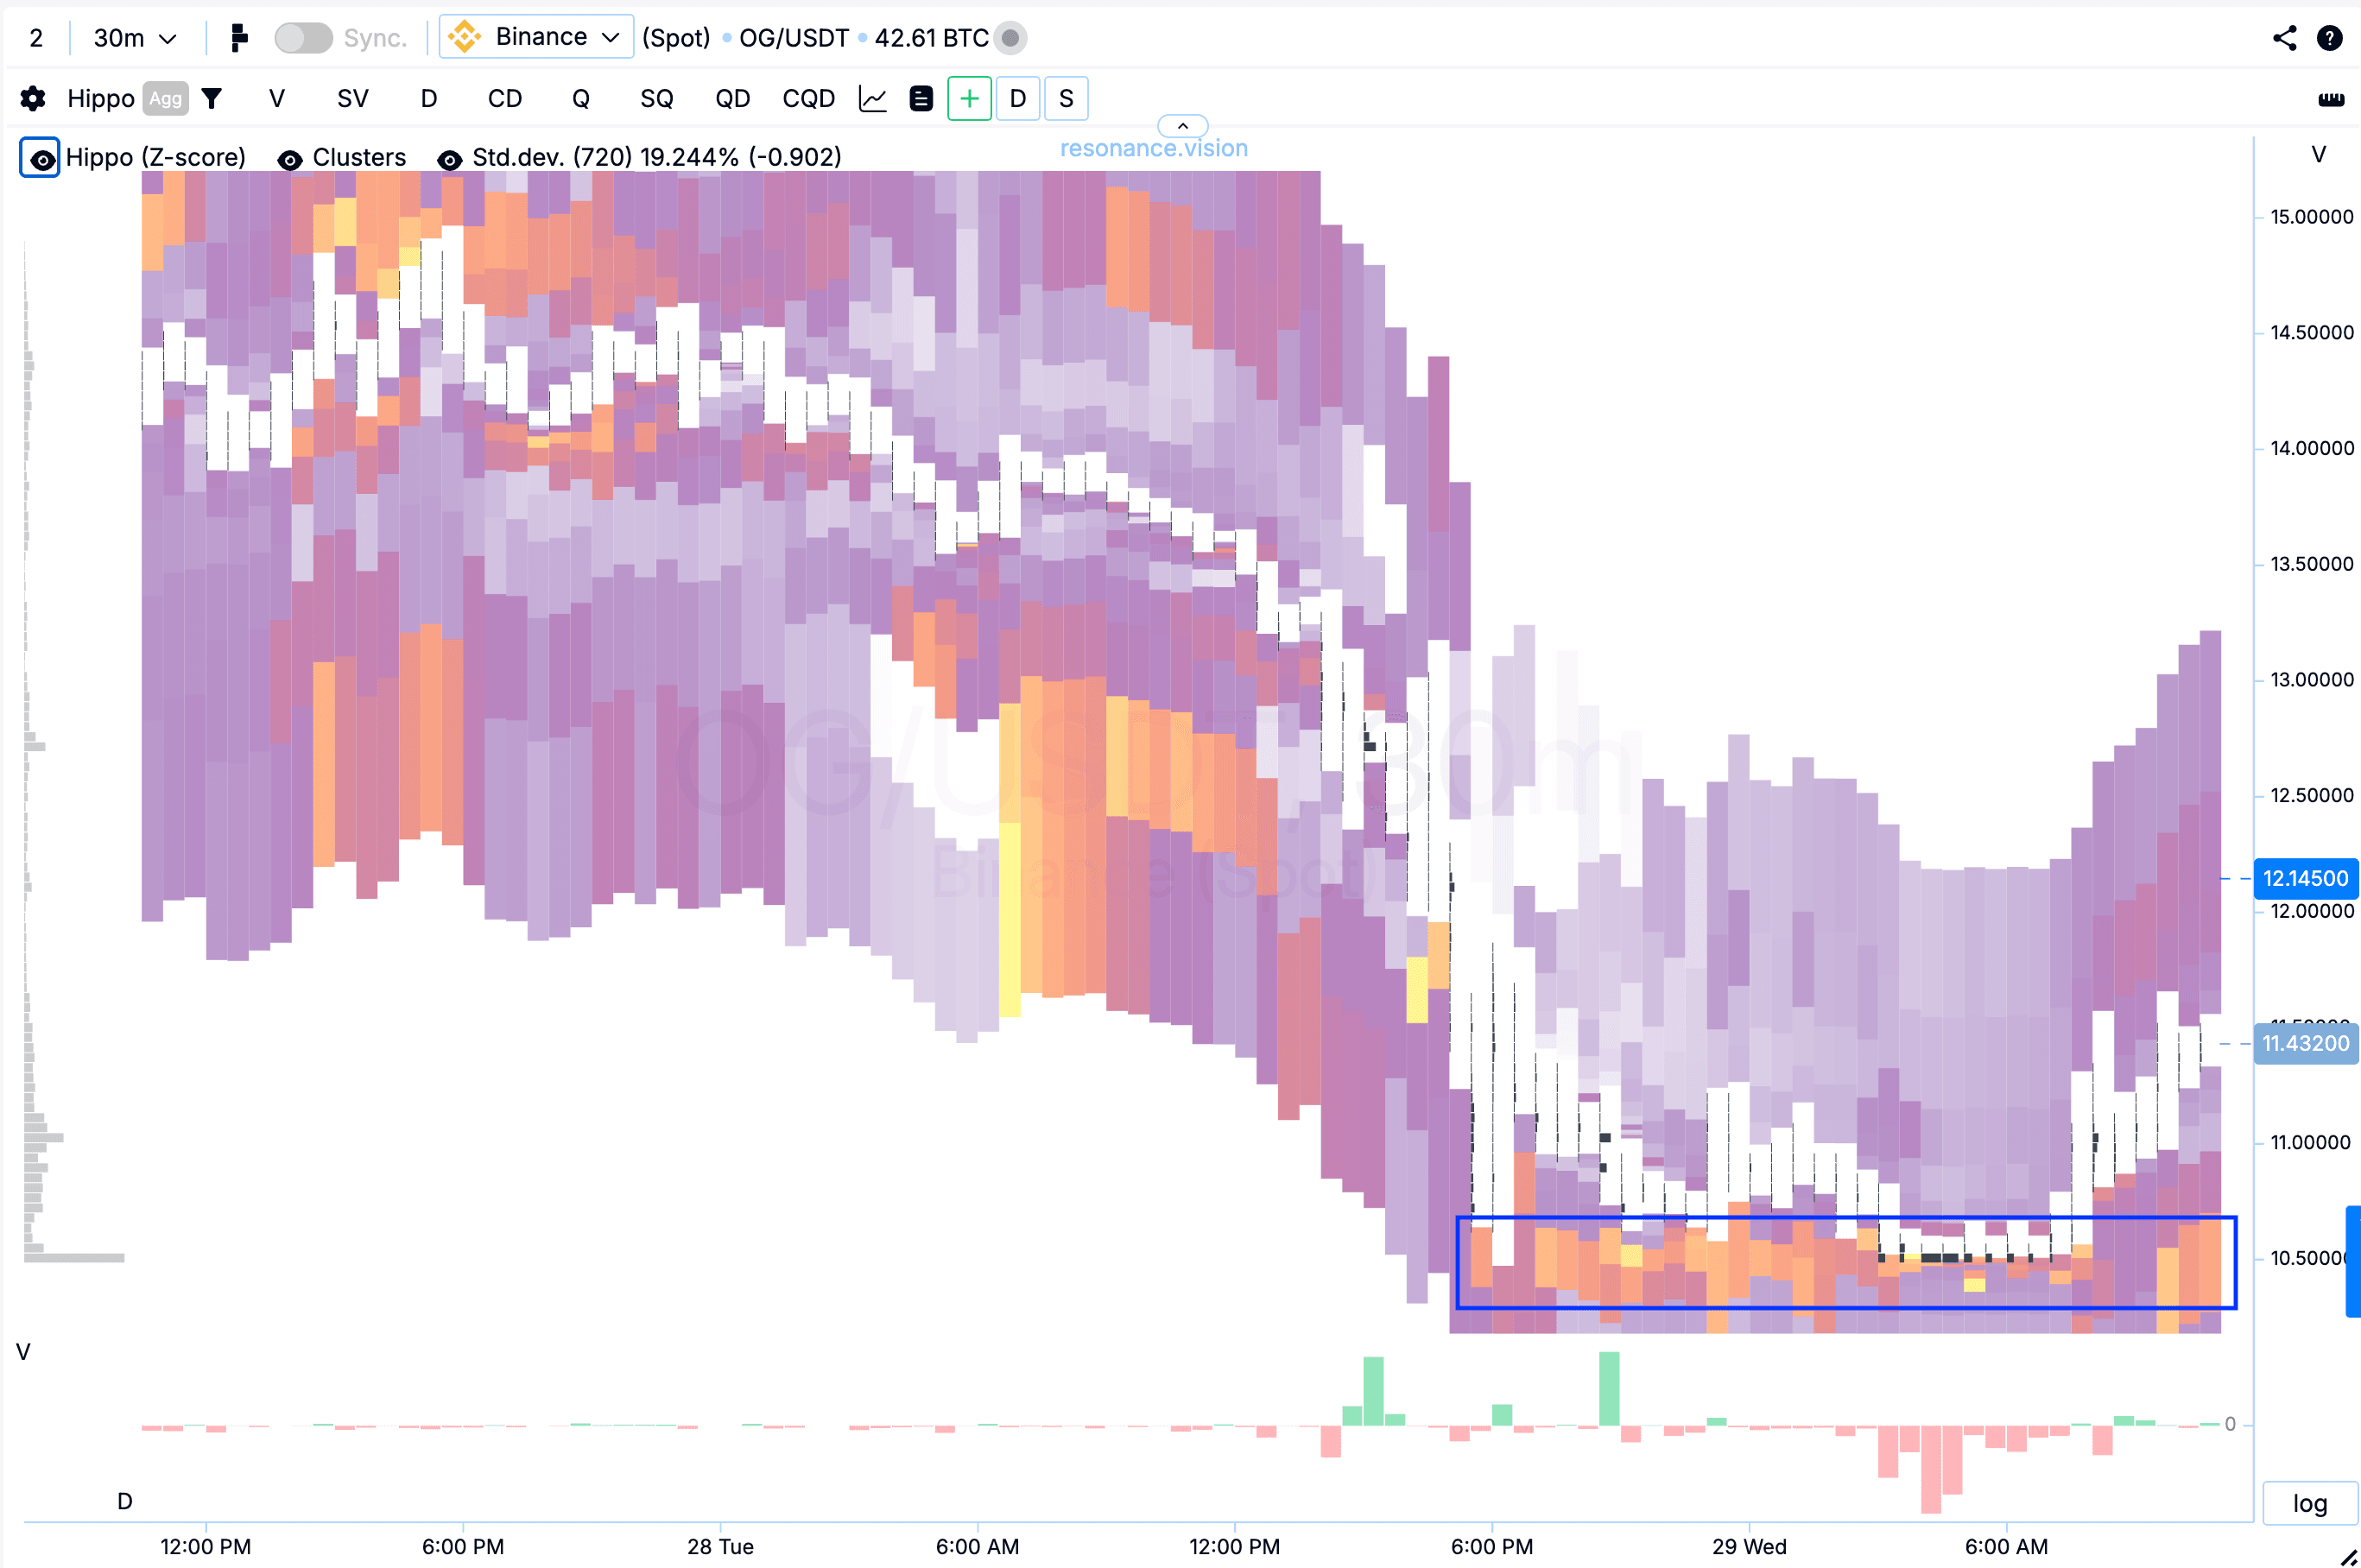
Теплова карта (Z-Score): також помітне скупчення лімітних заявок на покупку (синій прямокутник), які поглинули весь об’єм ринкових ордерів на продаж. Така реакція вказує на наявність ознак локального дефіциту і готовність учасників ринку лімітно викуповувати ринковий об’єм, що надходить, що підтверджує утримання ціни.
У Дешборді
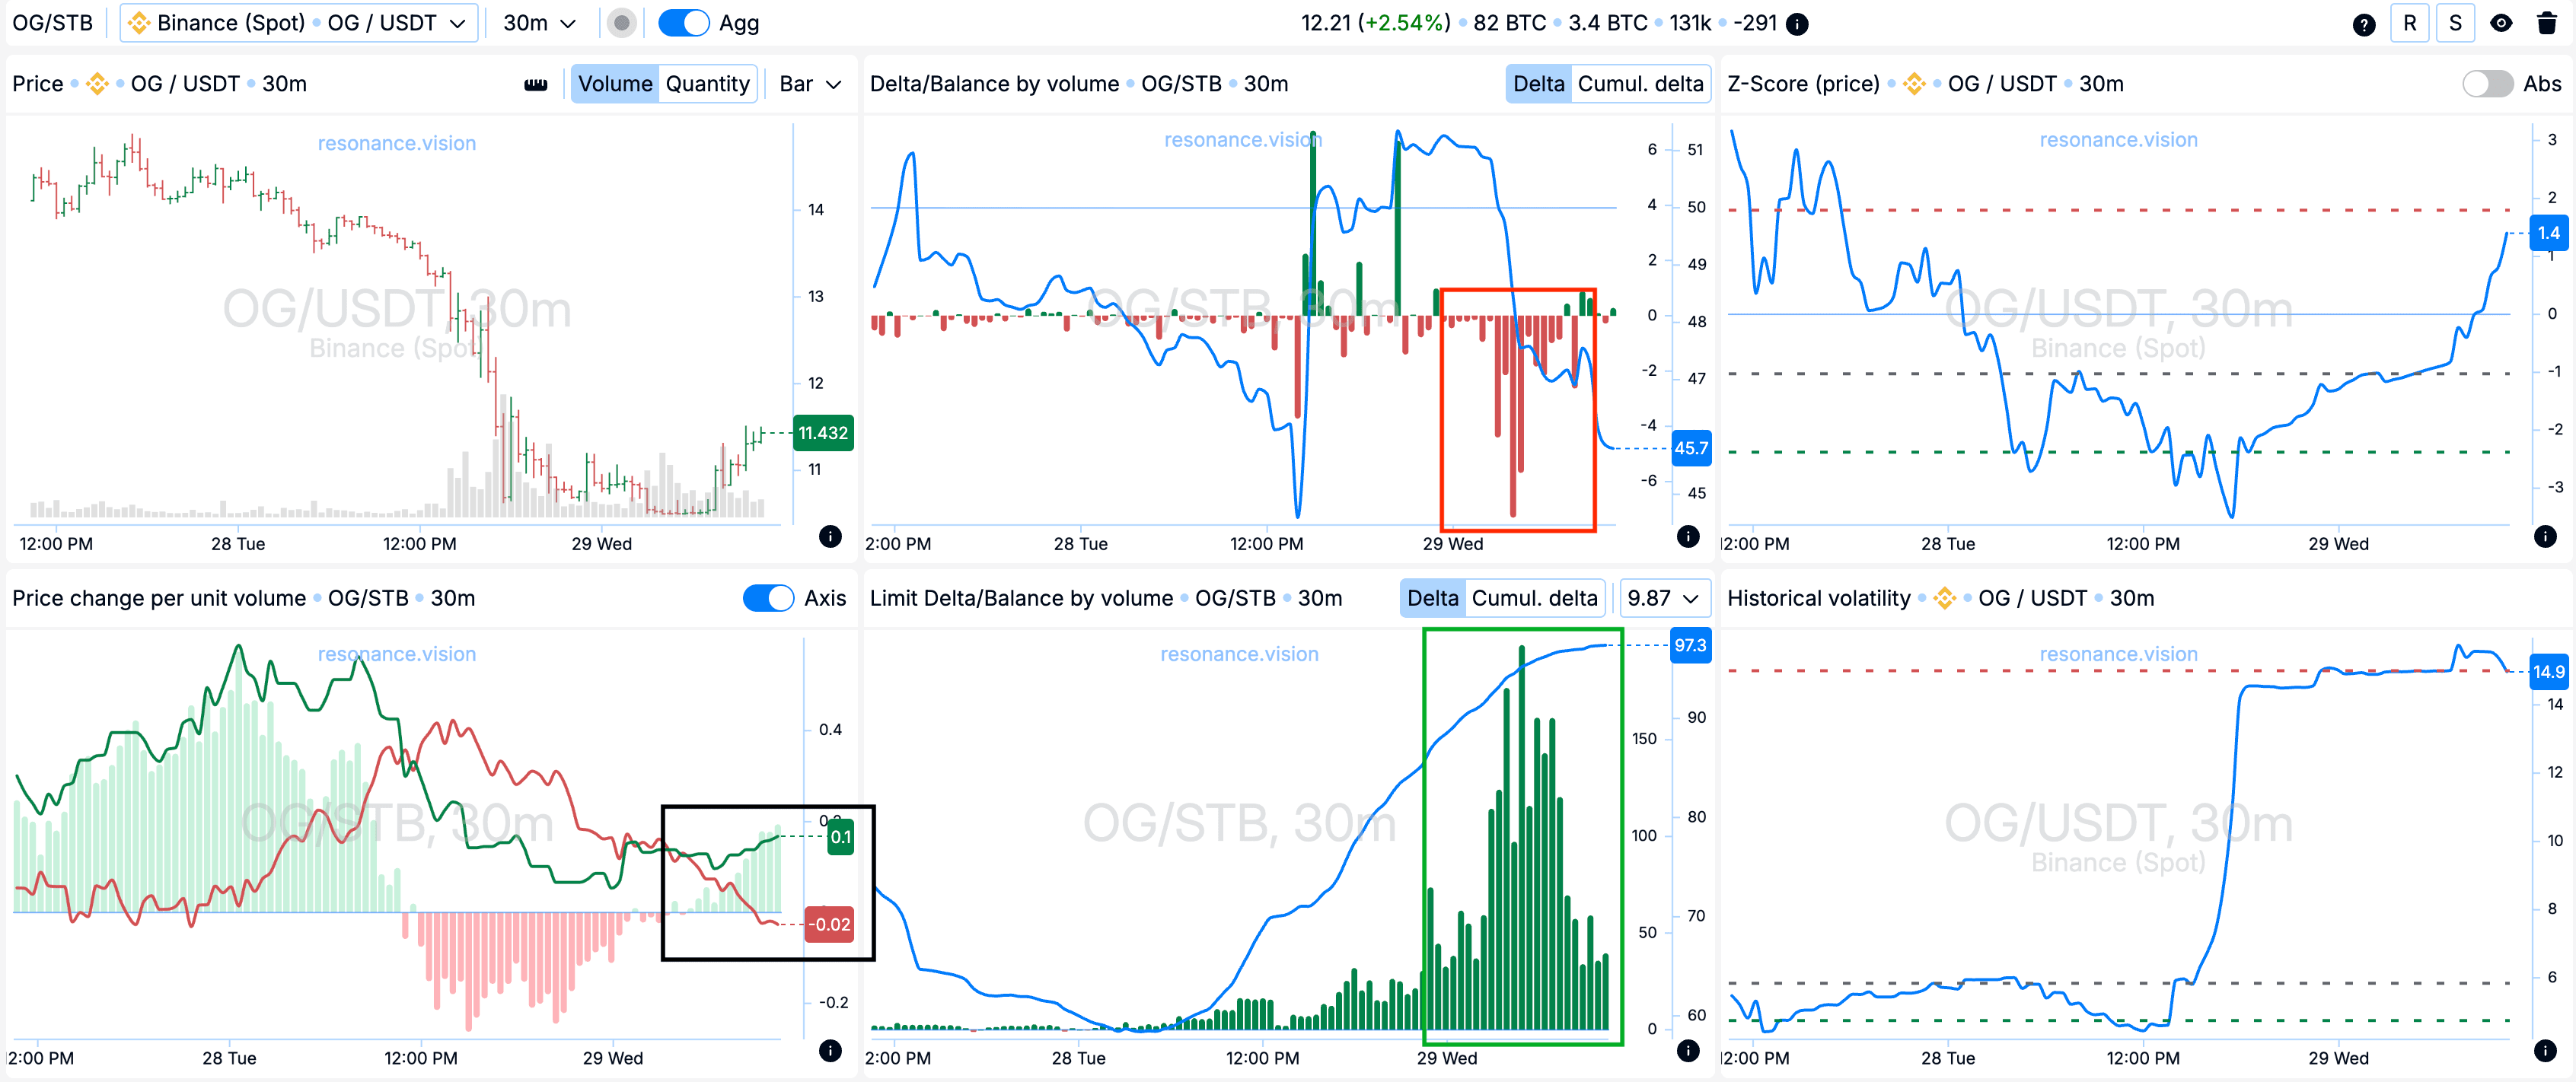
Дельта/Баланс за об’ємом та лімітна дельта: агреговані дані по всіх парах та біржах підтверджують картину, що спостерігається на кластерному графіку. У цей момент по ринку суттєво переважали об’єми продажів (червоний прямокутник), тоді як за лімітними заявками помітно збільшилася кількість заявок на купівлю (зелений прямокутник). Ці лімітні об’єми фактично поглинули весь ринковий об’єм продажу, що вказує на підтримку з боку лімітних заявок на купівлю та наявність локального дефіциту пропозиції.
Зміна ціни на одиницю об’єму: Ефективність впливу ринкових ордерів на ціну також почали розходитися на користь покупців (чорний прямокутник).
Причини виходу
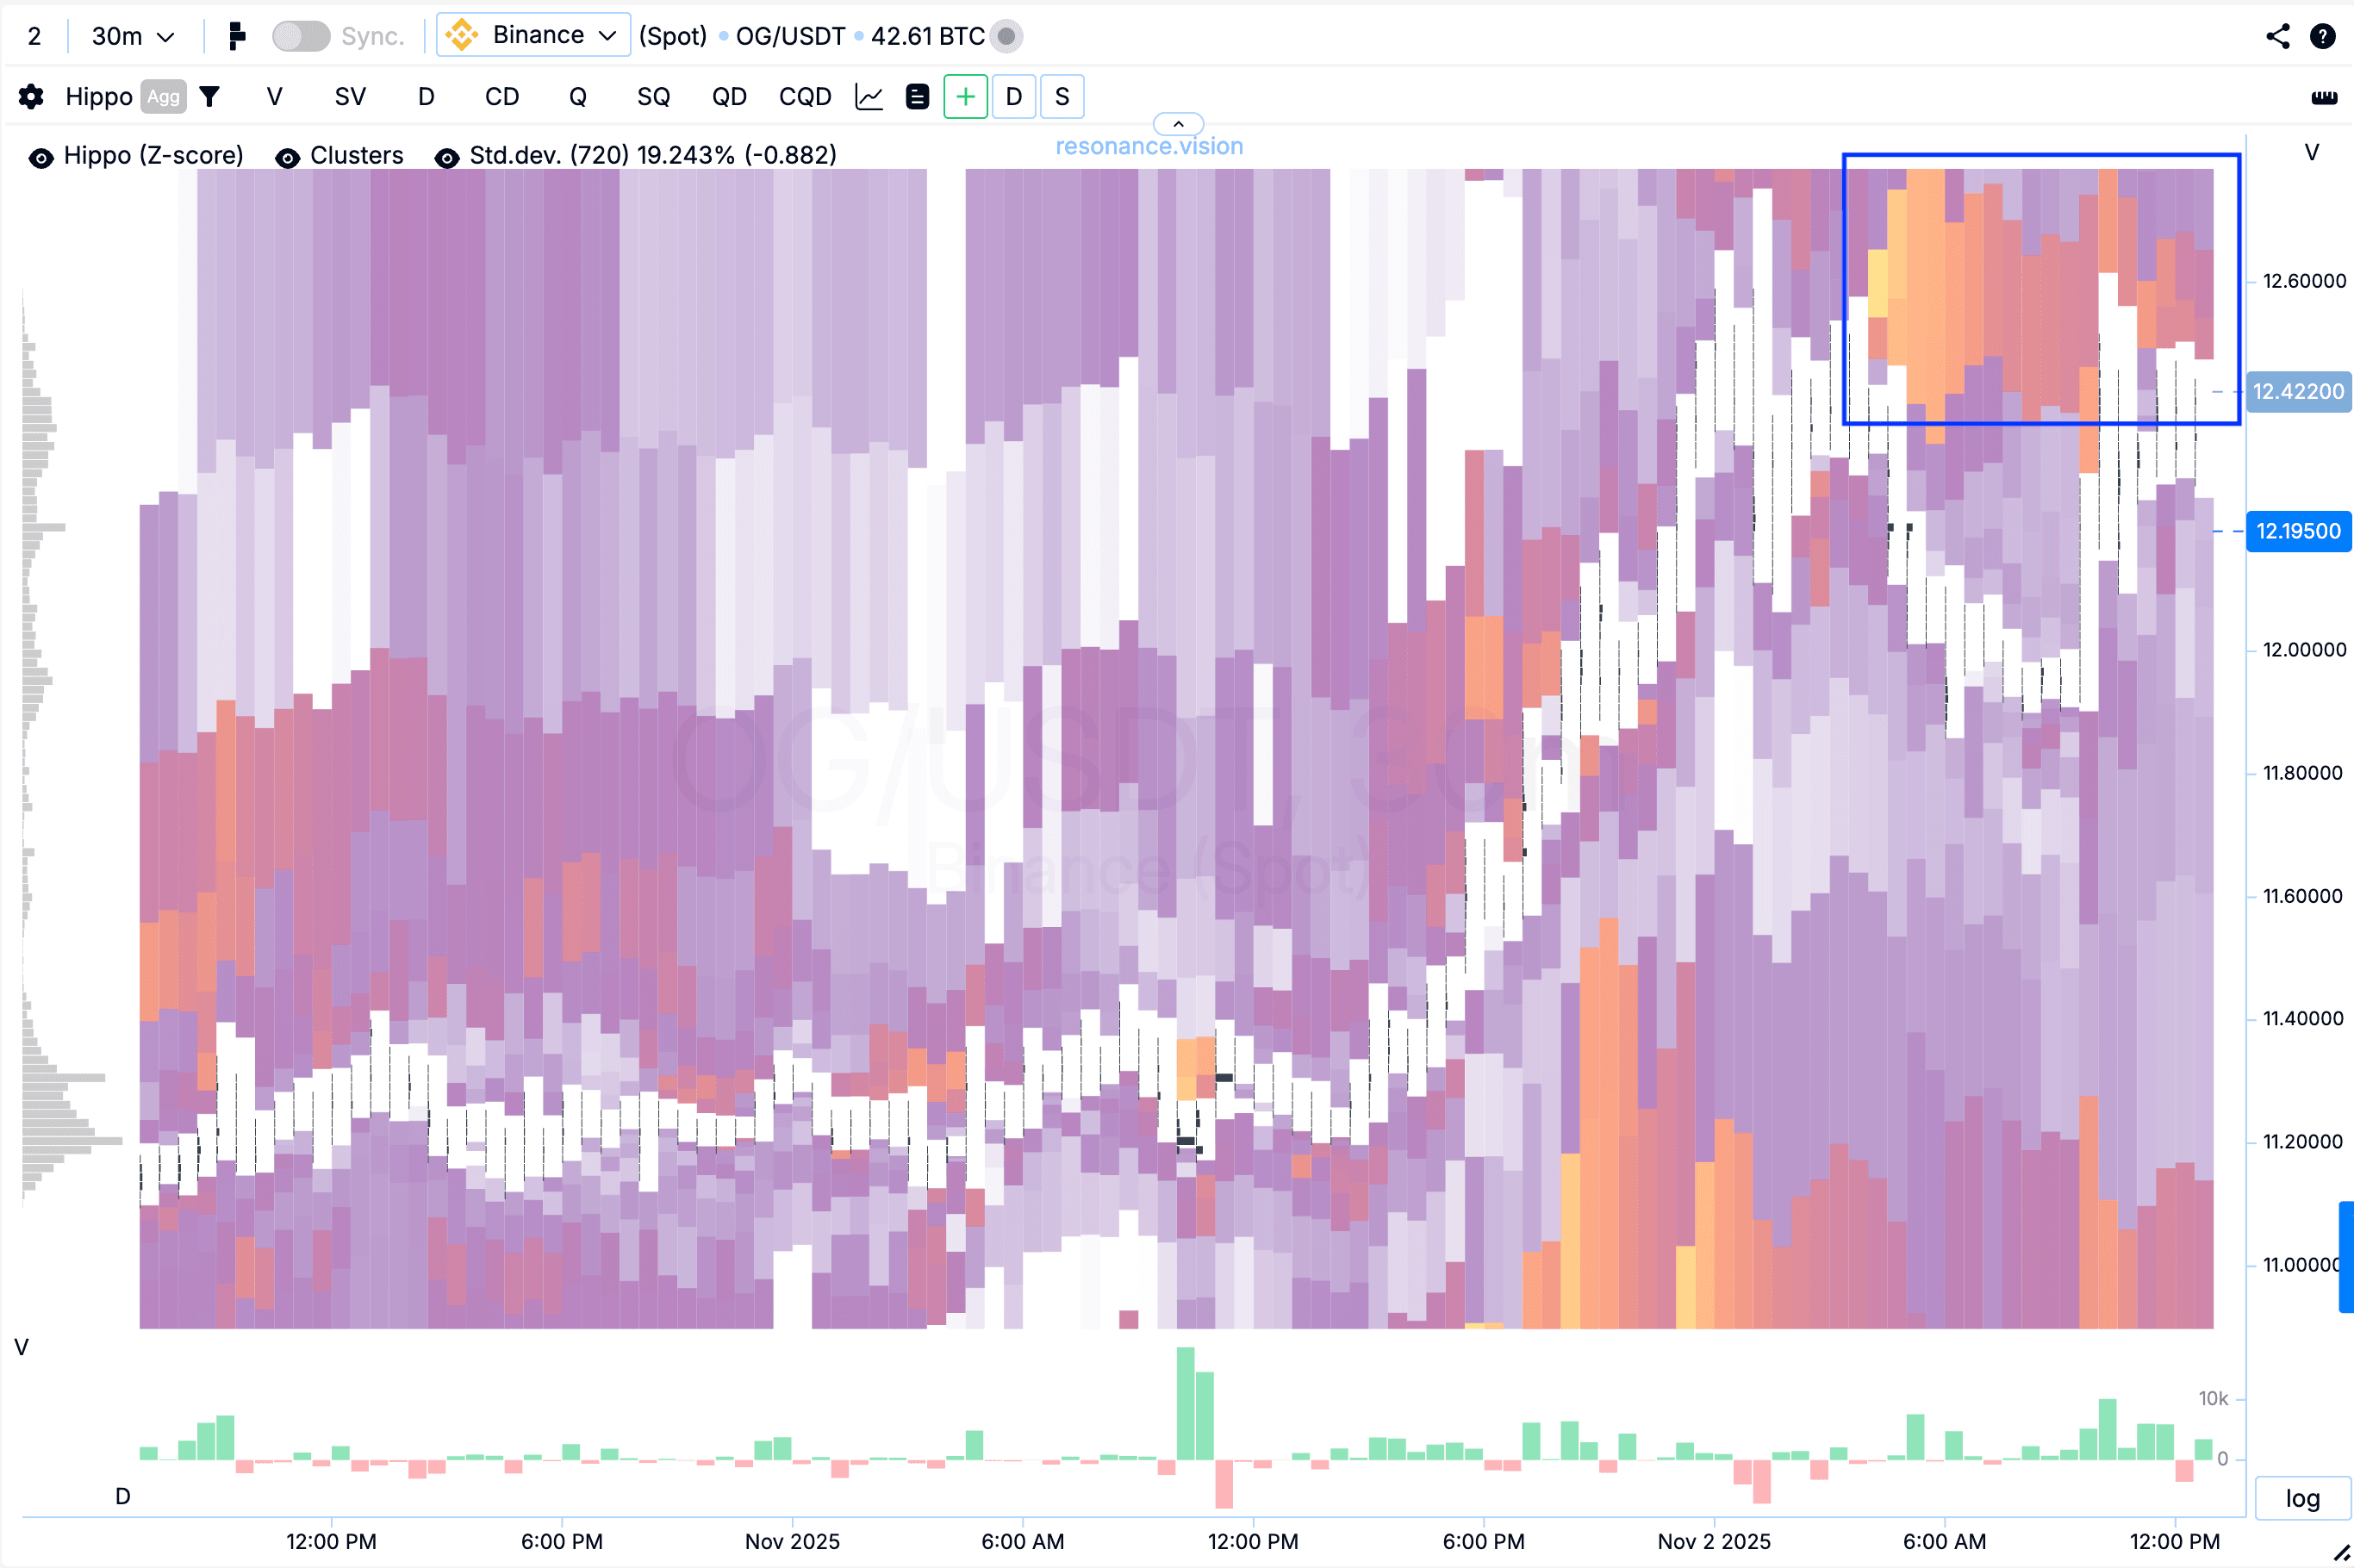
Теплова карта (Z-Score): у верхній частині з’явилися аномальні лімітні щільності на продаж (синій прямокутник), в які почали частково впиратися маркет-покупки. Така динаміка свідчить про появу опору з боку продавців. У подібних умовах рішення зафіксувати результат і не скупитися виглядає раціональним, оскільки такі щільності нерідко стають тригером для подальшого зниження ціни.
Підсумок
В результаті вдалося зафіксувати прибуток у розмірі 392,24%.
Висновок
Вхід у позицію було обґрунтовано поєднанням ознак локального дефіциту та активності лімітних покупок, що підтверджувалося як за кластерами, так і за агрегованими даними. Додаткові аргументи як зміщення ефективності ринкових ордерів на користь покупців посилювали ймовірність продовження зростання.
Подальший рух підтвердив коректність аналізу. Після появи аномальних лімітних скупчень на продаж ціна почала упиратися в лімітні заявки на продаж, і рішення зафіксувати прибуток виглядало максимально раціональним. Головне — не забувати про ризики: дисципліна та фіксація результату на дистанції завжди дають стійкий позитивний ефект.
Стеж за новими статтями у нашому телеграм каналі.
Не треба вигадувати складних схем та шукати “грааль”. Використовуйте інструменти платформи Resonance.
Реєструйся за посиланням - отримуй бонус і починай заробляти:
OKX | BingX | KuCoin.
Промокод TOPBLOG дає тобі 10% знижки на будь-який тарифний план Resonance.
Рекомендовані статті


