OG +62.3% (Направленная стратегия Resonance)

OG/USDT 📊 Доминирование маркет-продаж без обновления минимума и признаки локального дефицита. Подтверждение через дельту и Z-Score. Импульсное движение +60% и фиксация прибыли на росте волатильности.
Содержание

Монета: OG/USDT
Риск: средний
Уровень понимания: новичок
Причины входа
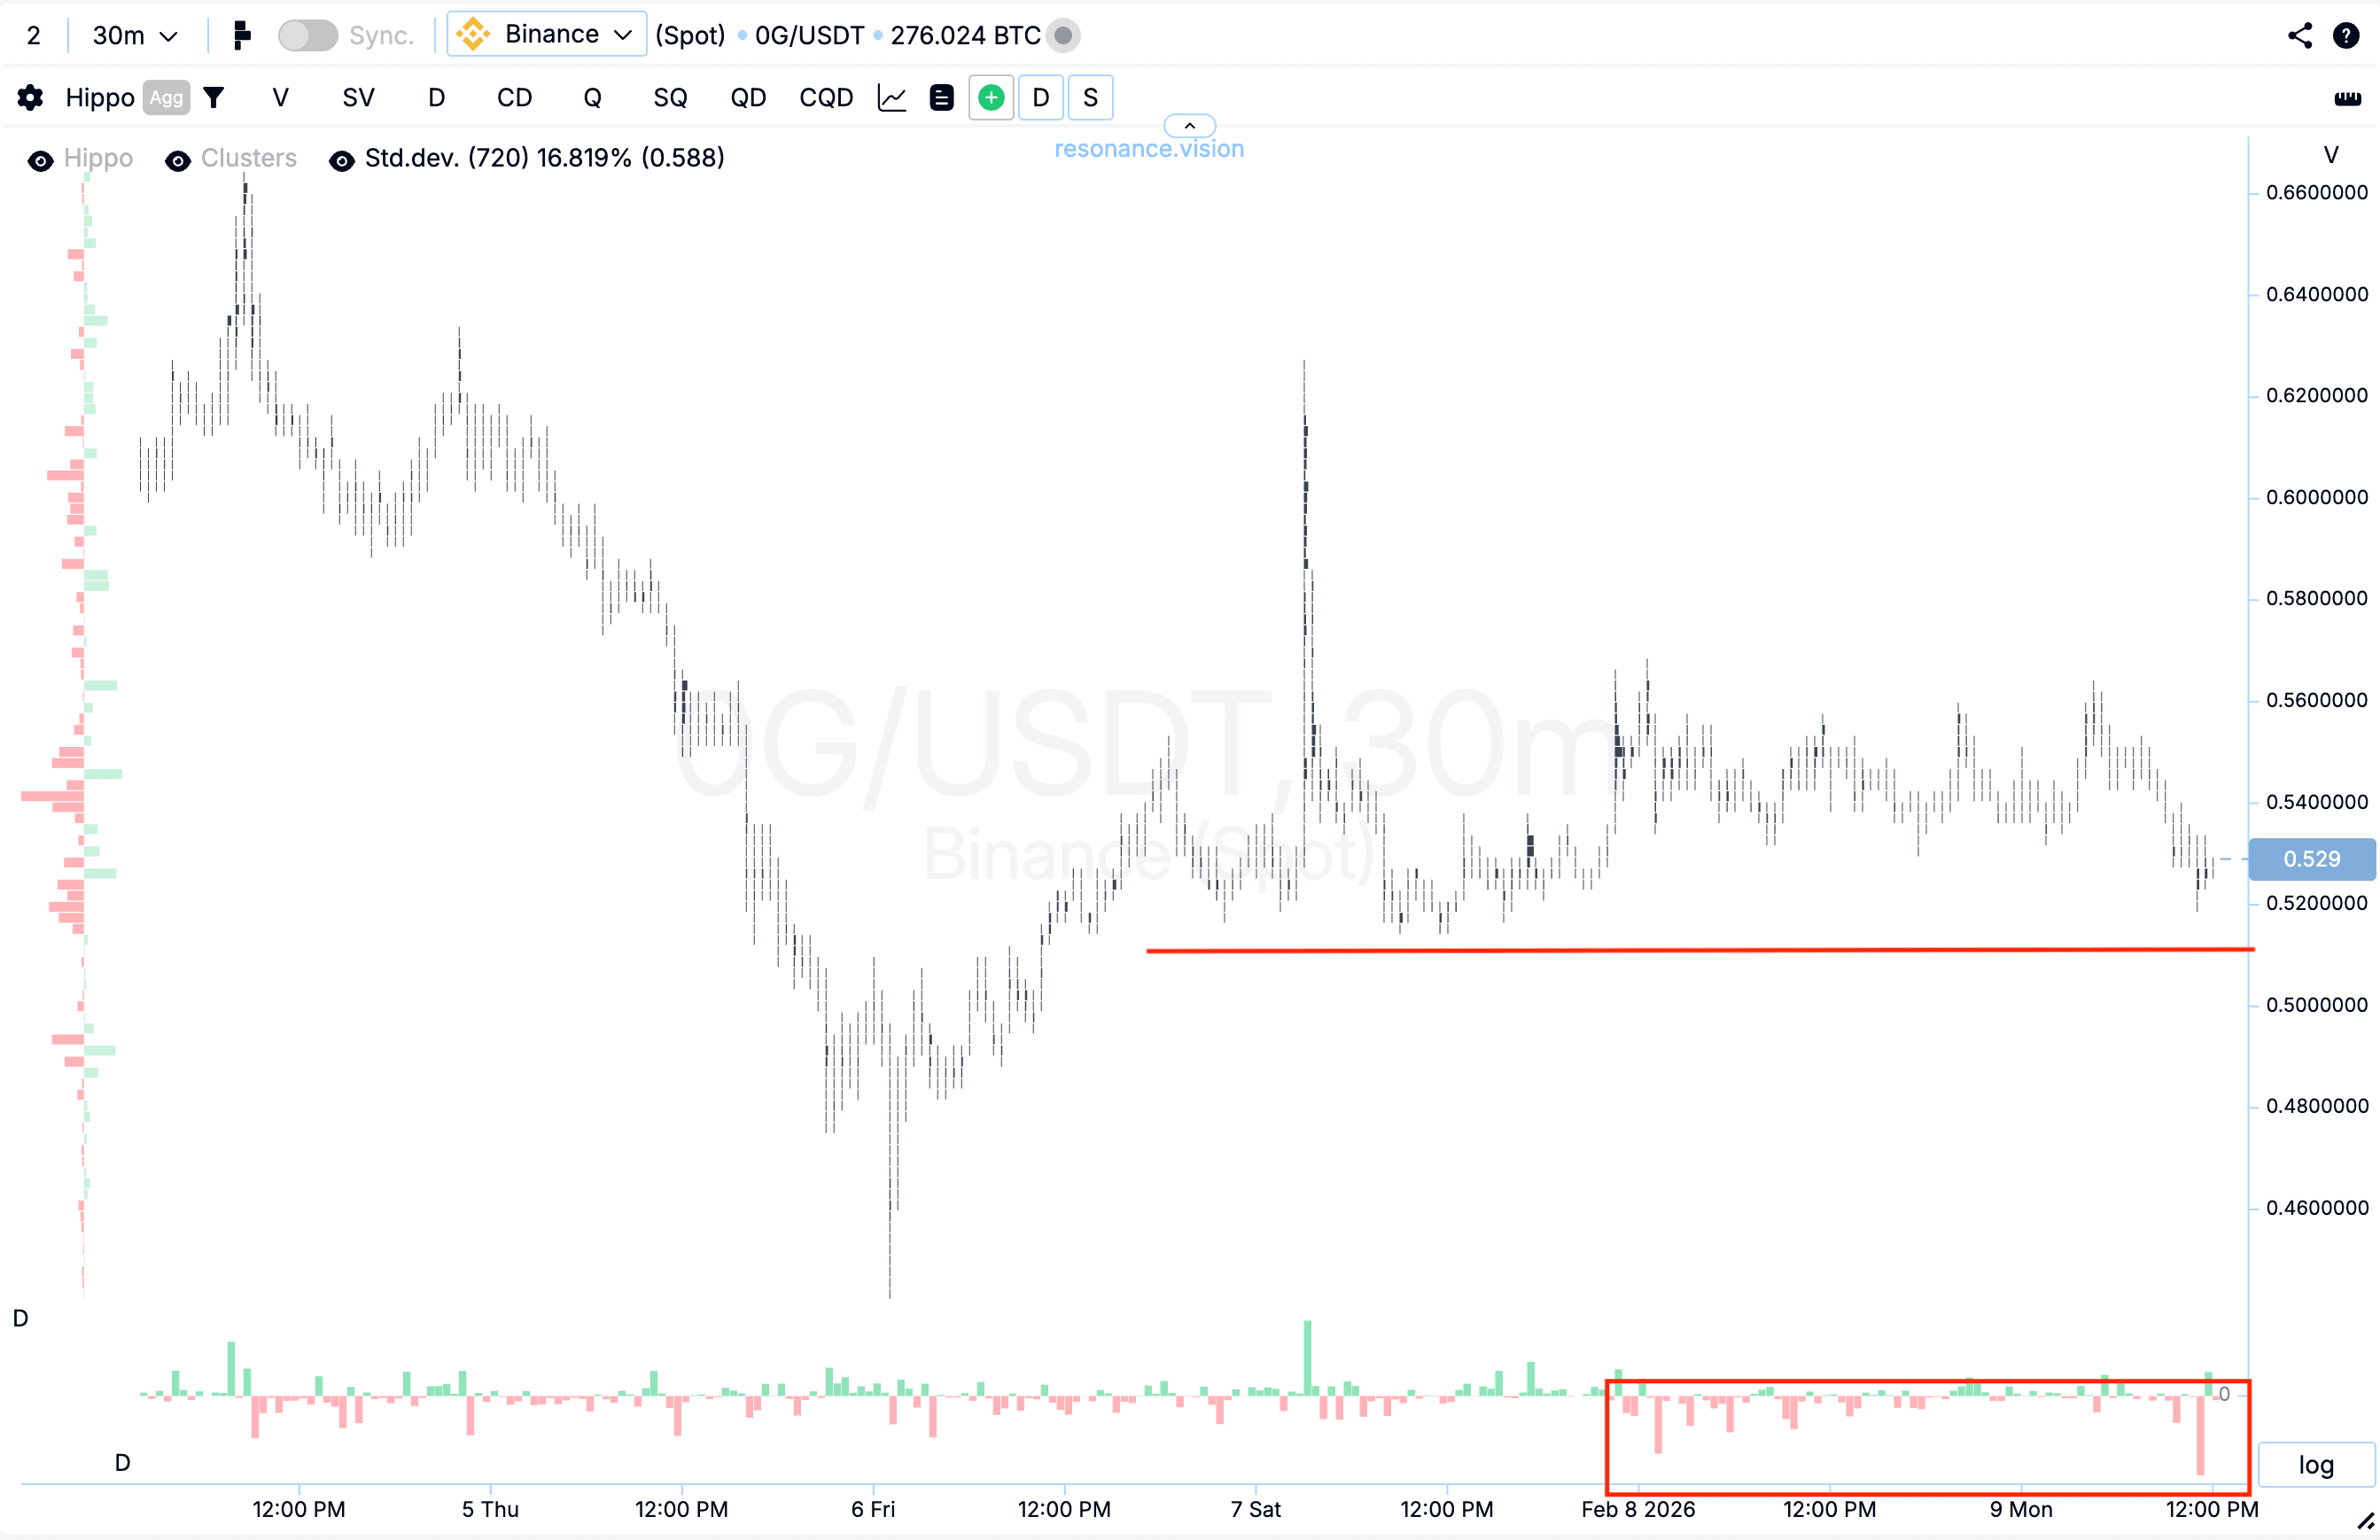
Кластерный график: в локальной фазе бокового движения наблюдалось выраженное давление со стороны маркет-ордеров на продажу - это отчётливо видно по гистограмме дельты (красный прямоугольник).
Однако, несмотря на усиливающееся давление, цена перестала обновлять локальный минимум (красная линия). Это означает, что продавцы продолжают расходовать объём, но их воздействие на цену становится неэффективным.
Подобная реакция указывает на признаки локального дефицита: рынок перестаёт снижаться даже при доминировании продаж, что часто становится триггером о возможной смены инициативы.
В Дешборде
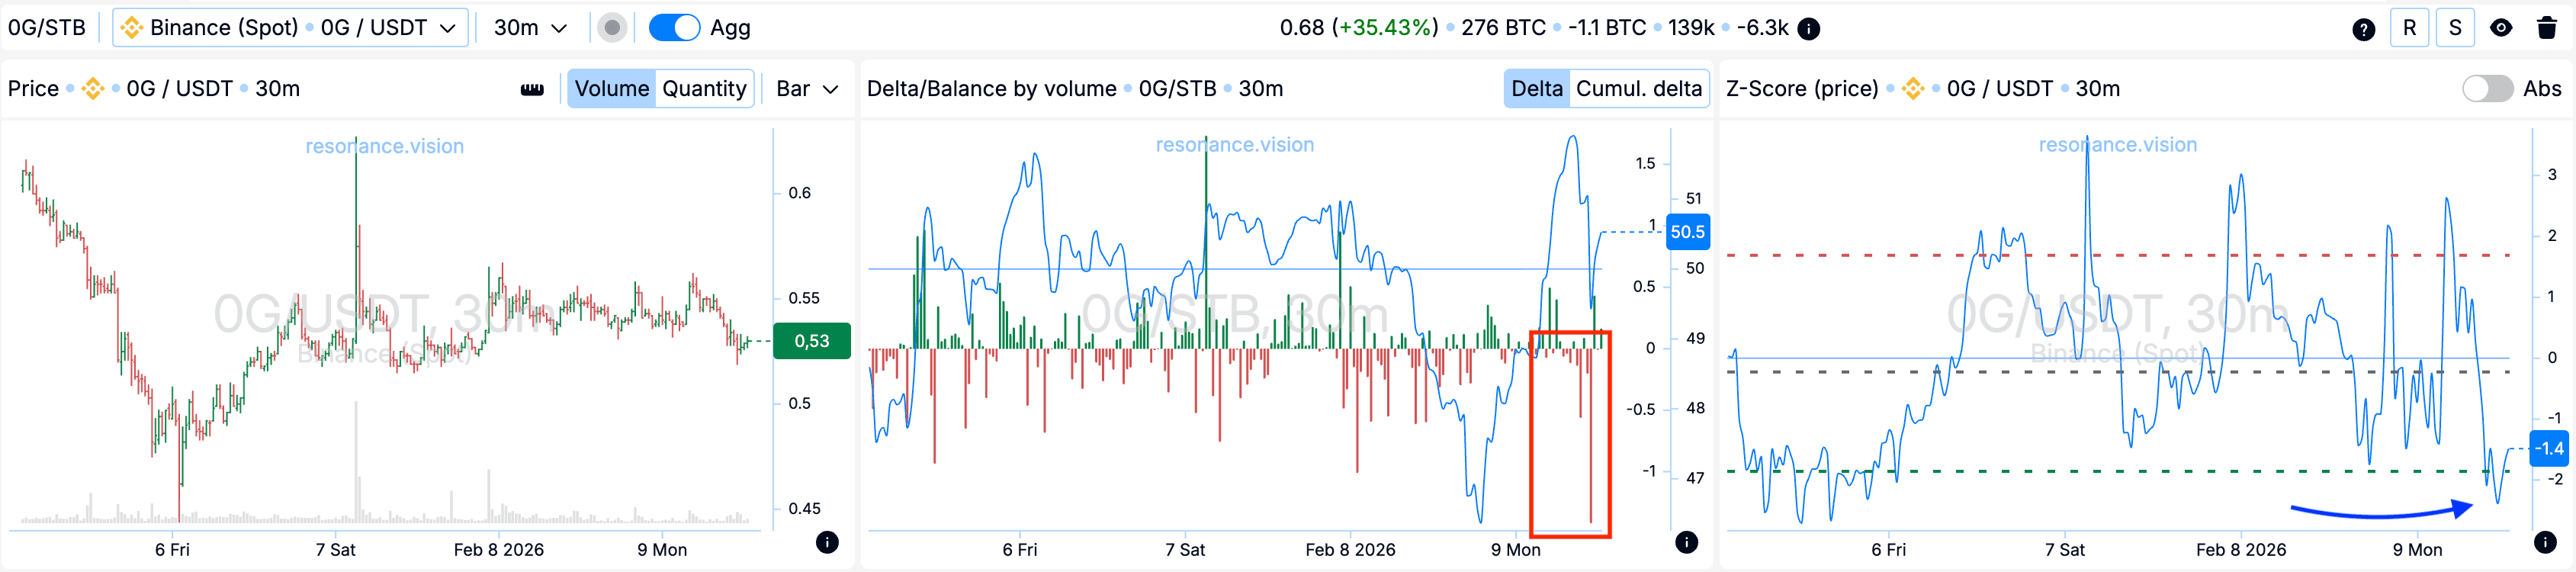
Дельта / Баланс по объёму: агрегированные данные по всем парам и биржам подтверждают картину с кластерного графика. В рассматриваемый период объёмы рыночных продаж существенно увеличились и превышали значения за весь предыдущий видимый диапазон (красный прямоугольник на гистограмме дельты).
При этом цена не демонстрировала соответствующего движения вниз. Это указывает на активность лимитных покупателей, которые поглощают входящий маркет-объём продаж. Такая структура формирует локальную поддержку и дополнительно подтверждает ослабление давления со стороны продавцов.
Z-Score (цена): дополнительно на пике было зафиксировано отклонение цены вниз более чем на 2 стандартных отклонения (синяя стрелка). Подобные статистически аномальные значения часто сопровождаются остановкой движения или формированием локального разворота, что усиливает обоснованность точки входа.
Причины выхода
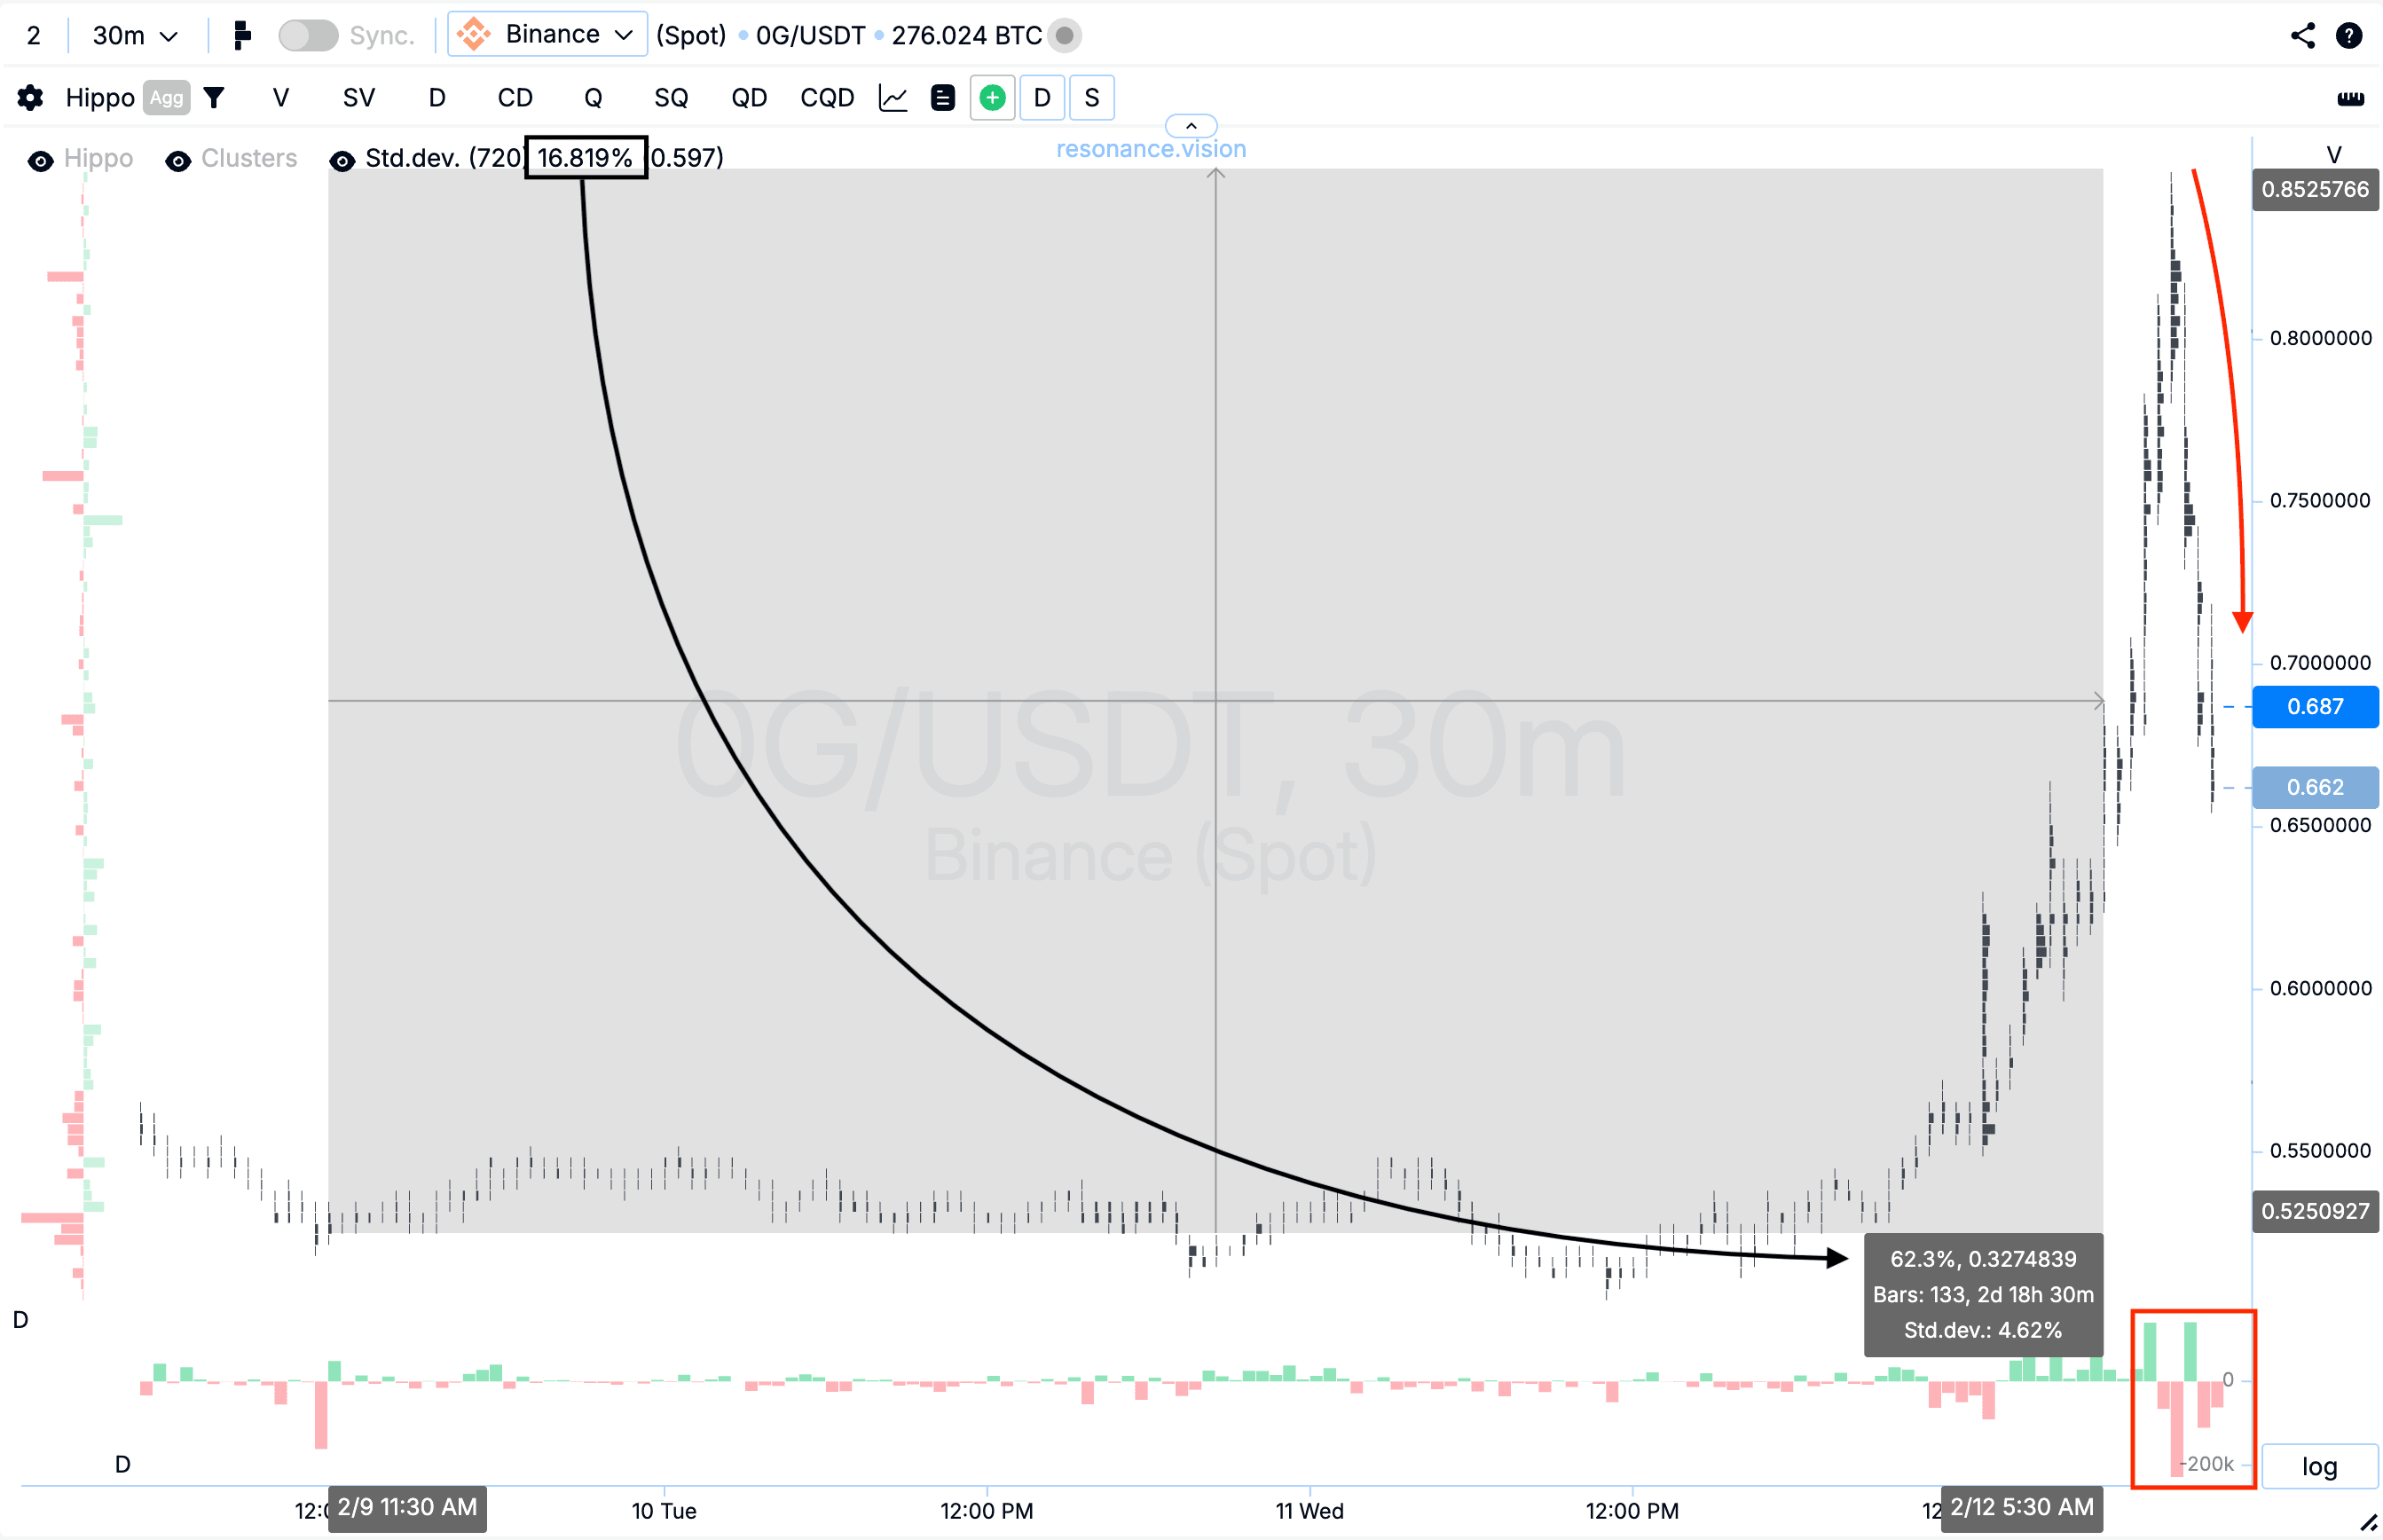
Кластерный график: после точки входа цена выросла более чем на 60%, что соответствует примерно четырём стандартным движениям (чёрный прямоугольник и стрелка).
В этом диапазоне заметно возросла волатильность, после чего сформировался откат, а покупки начали постепенно уступать место продавцам.
В условиях повышенной волатильности и признаков ослабления покупателей дальнейшее удержание позиции сопровождалось бы ростом риска. Поэтому фиксация прибыли в данной зоне выглядела наиболее логичным и взвешенным решением с точки зрения управления позицией.
Заключение
Данный разбор по OG/USDT показывает, что важен не сам факт доминирования объёма, а реакция цены на него. Несмотря на существенное давление маркет-продаж, цена перестала обновлять минимумы, что указывало на снижение эффективности продавцов и формирование локального дефицита.
Дополнительное подтверждение через агрегированные данные и статистическое отклонение (Z-Score) усилило обоснованность входа. Выход был осуществлён после сильного импульсного движения и роста волатильности, когда структура начала меняться в сторону увеличения риска.
Именно сочетание объёма, реакции цены и статистики позволяет находить качественные возможности даже на базовом уровне понимания рынка.
Следи за новыми статьями в нашем телеграм канале.
Не нужно выдумывать сложных схем и искать “грааль”. Используй инструменты платформы Resonance.
Регистрируйся по ссылке — получай бонус и начинай зарабатывать:
OKX | BingX | KuCoin.
Промокод TOPBLOG дает тебе 10% скидки на любой тарифный план Resonance.
Рекомендуемые статьи


