OGN +35,3% (Напрямкова стратегія Резонанс)

Розбір угоди щодо OGN/USDT: як розпізнати локальний дефіцит на кластерному графіку та вчасно зафіксувати прибуток. У цій угоді вдалося забрати рух понад 35%, уникаючи ризиків на тлі зростання волатильності та об’ємного продажу.
Зміст

Монета: OGN/USDT
Ризик: низький
Рівень розуміння: новачок
Причини входу
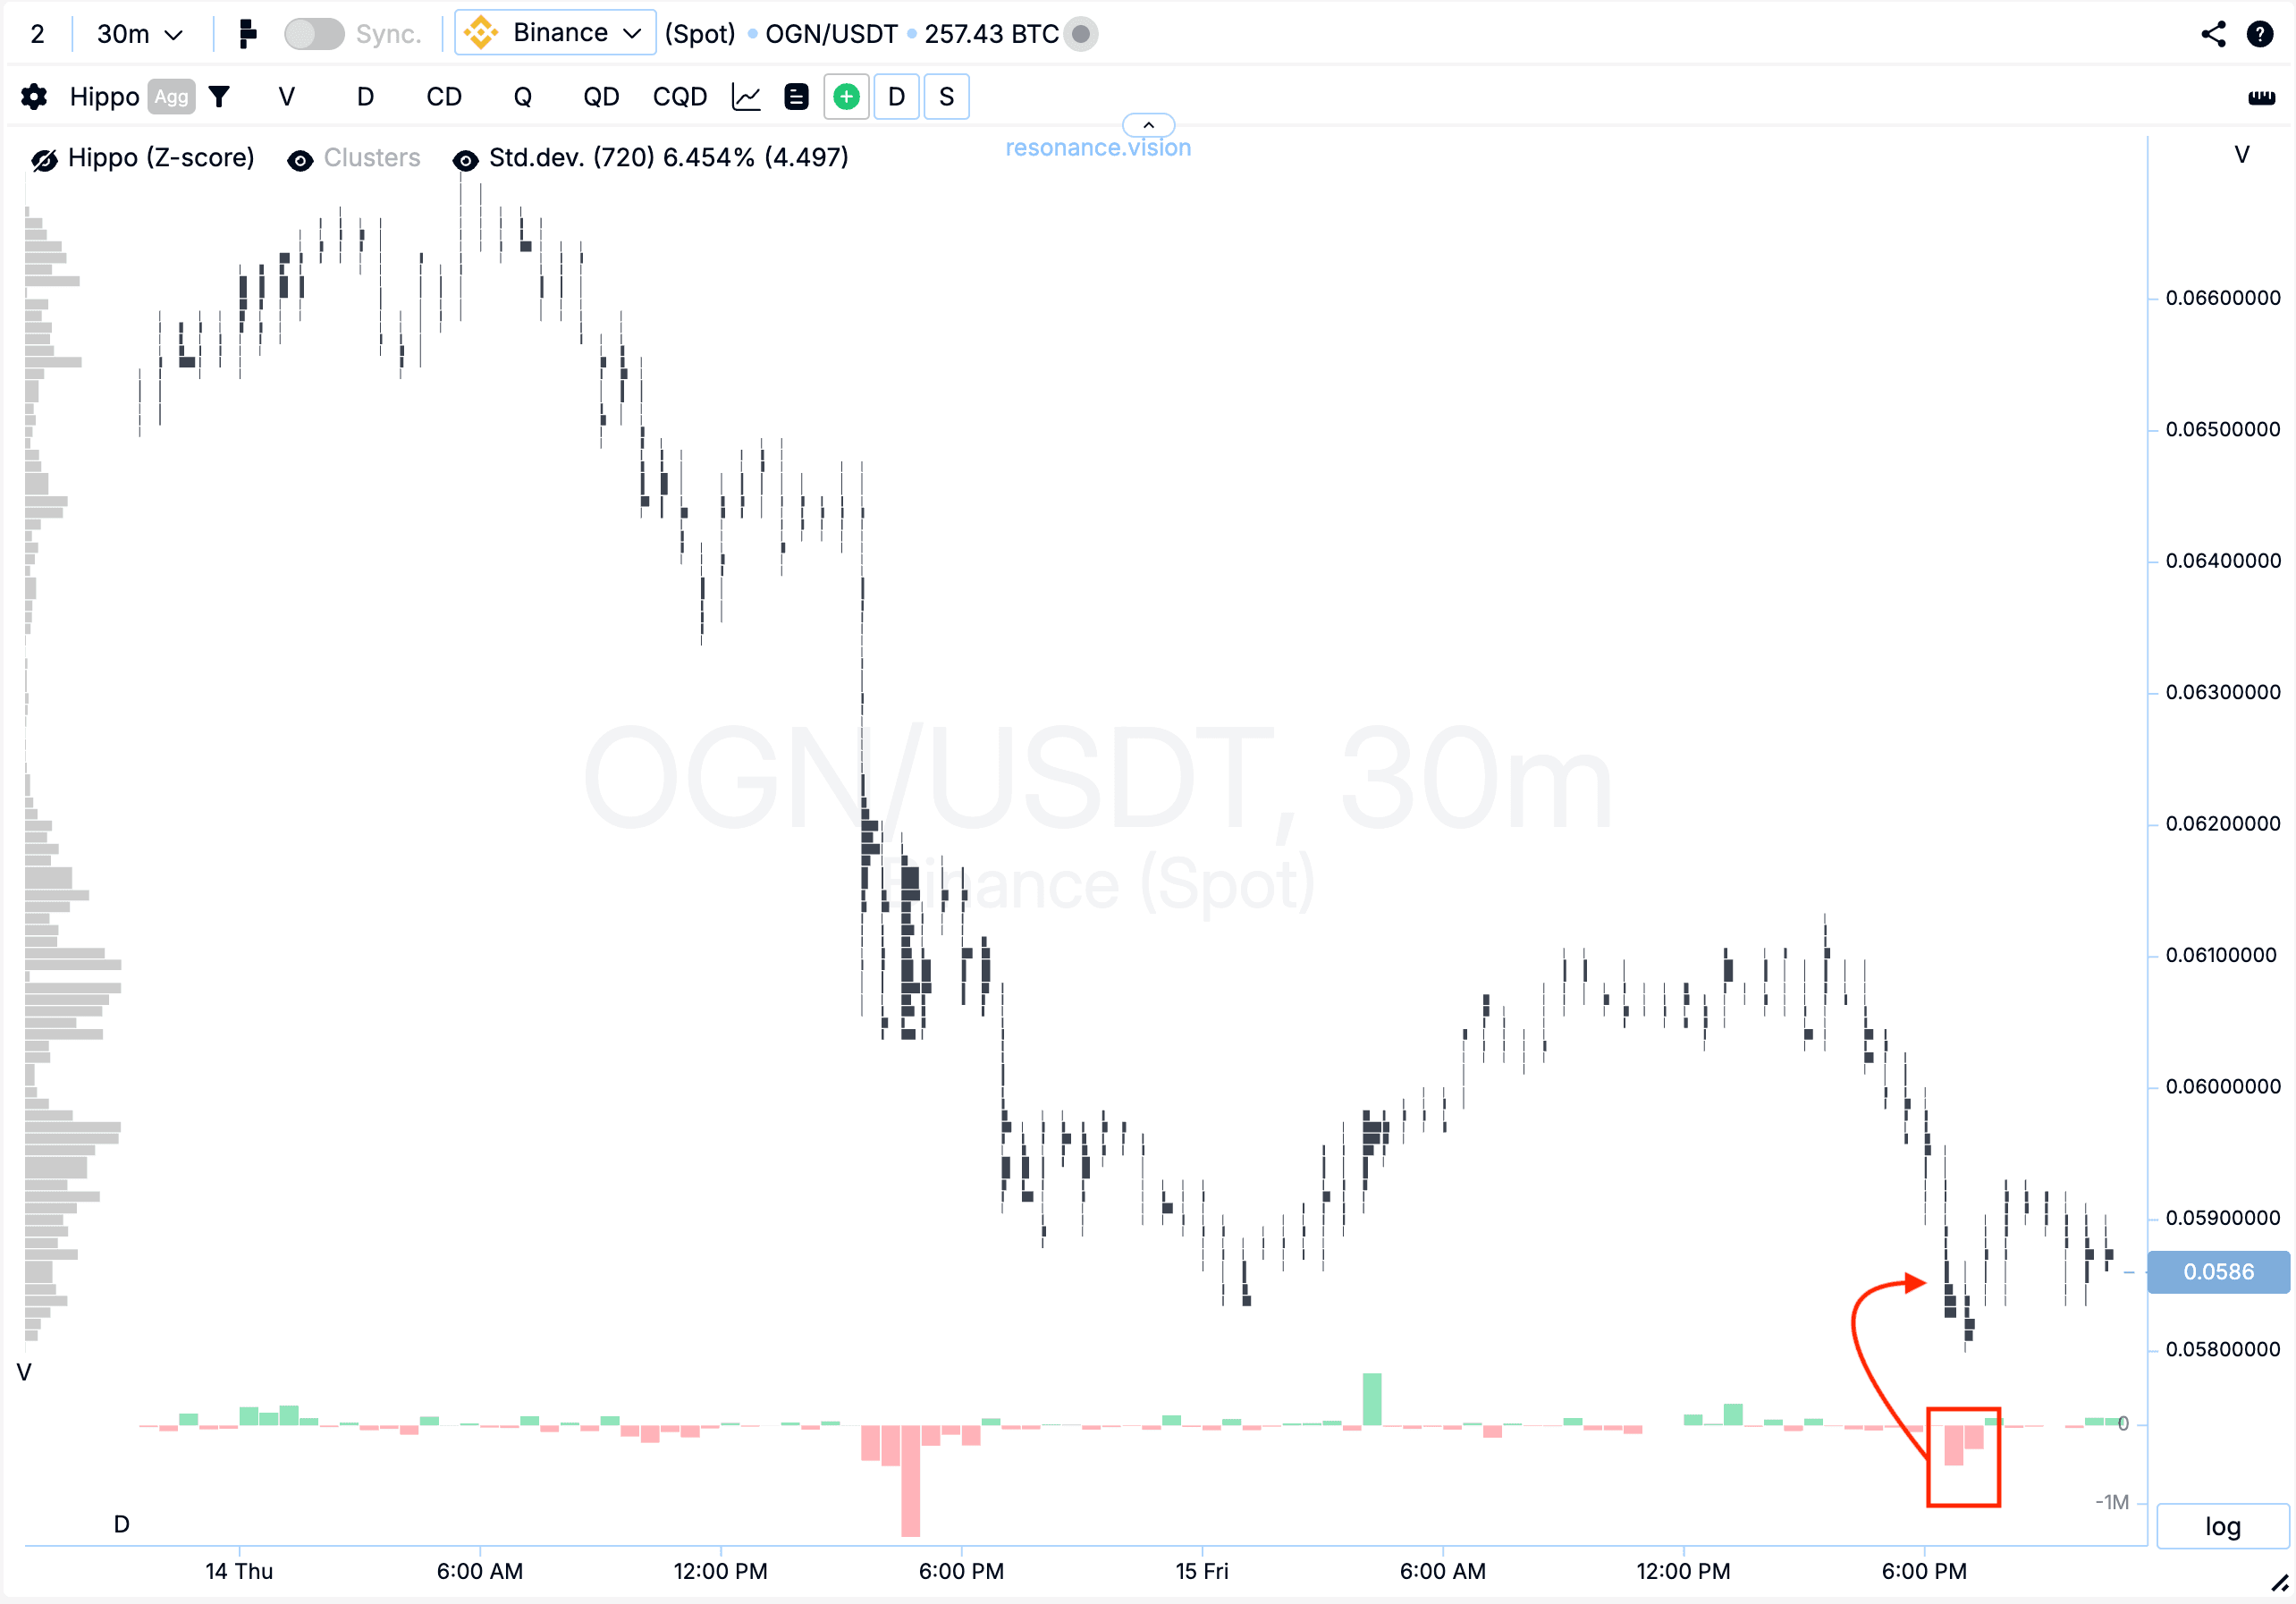
Кластерний графік: Утворилася W-подібна формація, в якій на повторних об’ємних продажах (червоний прямокутник та стрілка) ціна практично не оновила локальний мінімум. Це може вказувати на формування локального дефіциту та ослаблення тиску з боку продавців.
У Дешборді
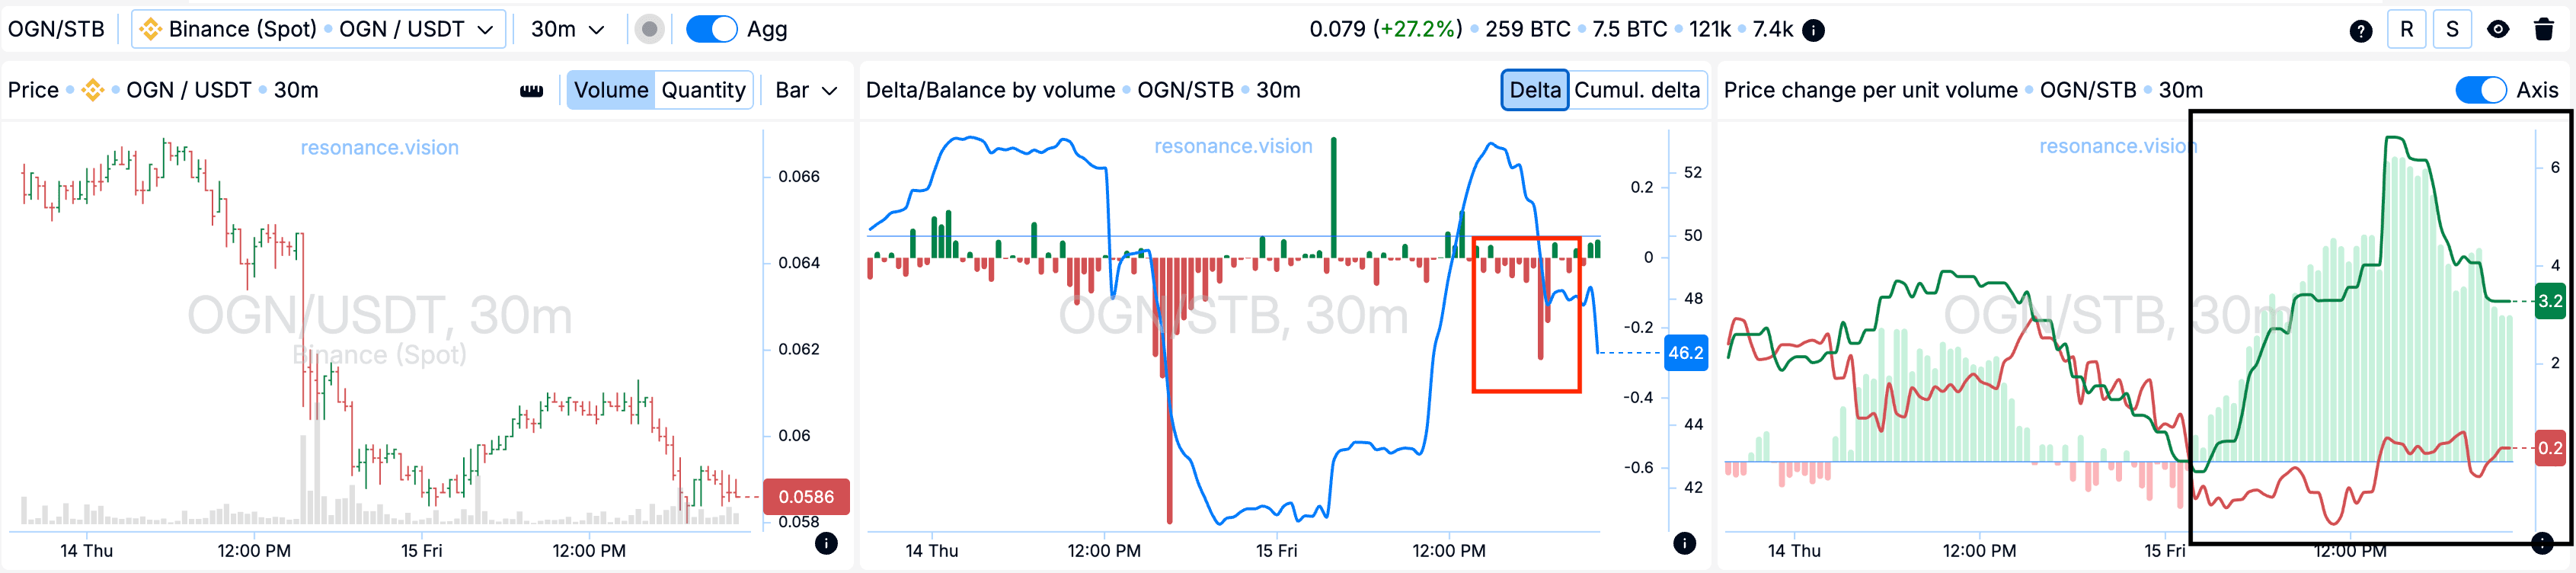
Дельта/Баланс за об’ємом: За агрегованими даними в цей момент також спостерігається явне переважання ринкових продажів - це чітко видно на гістограмі дельти (червоний прямокутник).
Зміна ціни на одиницю об’єму: Незважаючи на тиск з боку продавців, ефективність впливу ринкових ордерів залишається на користь покупців — це візуально помітно на графіку (чорний прямокутник).
Причини виходу
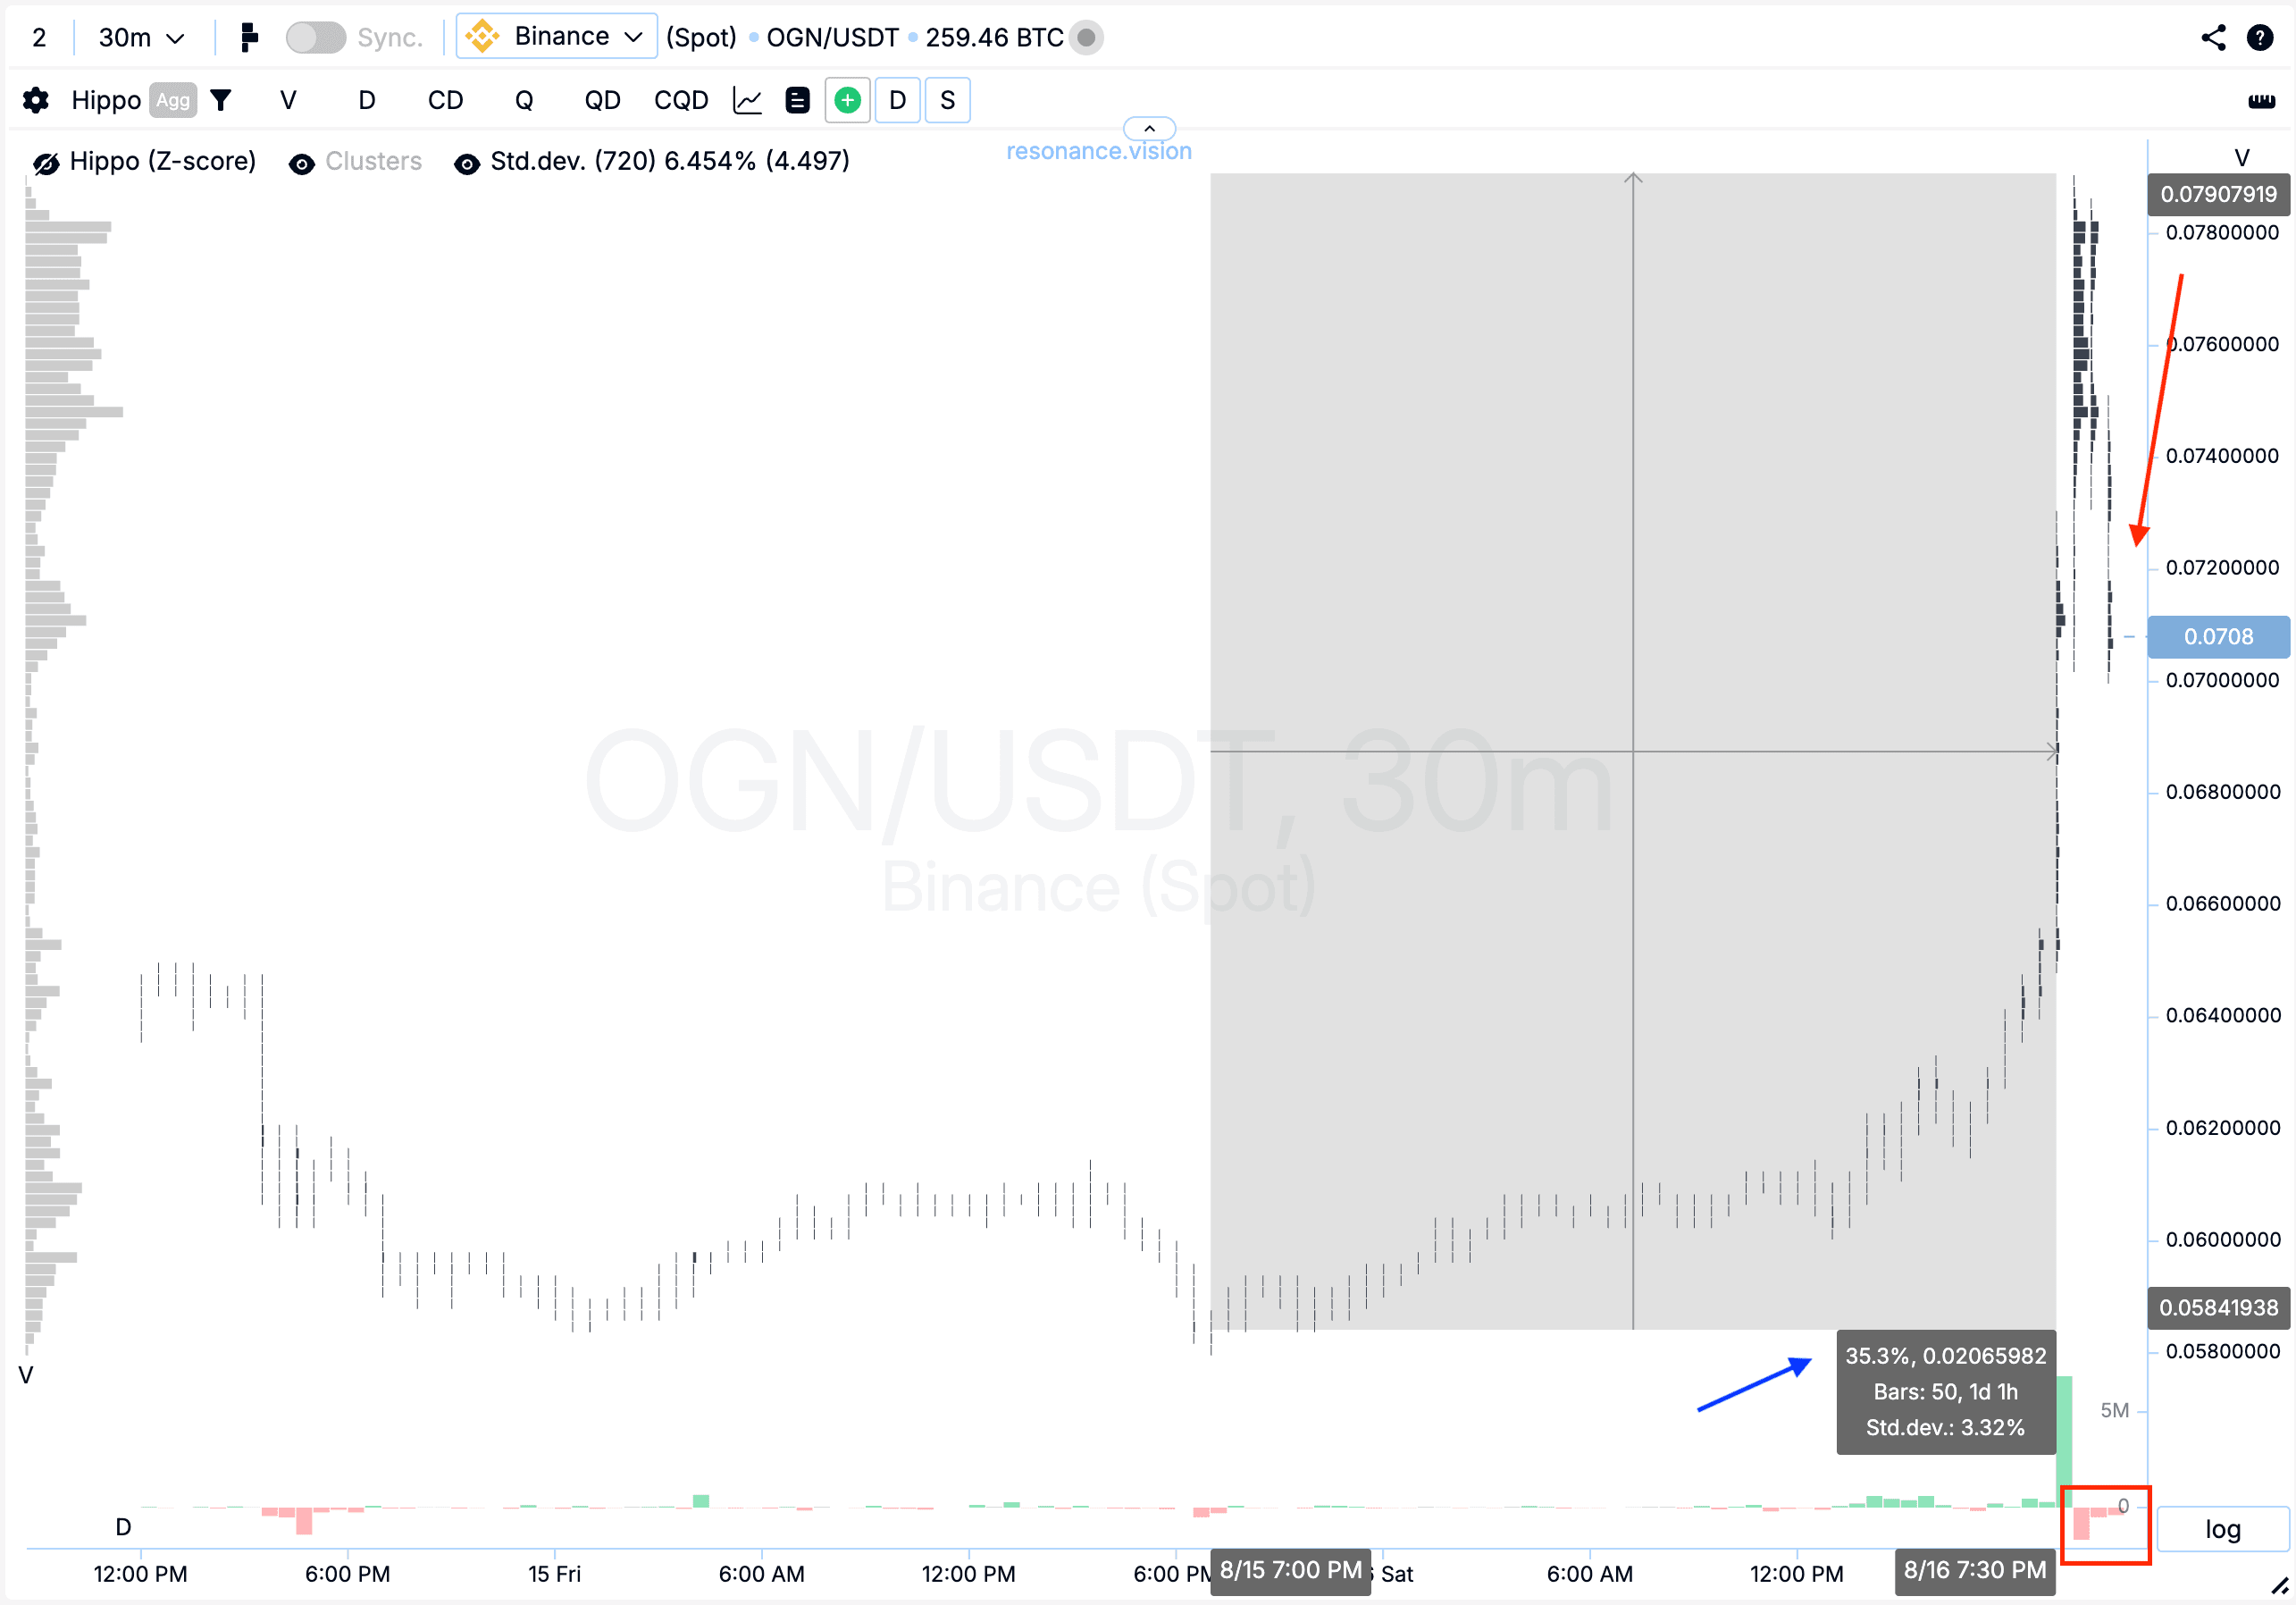
Кластерний графік: З моменту входу ціна показала значний рух - понад 35%, при цьому помітно зросла волатильність, що виразно видно по крайніх кластерних барах.
Однак подальші об’ємні ринкові продажі спровокували значний відкат (червоний прямокутник і стрілка), що підвищує ризик подальшого утримання позиції.
Висновок
Угода з OGN/USDT показала себе результативною: вхід був підтверджений ознаками локального дефіциту та ослабленням ініціативи продавців. Незважаючи на зростання волатильності при появі об’ємного ринкового продажу, позиція була своєчасно зафіксована, що дозволило уникнути зайвих ризиків. Для новачків цей приклад наочно демонструє, як важливо не лише знаходити точки входу, а й вчасно фіксувати прибуток з огляду на зростання ринкової активності.
Стеж за новими статтями у нашому телеграм каналі.
Не треба вигадувати складних схем та шукати “грааль”. Використовуйте інструменти платформи Resonance.
Реєструйся за посиланням - отримуй бонус і починай заробляти:
OKX | BingX | KuCoin.
Промокод TOPBLOG дає тобі 10% знижки на будь-який тарифний план Resonance.
Рекомендовані статті


