PENGO +31.7% (Направленная стратегия Resonance)

Мы рассмотрели точку входа через признаки локального дефицита на снижении, а также подтвердили их по агрегированным данным. Проанализировали момент потери эффективности продавцов, переход инициативы к покупателям и оценили динамику. Отдельно разобрали фазу выхода - увеличение волатильности, снижение эффективности покупок и достижение аномального ценового движения. Отличный пример того, как сочетание кластерного анализа и метрик эффективности помогает принимать взвешенные решения в сделках.
Содержание

Монета: PENGO/USDT
Риск: средний
Уровень понимания: новичок
Причины входа
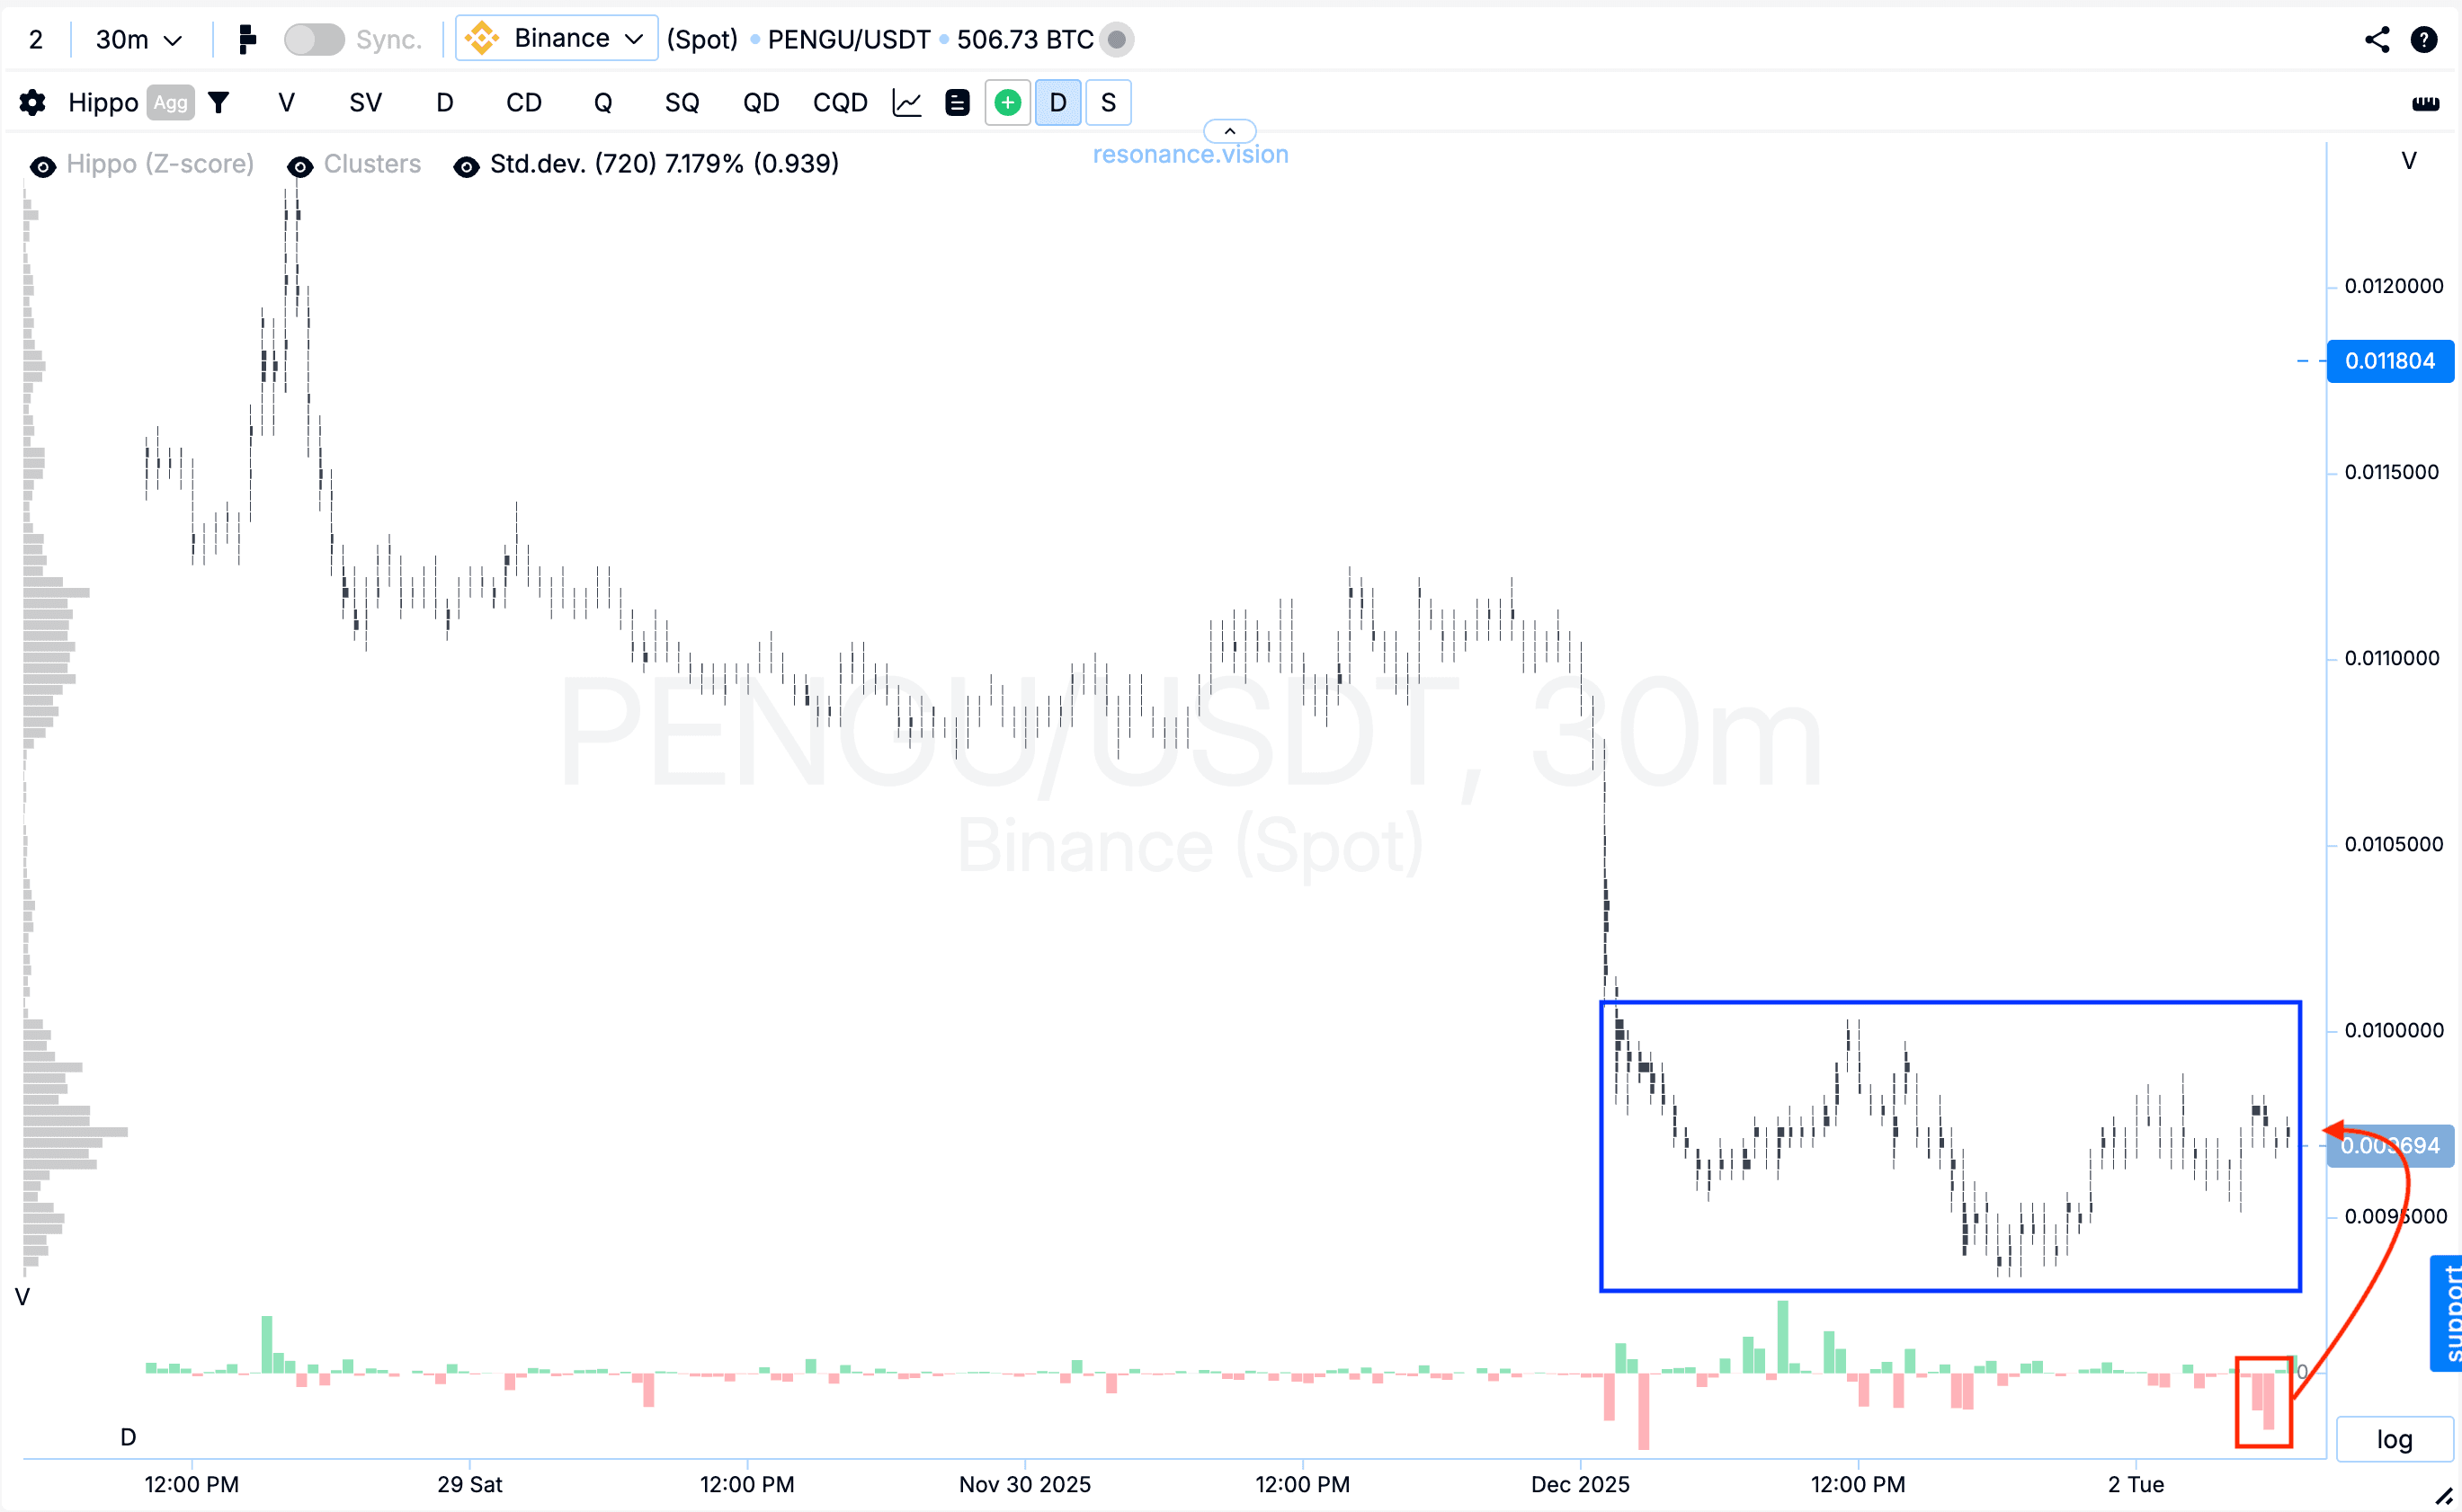
Кластерный график: во время снижения начали формироваться кластера по объёму (синий прямоугольник), внутри которых повторные маркет-продажи уже не давали ожидаемого эффекта и не продавлили цену дальше вниз (красный прямоугольник и стрелка). Такая динамика говорит о появлении локального дефицита и явном ослаблении давления со стороны продавцов.
В Дешборде
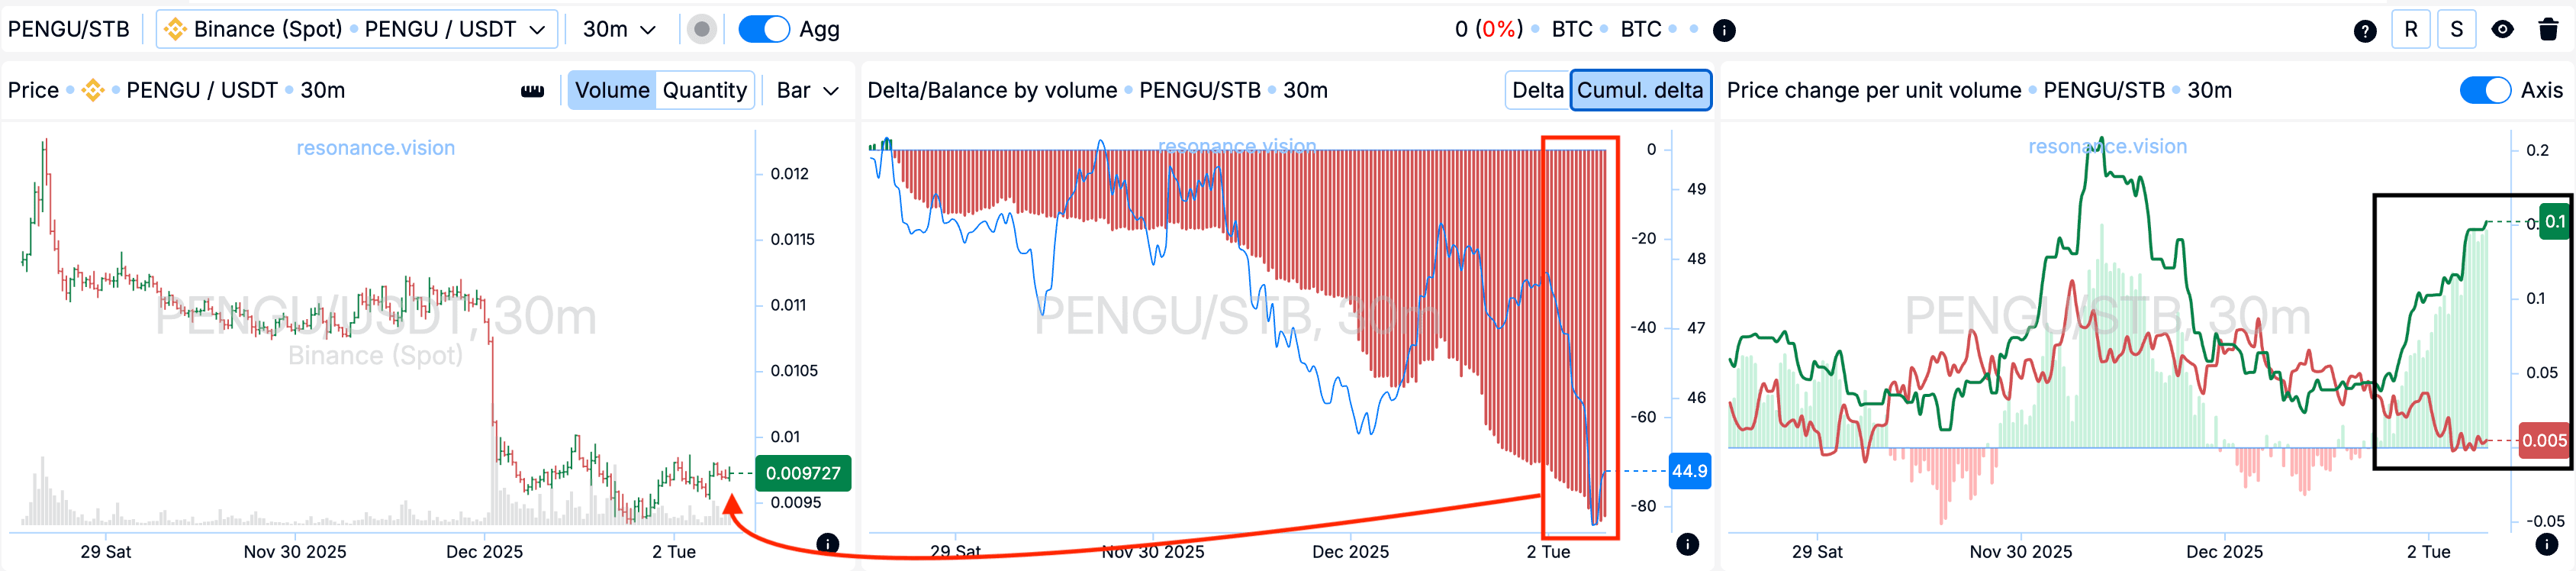
Дельта / Баланс по объёму: по агрегированным данным по всем парам и биржам видно, что в этот период объёмы рыночных продаж увеличивались - это хорошо отражено на гистограмме кумулятивной дельты (красный прямоугольник и стрелка). Однако при усилении продаж цена больше не снижалась. Такая реакция рынка показывает готовность лимитных покупателей принимать весь исходящий маркет-объём, что формирует локальную поддержку и подтверждает ослабление давления со стороны продавцов.
Изменение цены на единицу объёма: дополнительно видно, что эффективность воздействия рыночных ордеров разошлась в пользу покупателей (чёрный прямоугольник), что указывает на рост эффективности покупок.
Причины выхода
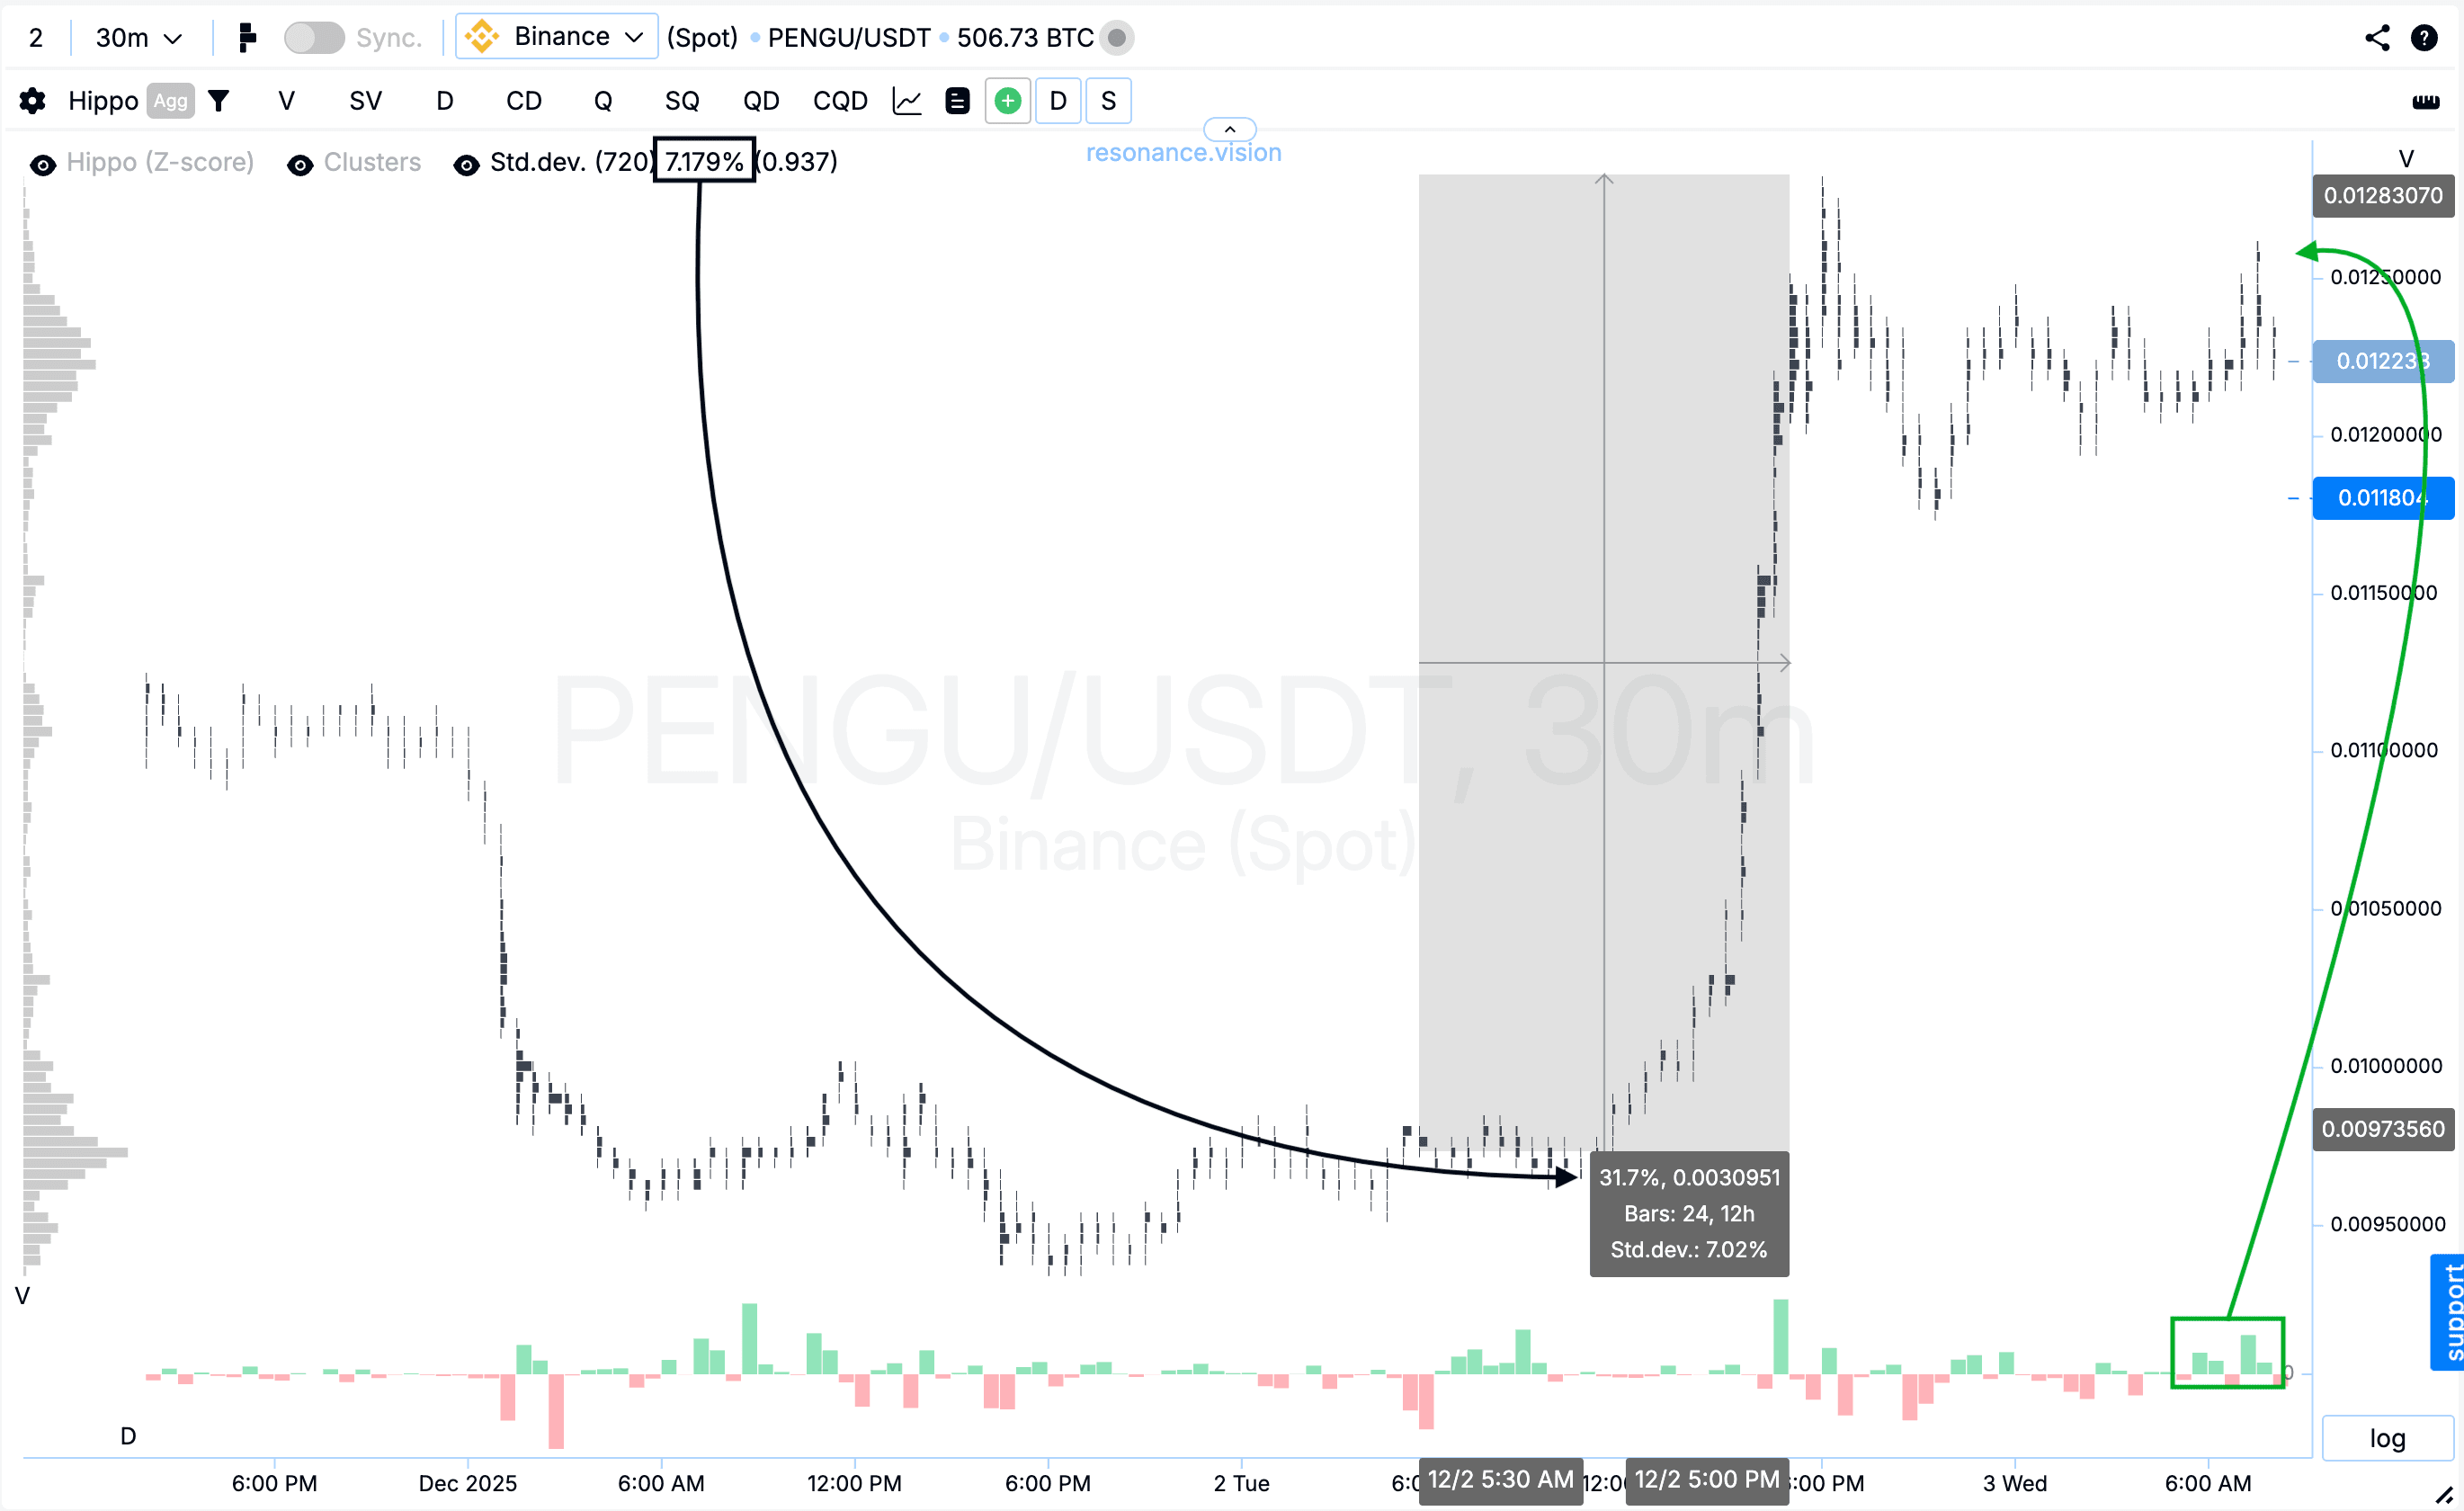
Кластерный график: после входа цена выросла ещё на 31,7%, и в этом ценовом диапазоне заметно усилилась волатильность. На фоне такого движения последующие маркет-покупки перестали давать результат - цена больше не росла (зелёный прямоугольник и стрелка). Дополнительно стоит отметить, что это движение почти достигло 5 стандартных отклонений, при том что одно стандартное отклонение для актива составляет 7,179% (чёрный прямоугольник и стрелка). Такое движение уже относится к значительным и аномальным. В подобных условиях дальнейшее удержание позиции только повышало бы риски, поэтому фиксация прибыли была наиболее взвешенным и логичным решением.
Заключение
Сделка получилась хорошим примером того, как грамотное сочетание кластерного анализа и агрегированных данных помогает зайти в рынок в момент ослабления продавцов и выйти тогда, когда покупательская эффективность начинает падает.
На снижении мы заметили локальный дефицит: повторные маркет-продажи перестали оказывать давление на цену, что и стало ключевым сигналом для входа.
Рост подтвердил правильность идеи, однако по мере развития движения начали появляться первые признаки снижения эффективности покупателей: волатильность выросла, покупки перестали давить на цену, а само движение стало аномально большим по сравнению со стандартными отклонениями. В такой фазе риск разворота значительно возрастает.
Фиксация в этот момент выглядела оптимальным решением - спокойная, дисциплинированная работа по системе. Такой подход позволяет не только находить качественные точки входа, но и стабильно сохранять результат.
Следи за новыми статьями в нашем телеграм канале.
Не нужно выдумывать сложных схем и искать “грааль”. Используй инструменты платформы Resonance.
Регистрируйся по ссылке — получай бонус и начинай зарабатывать:
OKX | BingX | KuCoin.
Промокод TOPBLOG дает тебе 10% скидки на любой тарифный план Resonance.
Рекомендуемые статьи


