PHB +15,2% (Направленная стратегия Resonance)

PHB/USDT — сделка с акцентом на неэффективность продавцов и смену инициативы.
Несмотря на явное преобладание рыночных продаж, цена не снижалась — а позже начала расти даже на небольших объёмах покупок. Это стало отправной точкой для входа в лонг. Сделка завершена после роста более чем на 15% — почти два стандартных отклонения. Отличный пример того, как слабая реакция цены на объёмы может стать сильным сигналом для разворота.
Содержание

Монета: PHB/USDT
Риск: средний
Уровень понимания: новичок
Причины входа
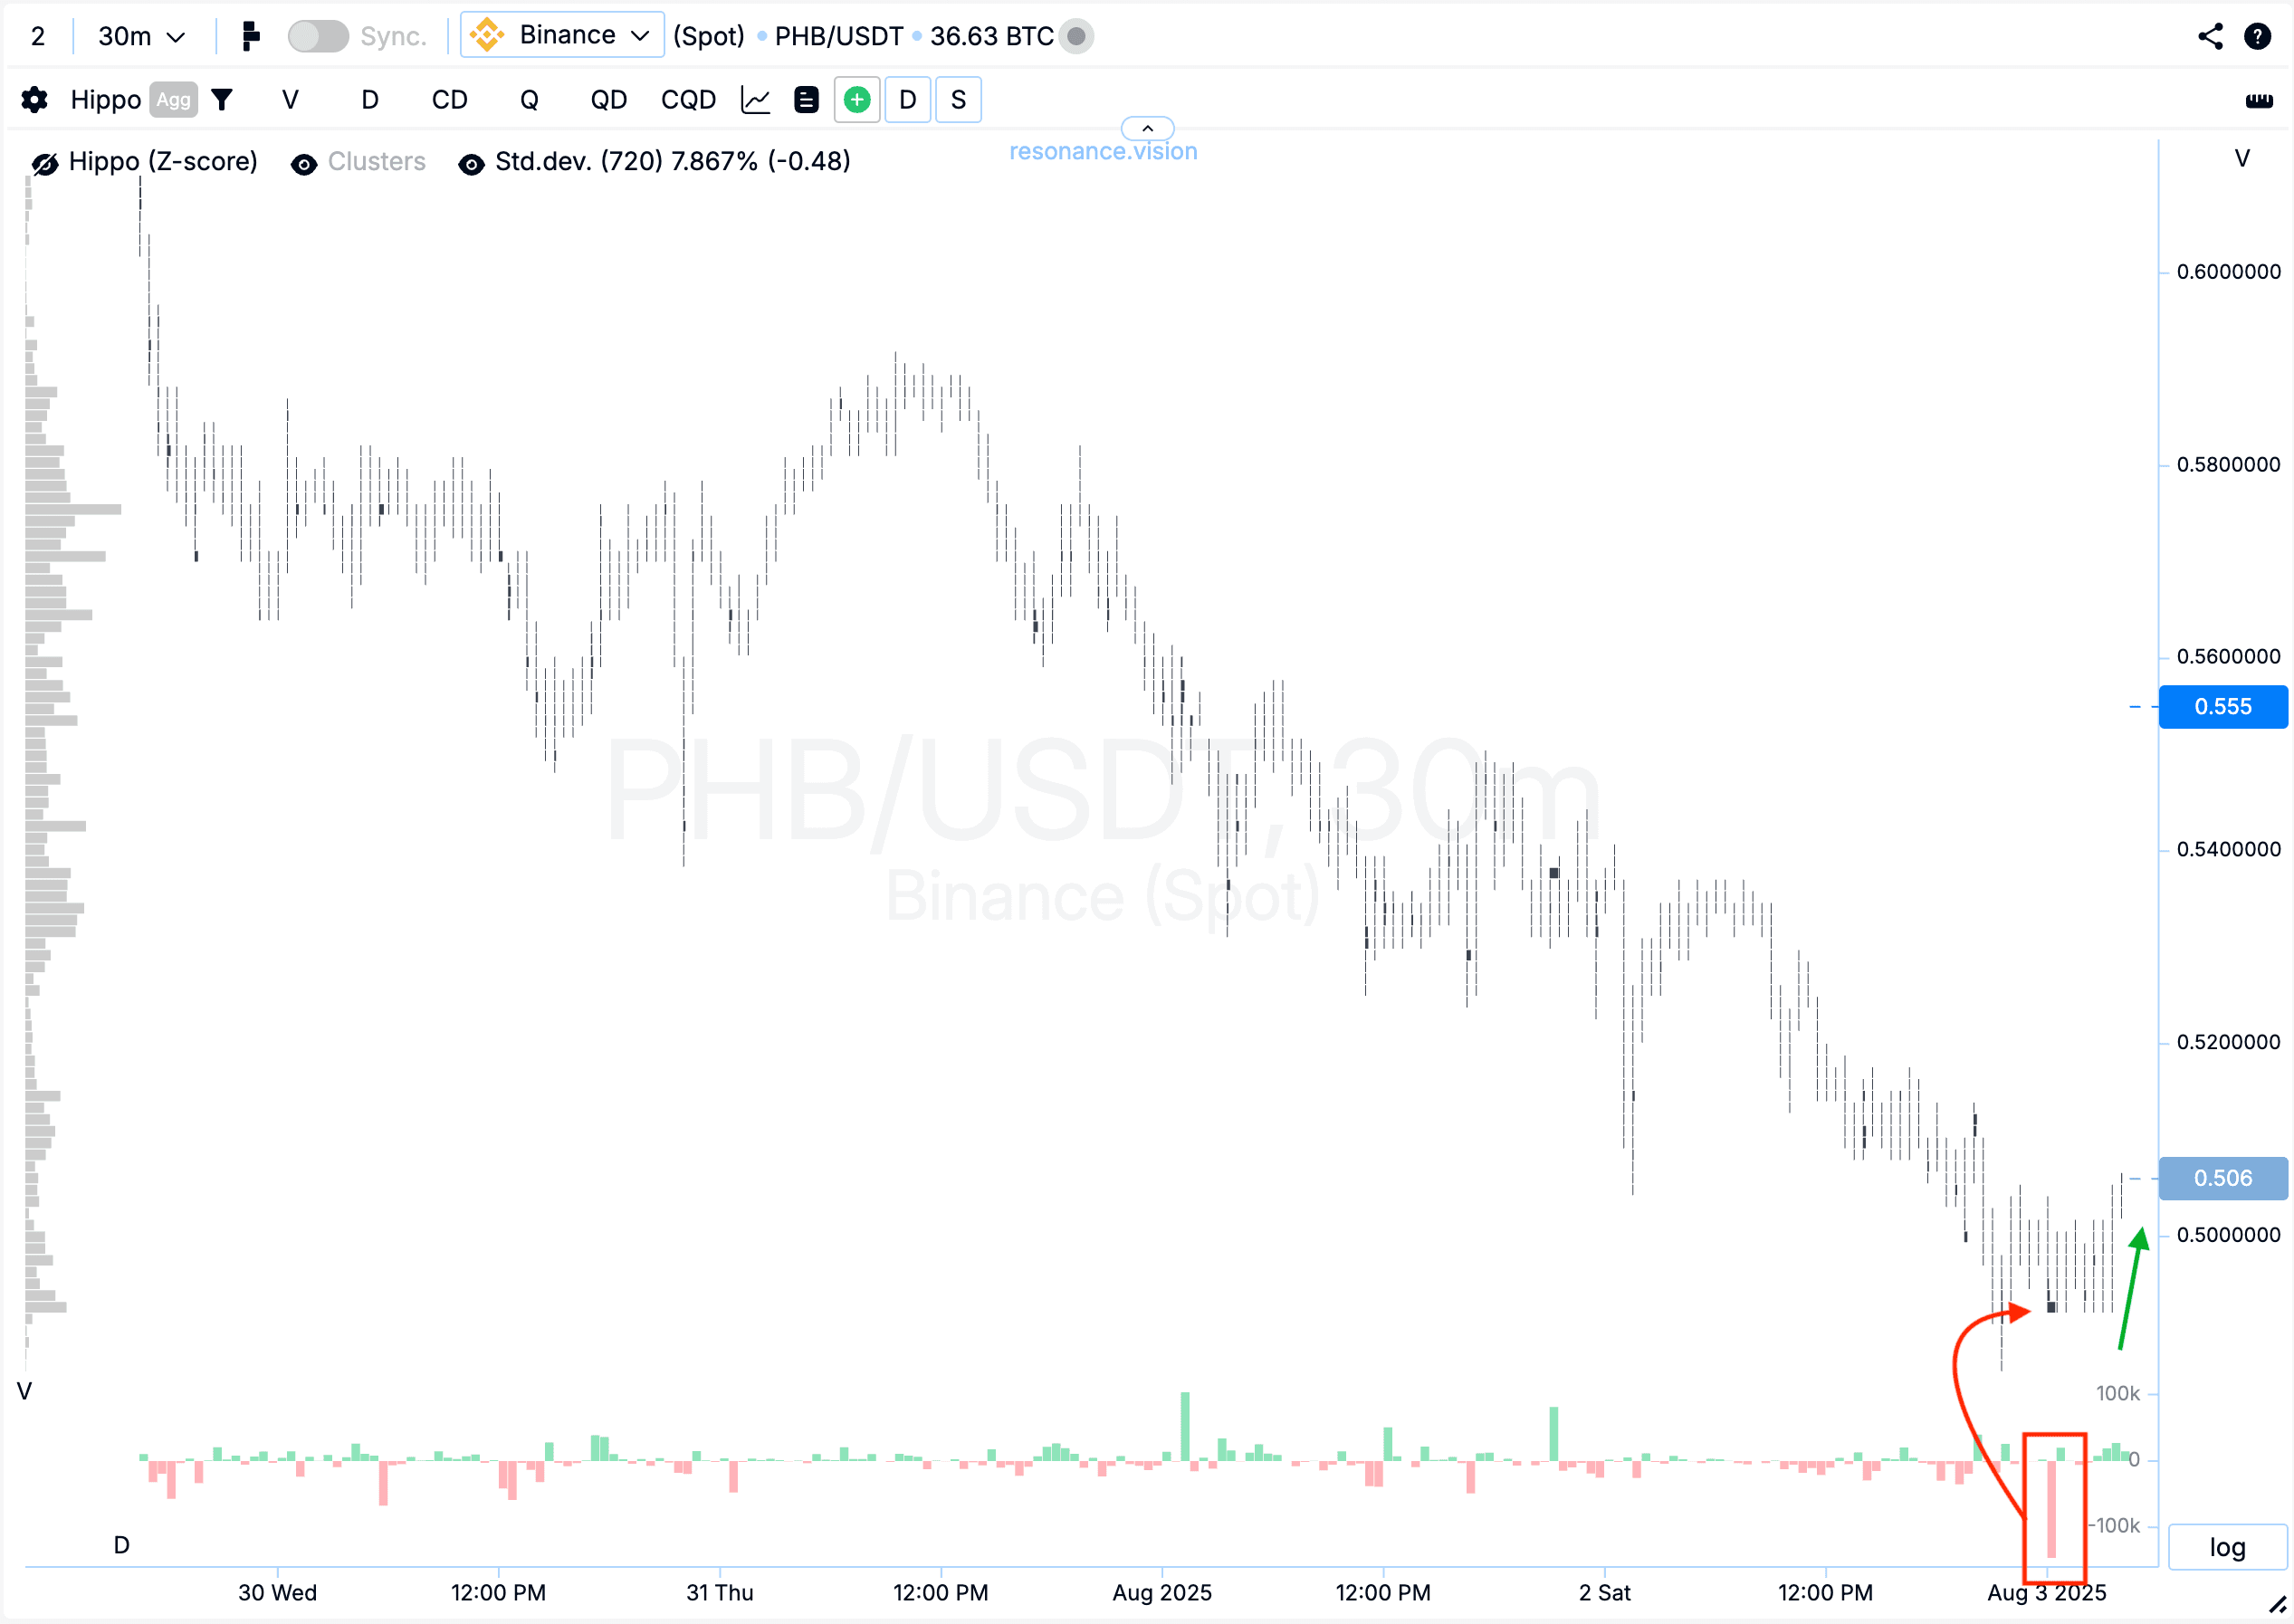
Кластерный график: После снижения обратил внимание на гистограмму дельты — наблюдалось заметное преобладание объёмов на продажу (красный прямоугольник со стрелкой). Однако, несмотря на это давление, цена уже не снижалась. А после на небольших покупках начала расти (зелёная стрелка). Это может свидетельствовать о том, что инициатива перешла в руки покупателей.
В Дешборде
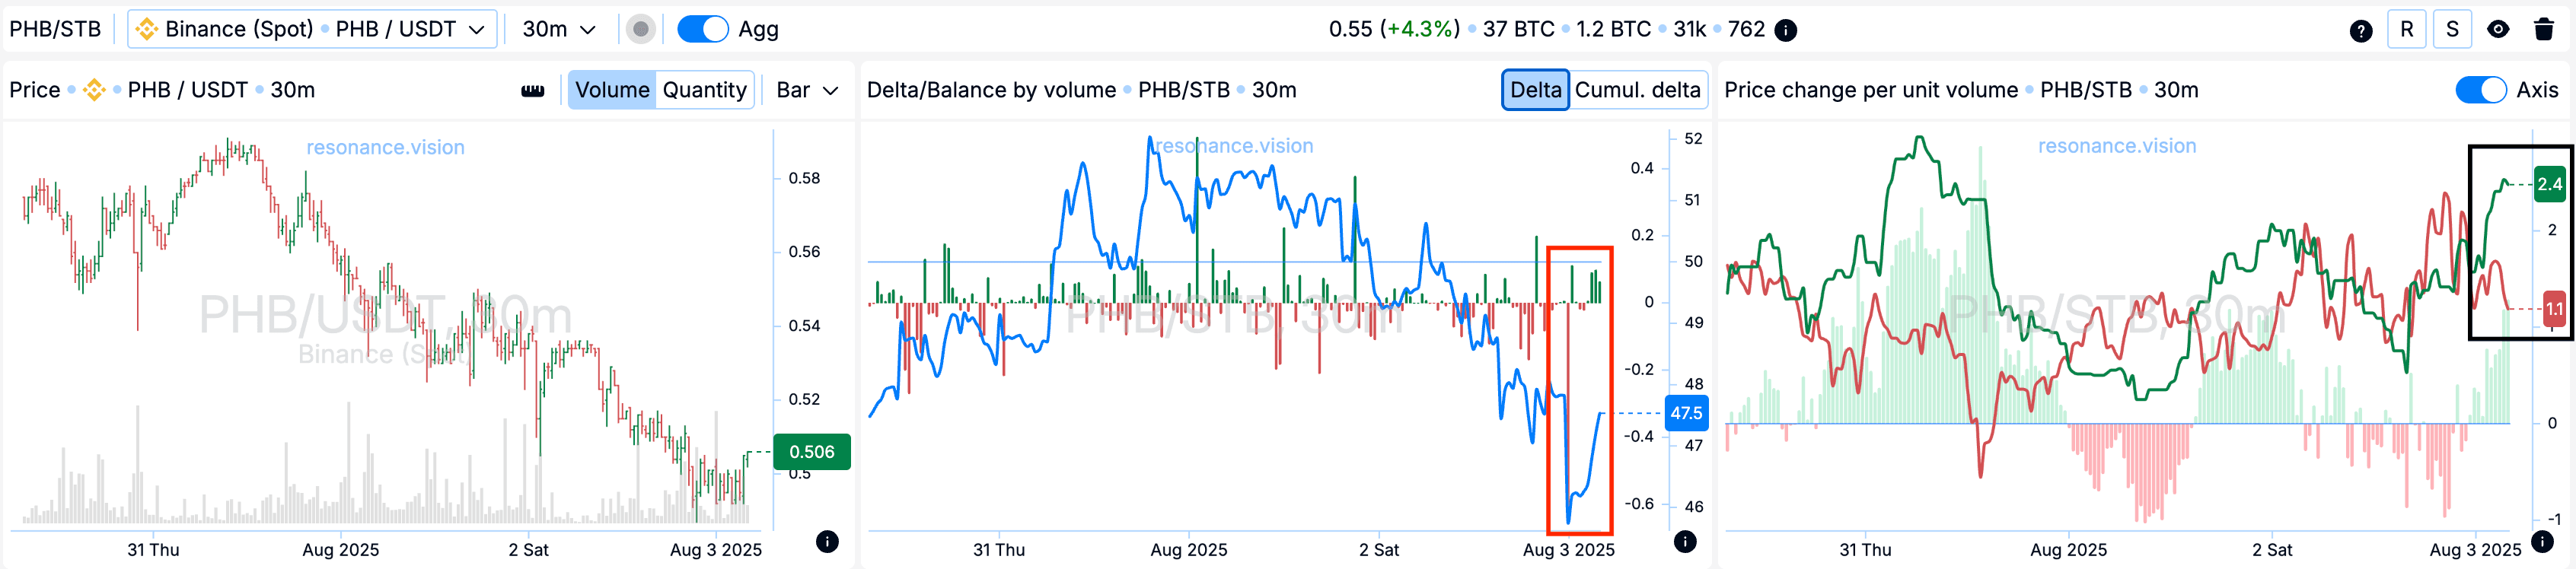
Дельта/Баланс по объёму: Агрегированные данные подтверждают наблюдения с кластерного графика. После выраженного преобладания рыночных продаж - это видно по дельте, начали появляться покупки, и баланс смещается в сторону покупателей (красный прямоугольник).
Изменение цены на единицу объёма: Эффективность воздействия рыночных ордеров на цену также сместилась — влияние покупателей стало заметно сильнее, что видно по расхождению в их пользу (чёрный прямоугольник).
Причины выхода
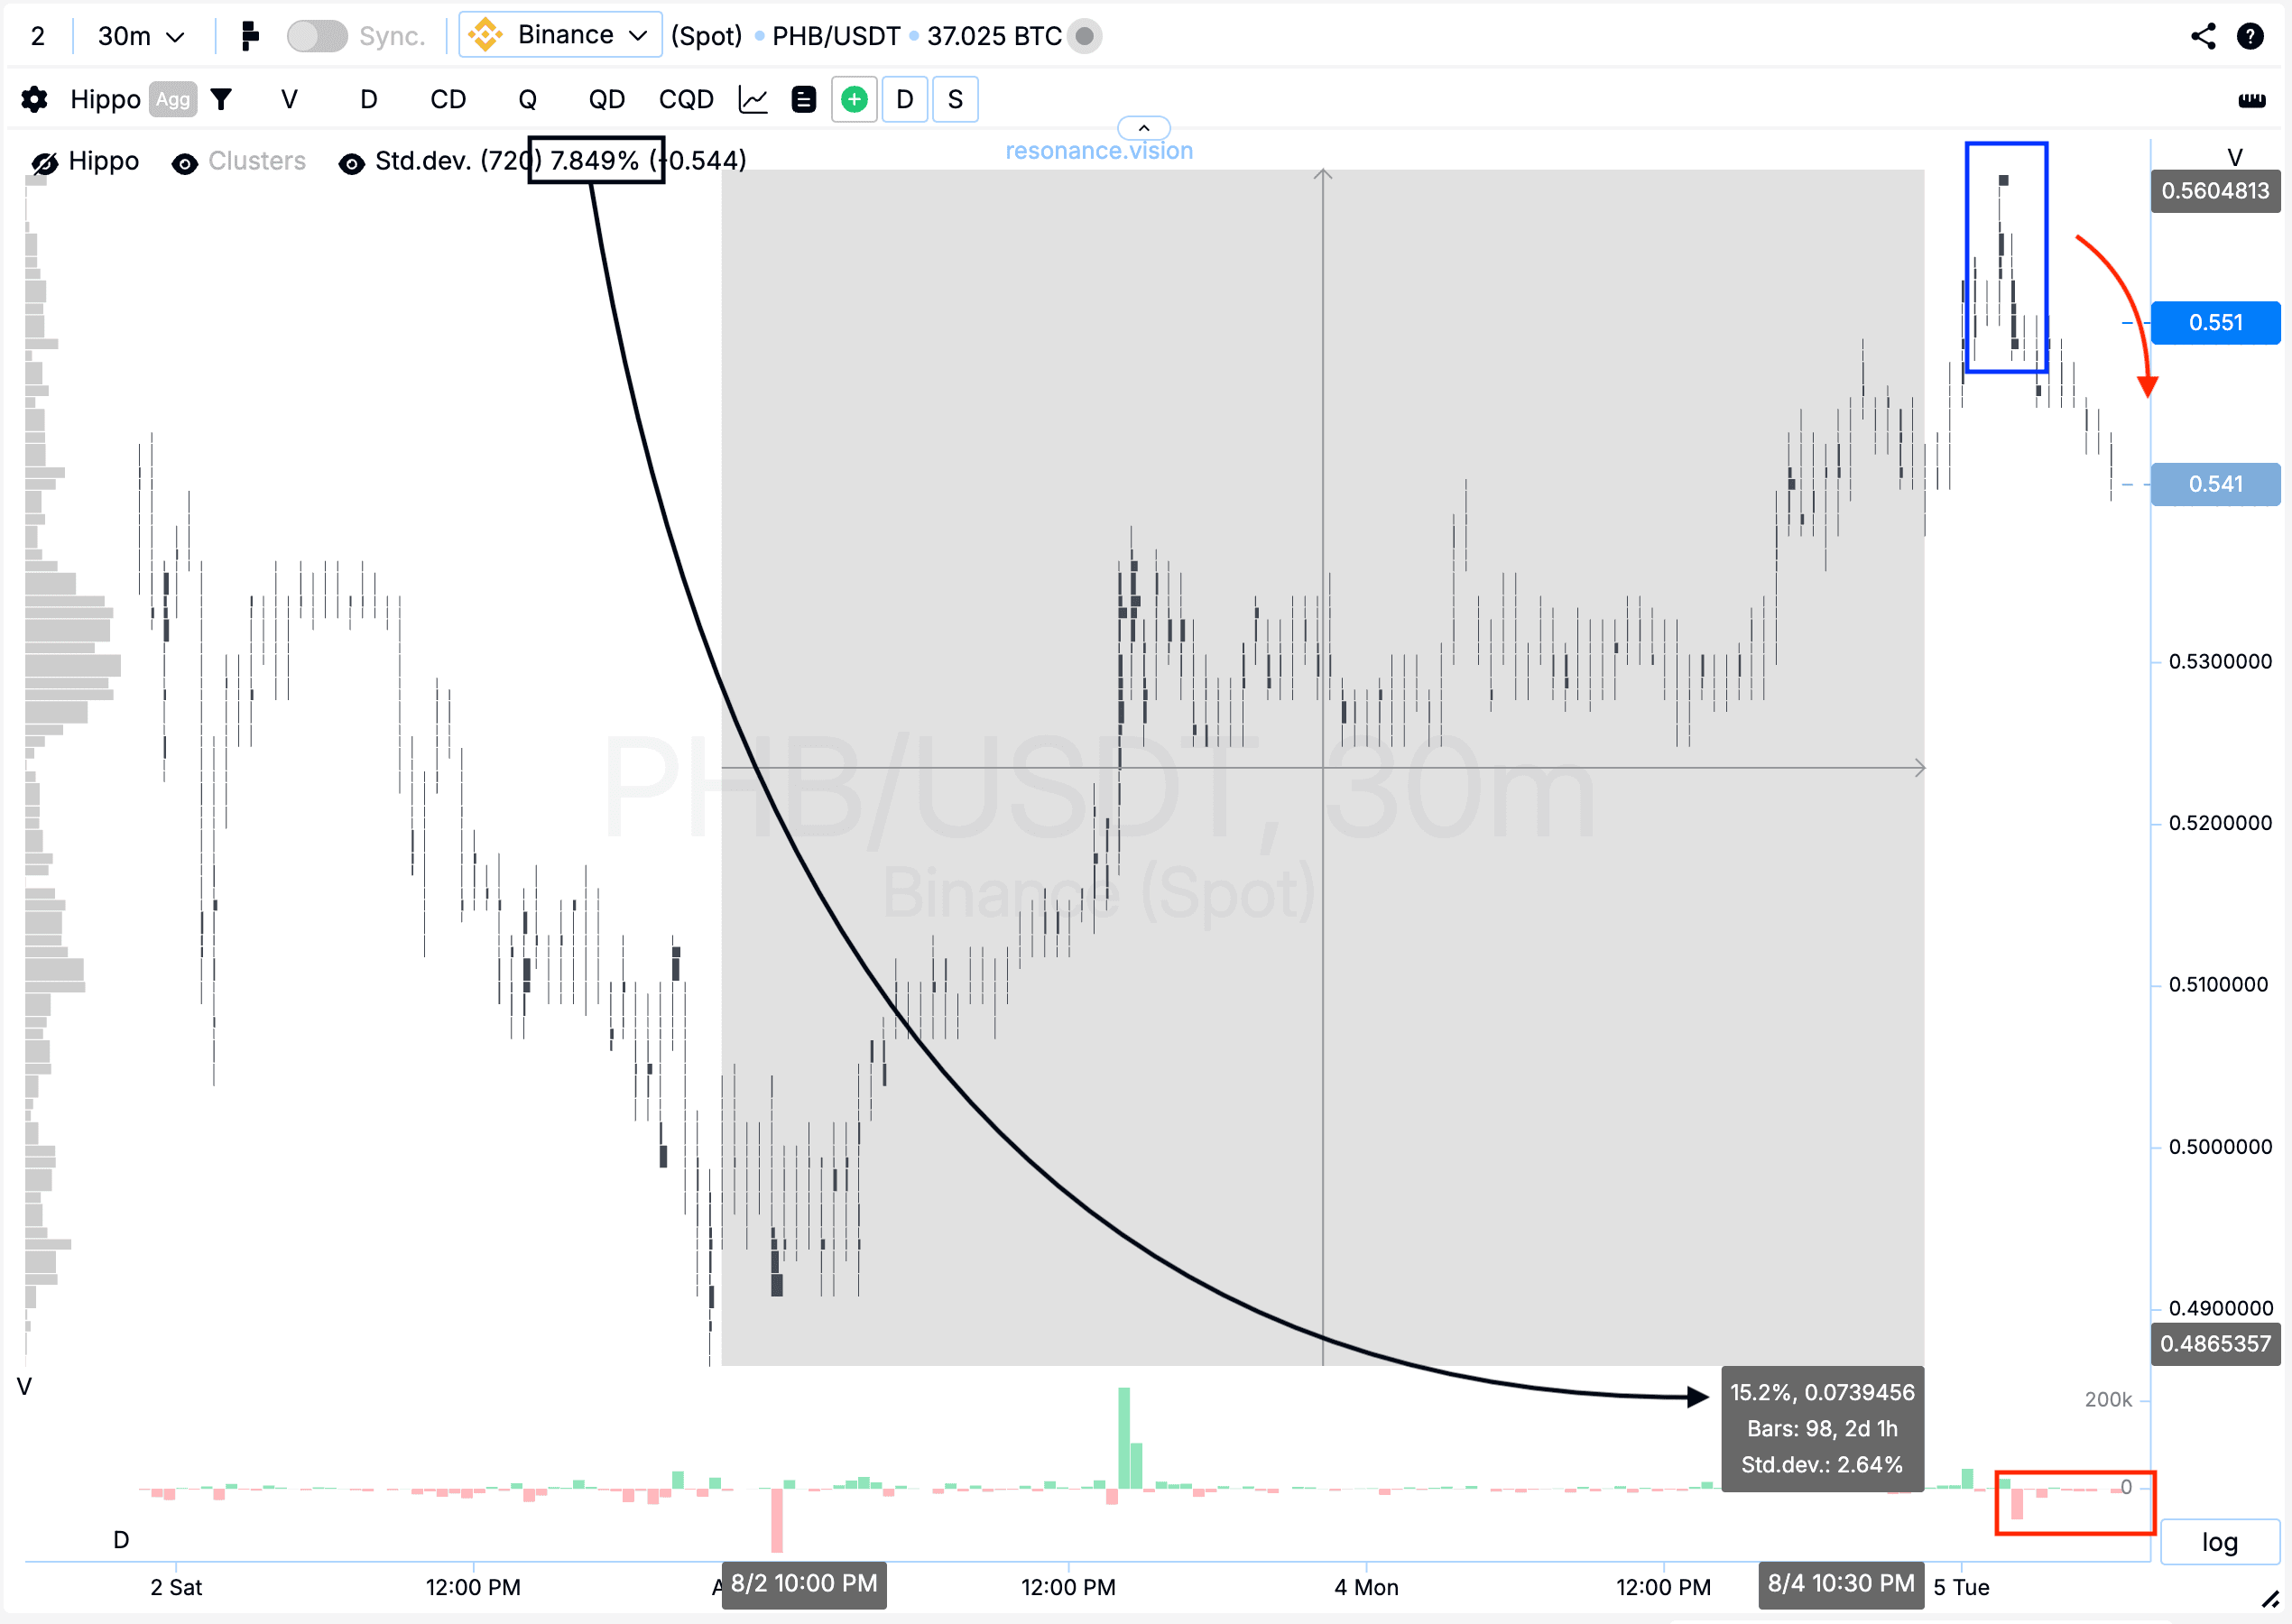
Кластерный график: В верхней части сформировались кластера по объёму (синий прямоугольник), после чего на фоне сравнительно небольших рыночных продаж началось направленное движение цены вниз (красный прямоугольник и стрелка).
Дополнительно отмечаю, что ценовое движение вверх составило свыше 15%, что практически соответствует двум стандартным отклонениям — для данного актива одно стандартное движение равно 7,849% (чёрный прямоугольник и стрелка).
Заключение
Эта сделка по PHB — пример того, как важно отслеживать не только факт преобладания объёмов, но и реакцию цены на эти объёмы. Несмотря на активные рыночные продажи, цена не снижалась, что стало первым сигналом о неэффективности продавцов. Смена направления и рост на фоне небольших покупок подтвердили гипотезу о переходе инициативы к покупателям.
Этот разбор наглядно демонстрирует, как сочетание кластерного графика, дельты и понимания поведения цены помогает принимать обоснованные решения на всех этапах сделки — от входа до выхода.
Следи за новыми статьями в нашем телеграм канале.
Не нужно выдумывать сложных схем и искать “грааль”. Используй инструменты платформы Resonance.
Регистрируйся по ссылке — получай бонус и начинай зарабатывать:
OKX | BingX | KuCoin.
Промокод TOPBLOG дает тебе 10% скидки на любой тарифный план Resonance.
Рекомендуемые статьи


