POL +27.2% (Напрямкова стратегія Резонанс)

Неефективність маркет-продажів та формування локального дефіциту 📊
Підтвердження через дельту та зміну ціни на одиницю об’єму. Рух +27% та фіксація прибутку при зниженні ефективності покупців.
Зміст

Монета: POL/USDT
Ризик: середній
Рівень розуміння: новачок
Причини входу
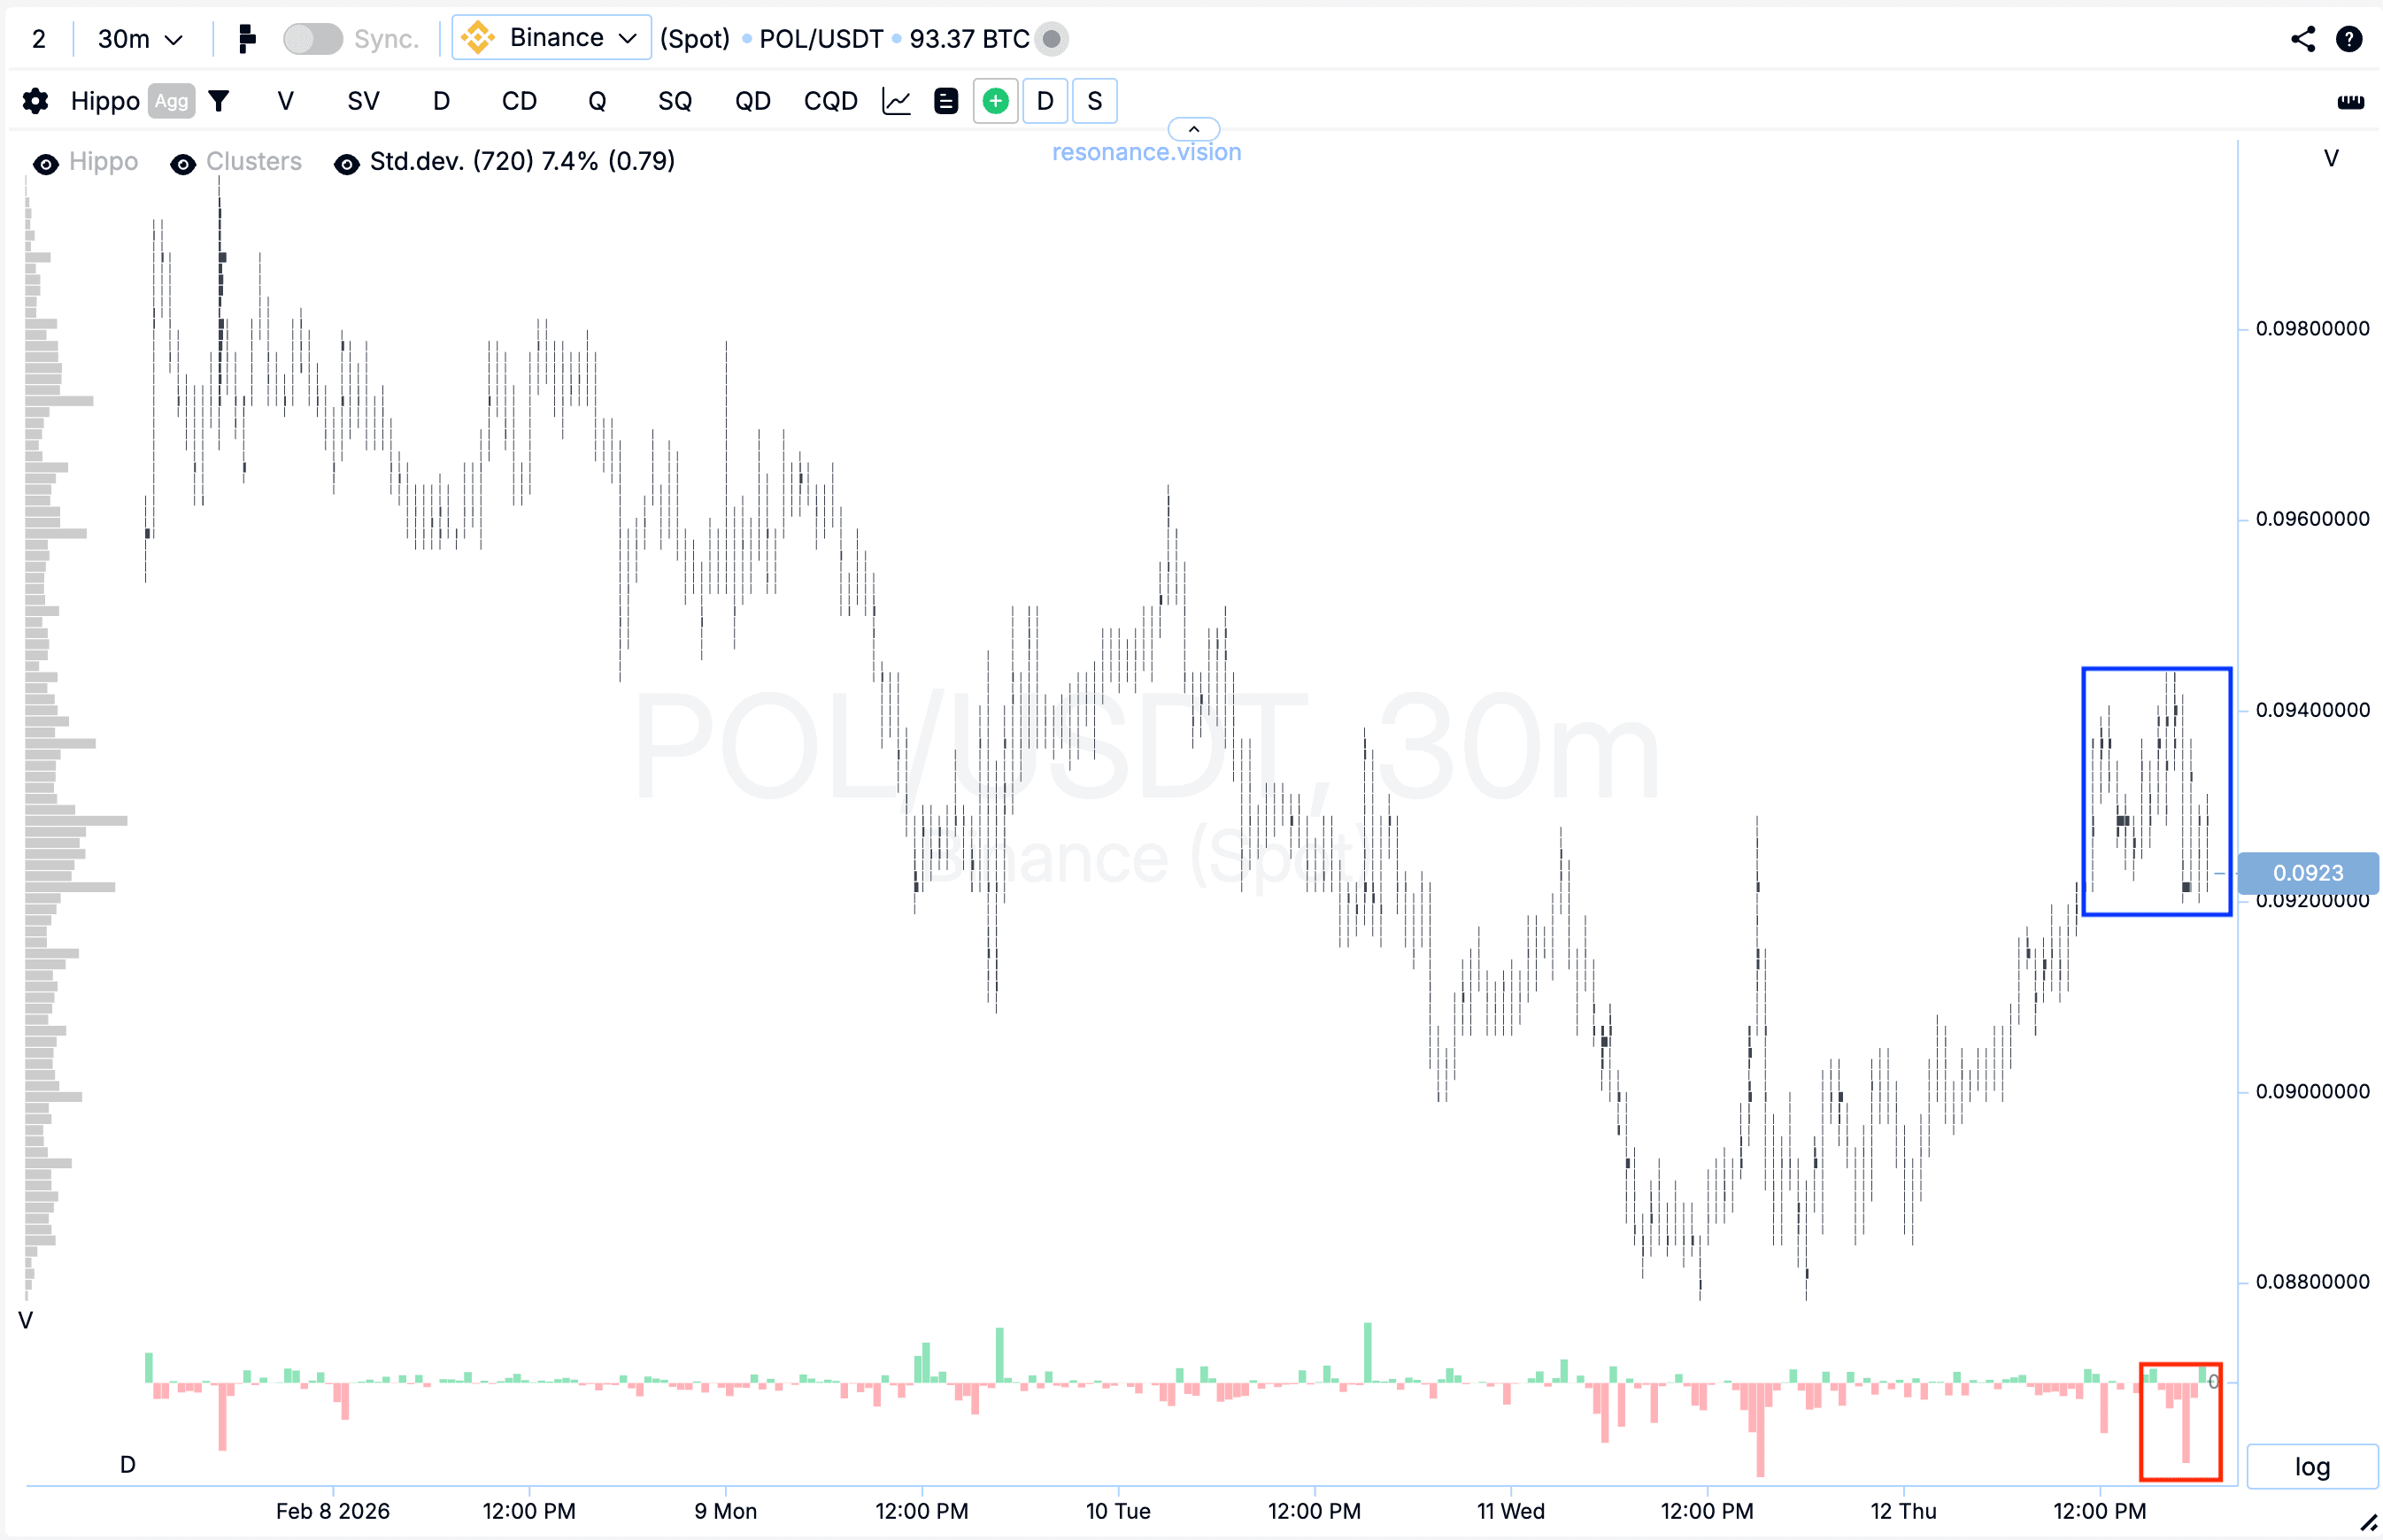
Кластерний графік: після зниження ціна почала поступово зростати, при цьому в діапазоні зростання почали формуватися суттєві об’єми (синій прямокутник). Усередині цих кластерів переважали маркет-ордери на продаж (червоний прямокутник).
Однак, незважаючи на виражений тиск з боку продавців, їхня ефективність помітно знизилася - ціна перестала реагувати зниженням.
Така реакція свідчить про формування ознак локального дефіциту та послаблення ініціативи продавців. Коли значні об’єми продажів перестають спричиняти рух ціни вниз, це часто стає раннім сигналом можливої зміни ініціативи або локального розвороту.
У Дешборді
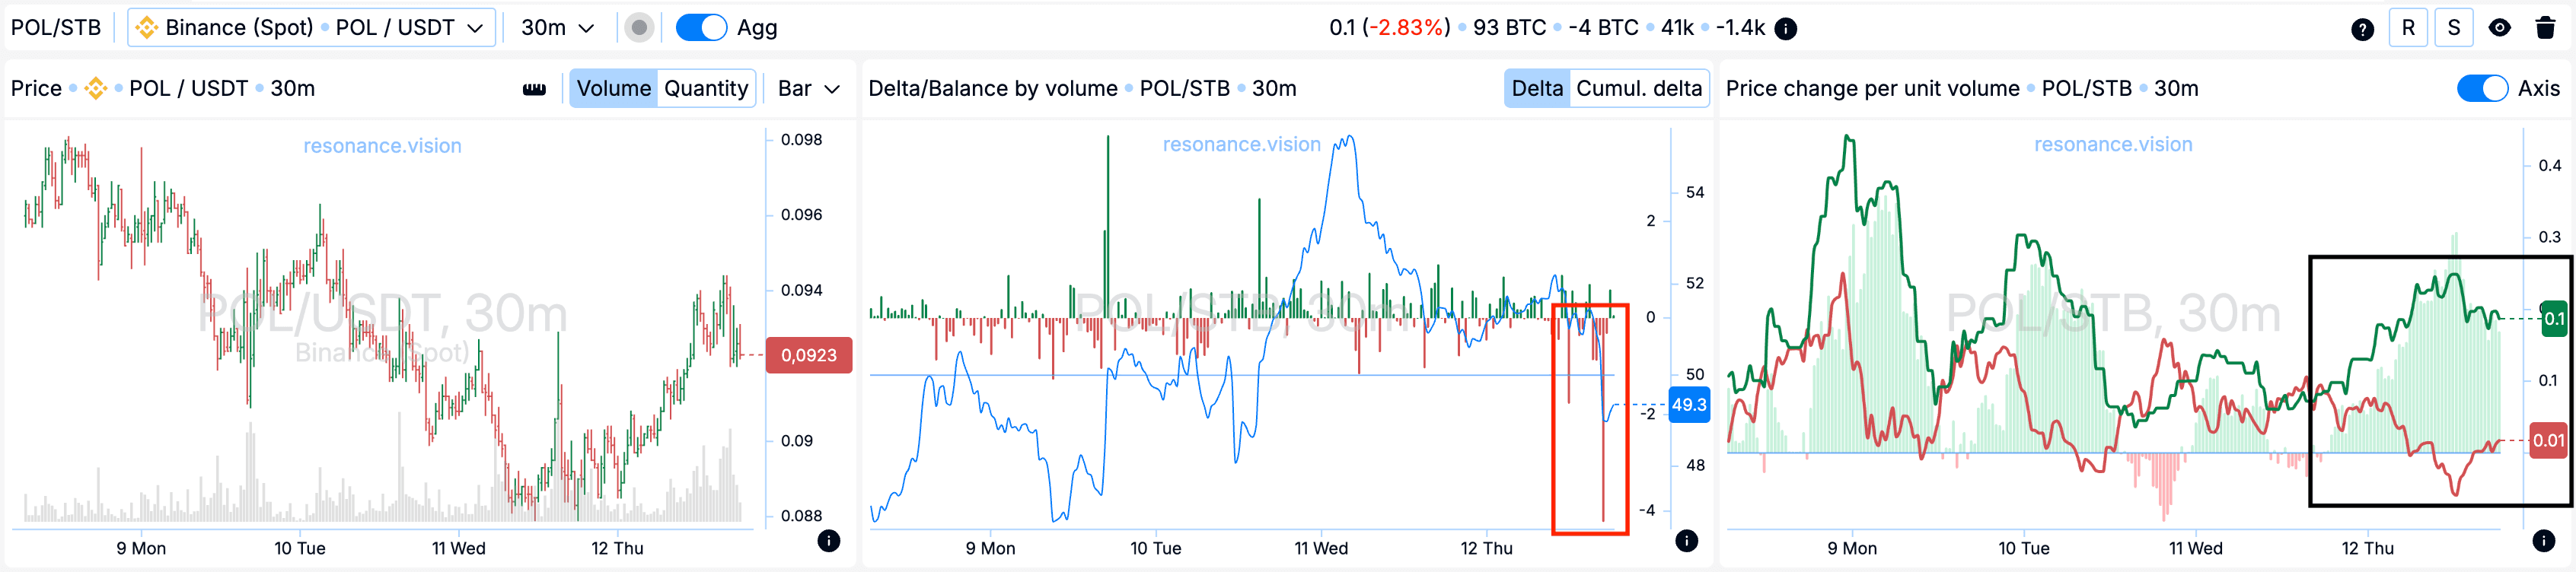
Дельта / Баланс за об’ємом: агреговані дані з усіх пар і бірж повністю підтверджують картину, що спостерігається на кластерному графіку. В даний момент ринок знаходився під вираженим тиском маркет-продажів, що чітко видно по гістограмі дельти (червоний прямокутник).
При цьому ціна не демонструвала відповідної реакції униз. Це вказує на активне поглинання всього ринкового об’єму, що входить, лімітними заявками на купівлю. Така структура формує локальну підтримку у поточному ціновому діапазоні.
Зміна ціни на одиницю об’єму: додатково видно, що ефективність впливу ринкових ордерів змістилася у бік покупців (чорний прямокутник).
Для руху ціни вгору потрібно менший об’єм, ніж для зниження. Це підтверджує ослаблення тиску з боку продавців та посилює аргументацію на користь продовження руху вгору.
Причини виходу
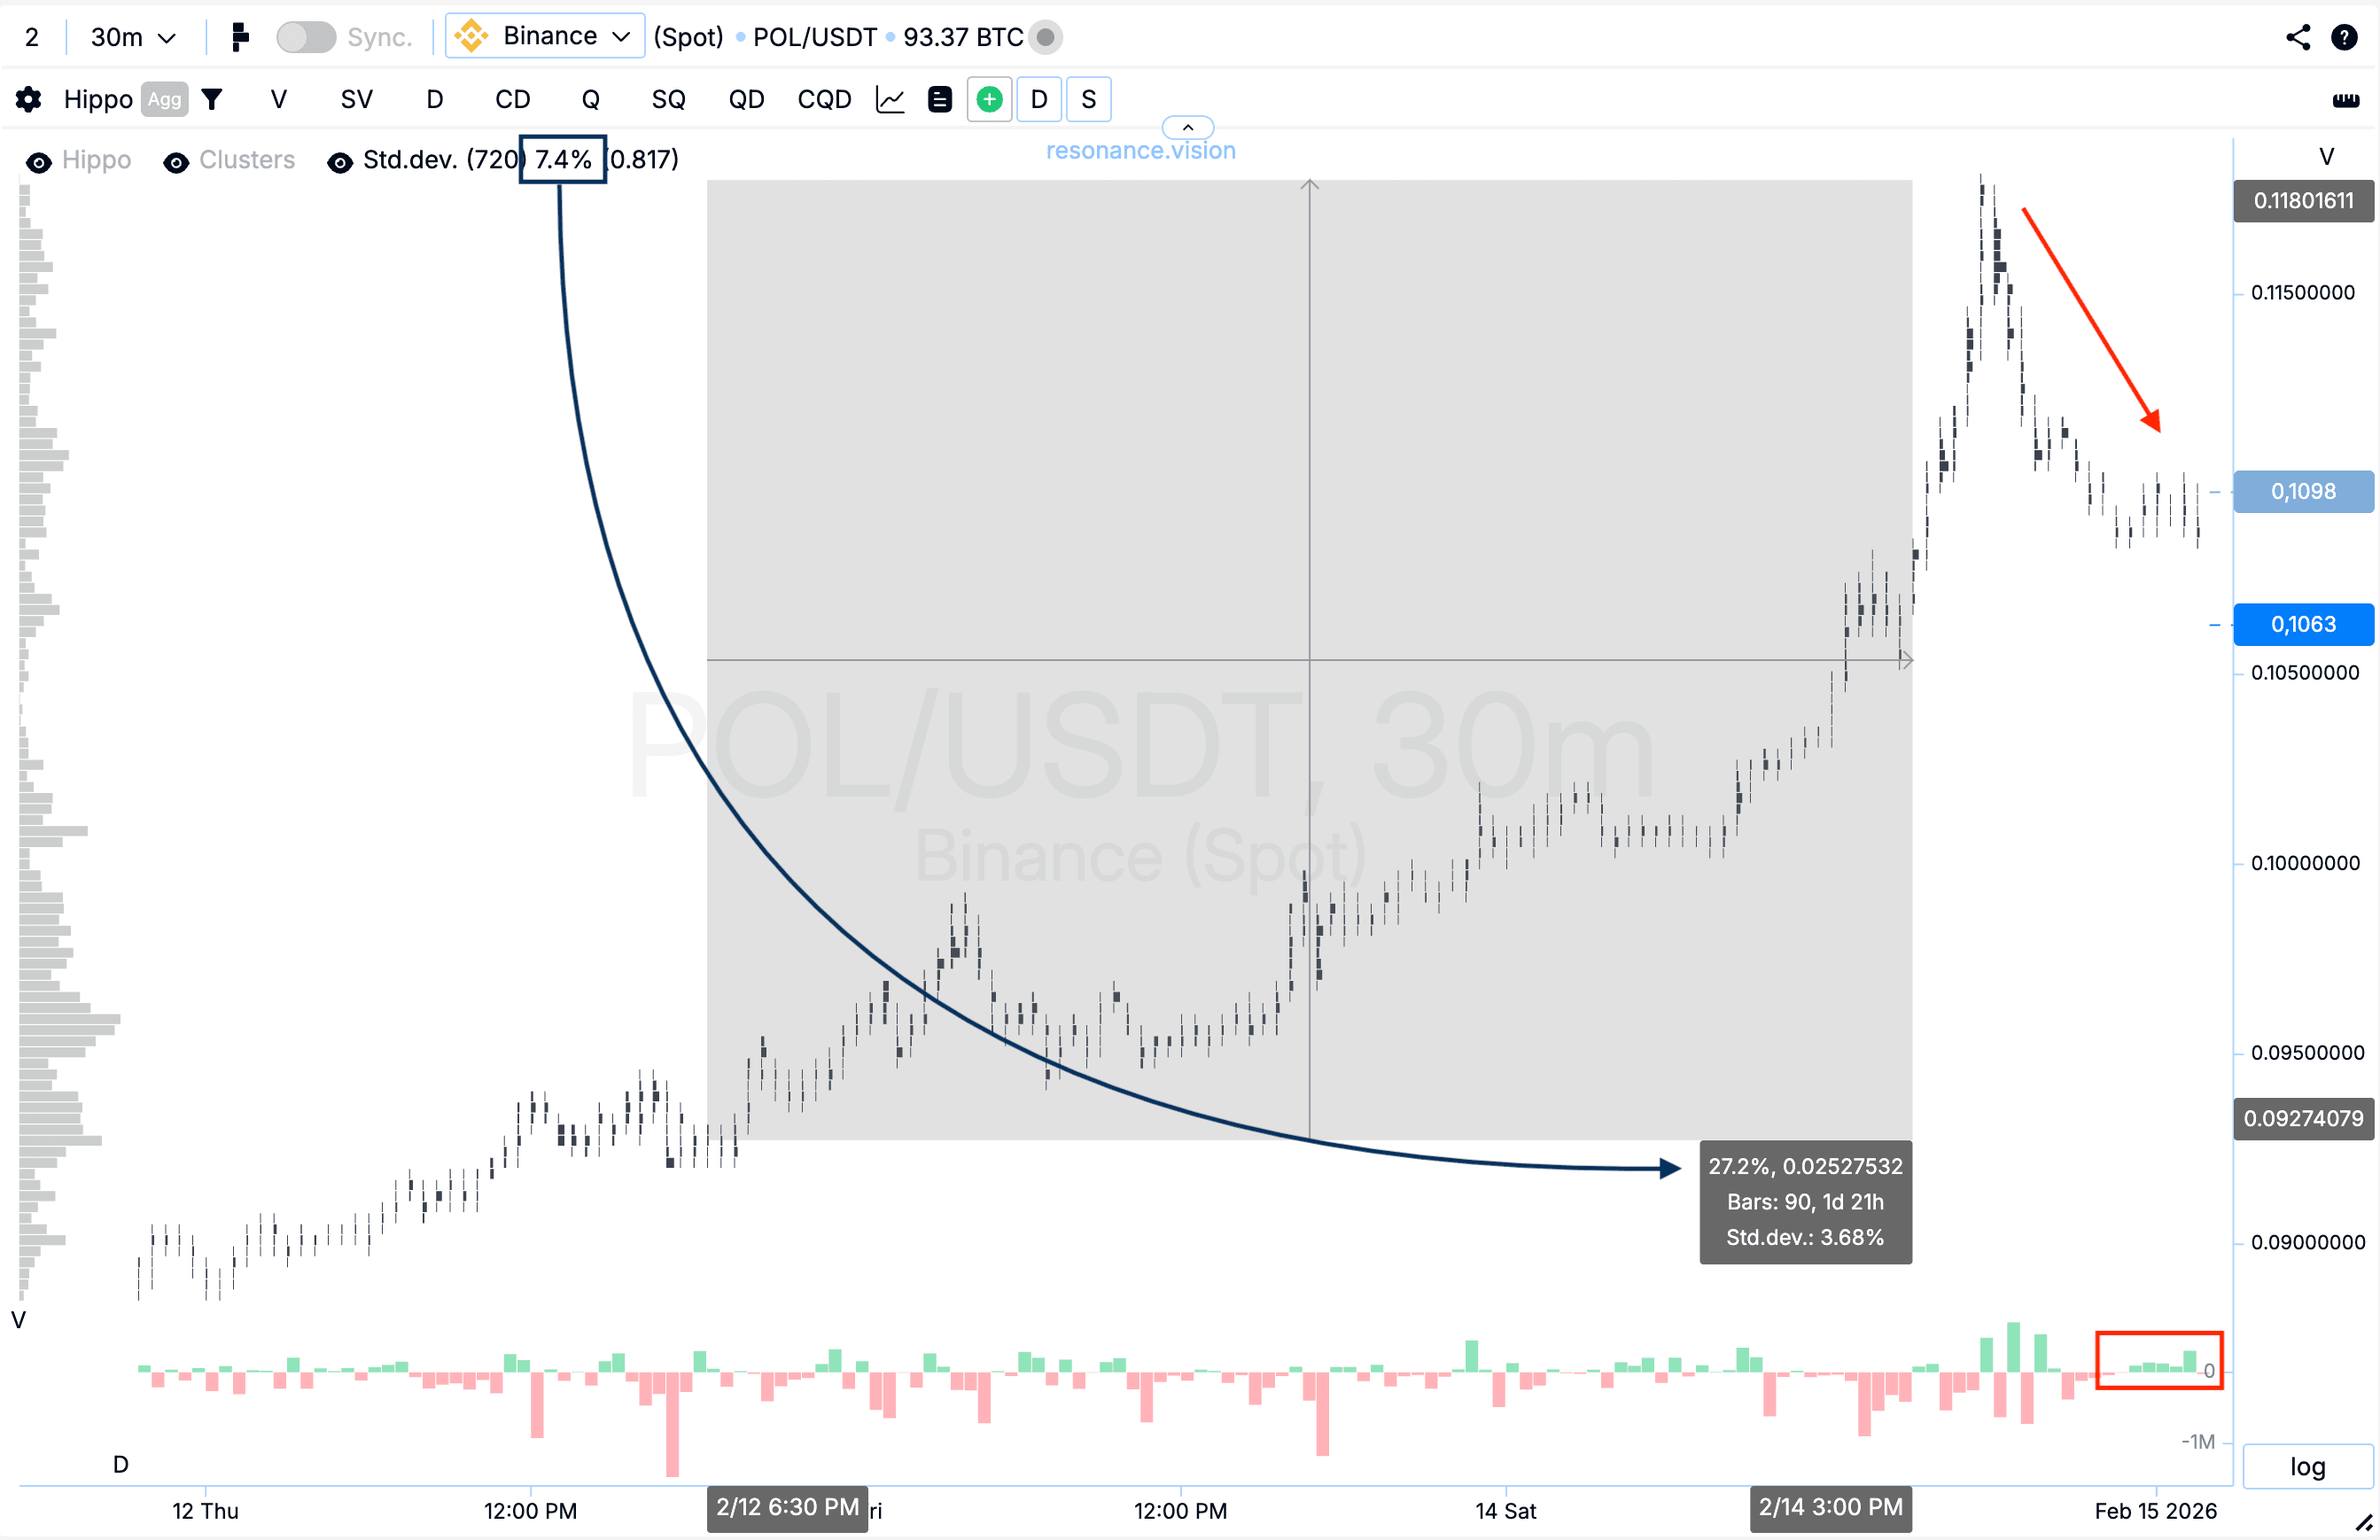
Кластерний графік: від точки входу ціна пройшла ще близько 27%, що відповідає практично чотирьом стандартним ціновим рухам (чорний прямокутник та стрілка).
Після цього сформувався значний відкат. При цьому по дельті спостерігалося переважання маркет-покупок (червоний прямокутник і стрілка), проте ціна вже не демонструвала ефективність зростання.
Подібна динаміка вказує на зниження ефективності покупців та зростання ризику подальшого утримання позиції, що робить фіксацію прибутку логічним та обґрунтованим рішенням.
Висновок
У цій ситуації ключовим фактором став не сам об’єм маркет-продажів, а реакція ціни на нього. Незважаючи на домінування продажів, що виразно видно на гістограмі дельти, ринок перестав знижуватися, що вказувало зниження ефективності продавців і формування ознак локального дефіциту.
Додатковим аргументом стали агреговані дані та показник зміни ціни на одиницю об’єму, які дозволили об’єктивно оцінити усунення ініціативи у бік покупців.
Вихід було здійснено після статистично значущого руху та появи ознак зниження ефективності зростання, а також формування локального профіциту. Такий підхід дозволяє не просто входити до імпульсних рухів, а системно працювати на дистанції, керуючи ризиком.
Стеж за новими статтями у нашому телеграм каналі.
Не треба вигадувати складних схем та шукати “грааль”. Використовуйте інструменти платформи Resonance.
Реєструйся за посиланням - отримуй бонус і починай заробляти:
OKX | BingX | KuCoin.
Промокод TOPBLOG дає тобі 10% знижки на будь-який тарифний план Resonance.
Рекомендовані статті


