PYTH +243.97% (Напрямкова стратегія Резонанс)

Кейс Resonance: неефективність маркет-продажів у боковику, підтвердження агрегованими метриками та фіксація після появи зустрічної пропозиції.
Зміст

Ідею було знайдено всередині бокового руху. Для дейтрейдингу це один із найпрактичніших сценаріїв: продавець намагається продавити діапазон вниз, але продовження немає, а тиск маркет-продажів перестає давати попередній результат. Така “неефективність” часто вказує на лімітну підтримку та умови для імпульсу вгору. Нижче — розбір за методом Resonance: кластерний графік для читання реакції ціни на об’єми та агреговані метрики (дельта/баланс, ефективність впливу ордерів) для підтвердження, що покупець справді утримує діапазон.
Причини входу
Кластерний графік
Мою увагу привернула реакція покупця, коли актив перебував у боковику. Спроба виходу вниз не мала успіху: ціну стримали й повернули назад у діапазон (синій прямокутник). Потім знову з’явився тиск маркет-продажів, але ціна не відреагувала зниженням (червоний прямокутник). Це вказало на інтерес покупця до цінового діапазону та готовність поглинати продажі, що підвищує ймовірність руху вгору.
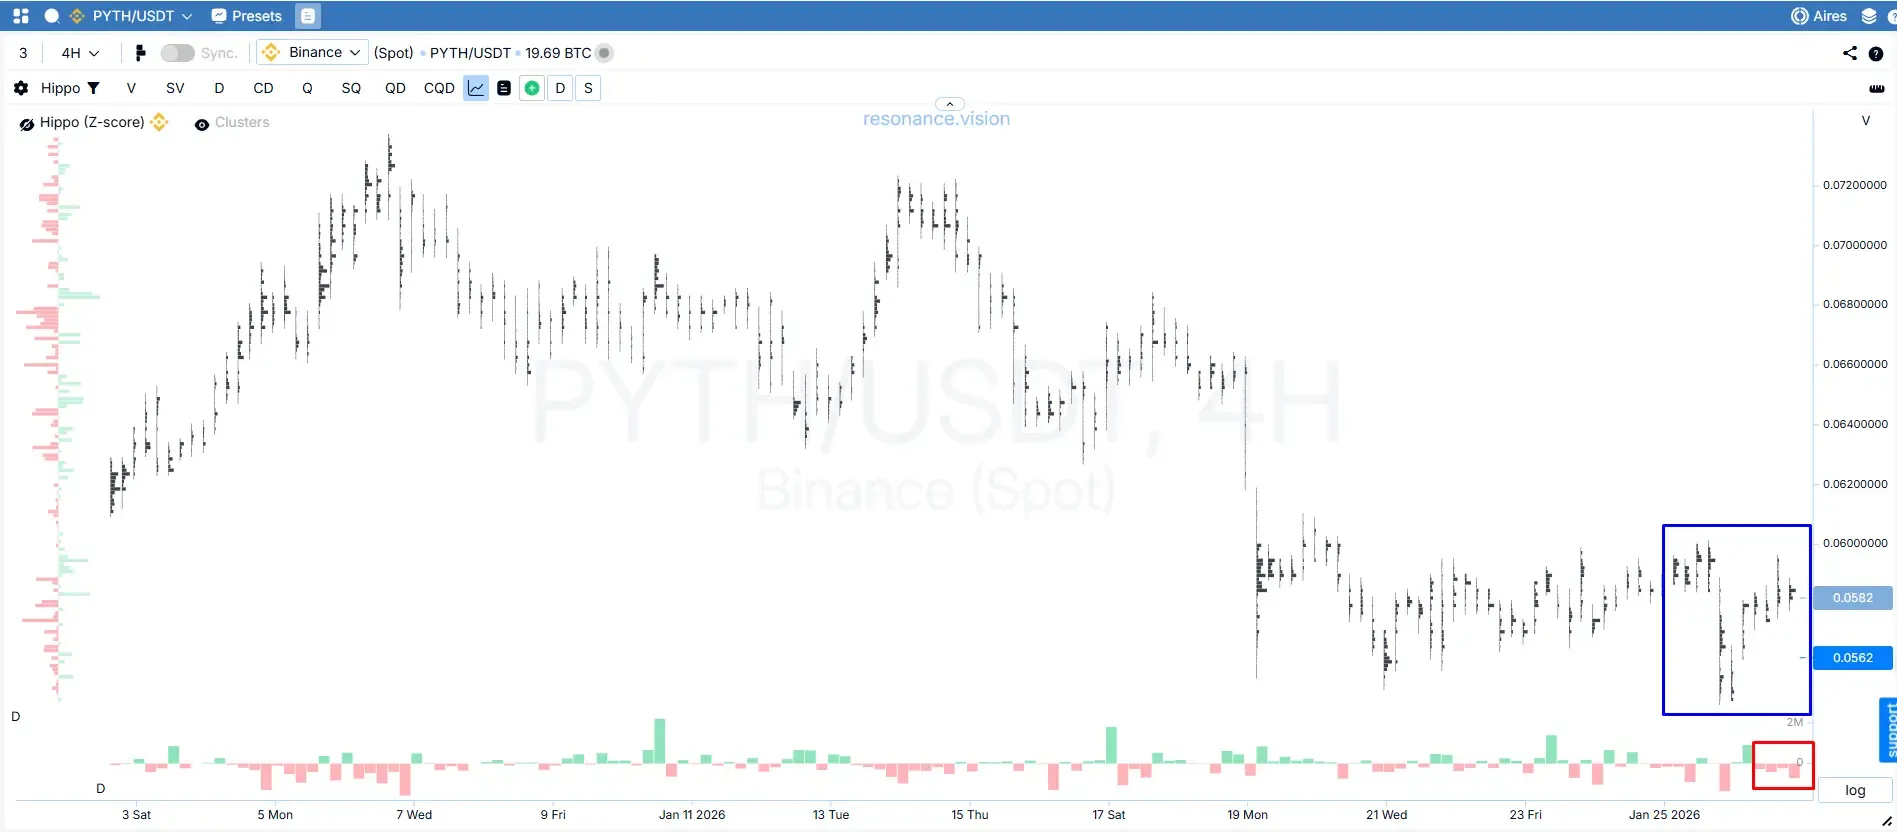
Стоп-лосс було розміщено за областю утримання продажів: якщо ціна повернеться нижче цієї зони, логіка утримання діапазону буде порушена.
Дешборд: підтвердження агрегованими метриками
Дельта / баланс за об’ємом:
Пройшли великі продажі, але ціна залишилася в боковику (зелений прямокутник). Агреговані дані підтверджують намір покупців стримувати ціну та утримувати діапазон.
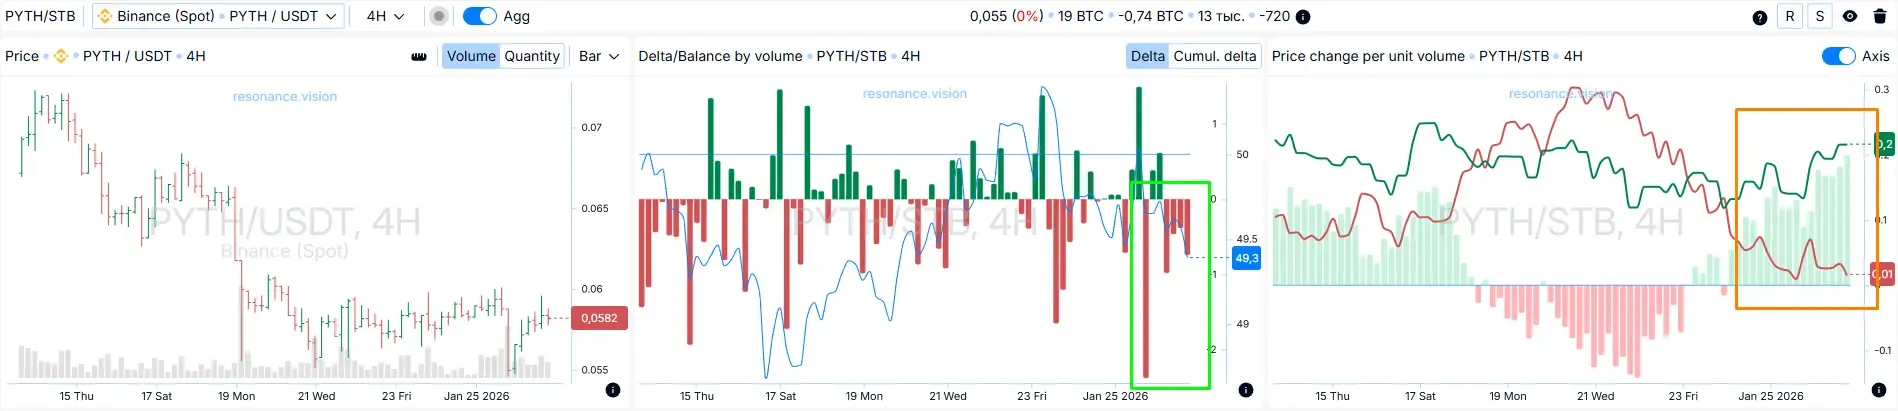
Зміна ціни на одиницю об’єму:
Ефективність впливу ринкових ордерів змістилася на користь покупців (помаранчевий прямокутник). Це означає зростання ефективності покупок: ціна реагує на купівлю краще, ніж на продаж.
Причини виходу
Кластерний графік: поява зустрічної пропозиції
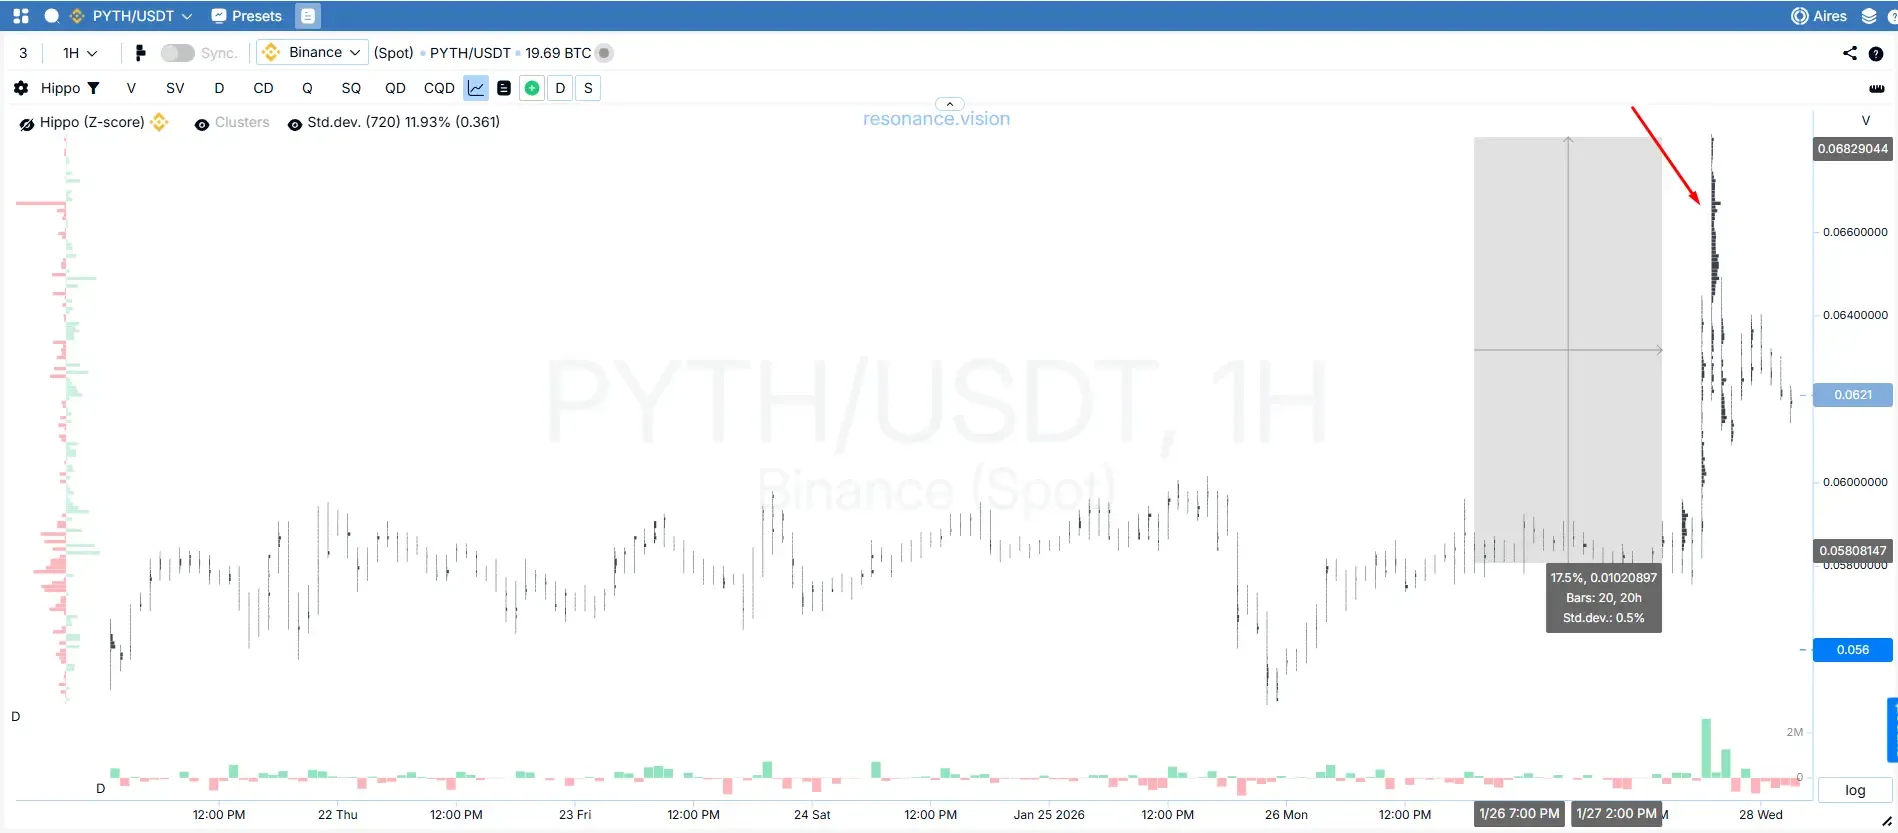
Щоб детальніше розглянути поведінку учасників, було виконано перехід на таймфрейм 1г. Поява щільних об’ємів на вершині руху часто вказує на зростання зустрічної пропозиції та підвищує ймовірність зупинки або відкату. У цих умовах фіксація позиції була логічним рішенням.
Результат
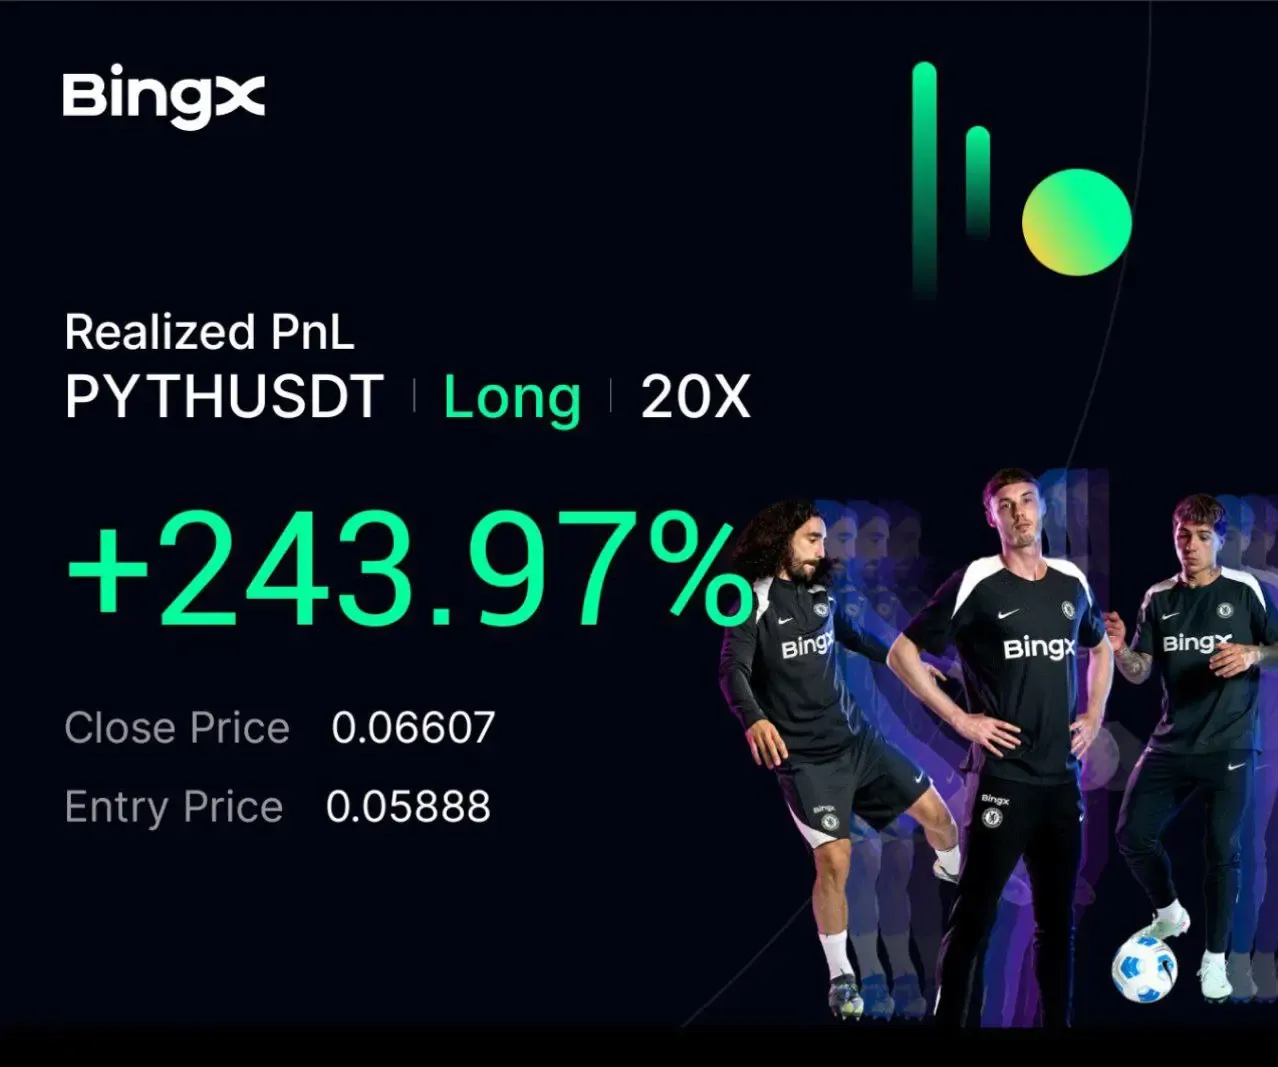
Вдалося зафіксувати 20% чистого руху.
Висновок по угоді
Аналіз об’ємів через оцінку впливу об’єму на ціну дає перевагу в трейдингу: продавцю не вдалося продавити діапазон, покупець утримував ціну та поглинав пропозицію. Після реалізації імпульсу й появи ознак зустрічної пропозиції ймовірність продовження знизилася — це і стало підставою для фіксації результату.
Стеж за новими статтями у нашому телеграм каналі.
Не треба вигадувати складних схем та шукати “грааль”. Використовуйте інструменти платформи Resonance.
Реєструйся за посиланням - отримуй бонус і починай заробляти:
OKX | BingX | KuCoin.
Промокод TOPBLOG дає тобі 10% знижки на будь-який тарифний план Resonance.
Рекомендовані статті


