PYTH +32.6% (Напрямкова стратегія Resonance)

Приклад того, як грамотний аналіз об’ємів та реакції ціни допомагає визначити зміну балансу між покупцями та продавцями. Незважаючи на активні продажі, ціна втрималася і показала зростання більш ніж на 30%, що підтвердило ефективність аналізу попиту та пропозиції. Відмінний кейс для розуміння, чому важливо стежити не лише за об’ємами, а й за тим, як на них реагує ринок.
Зміст

Монета: PYTH/USDT
Ризик: низький
Рівень розуміння: новачок
Причини входу
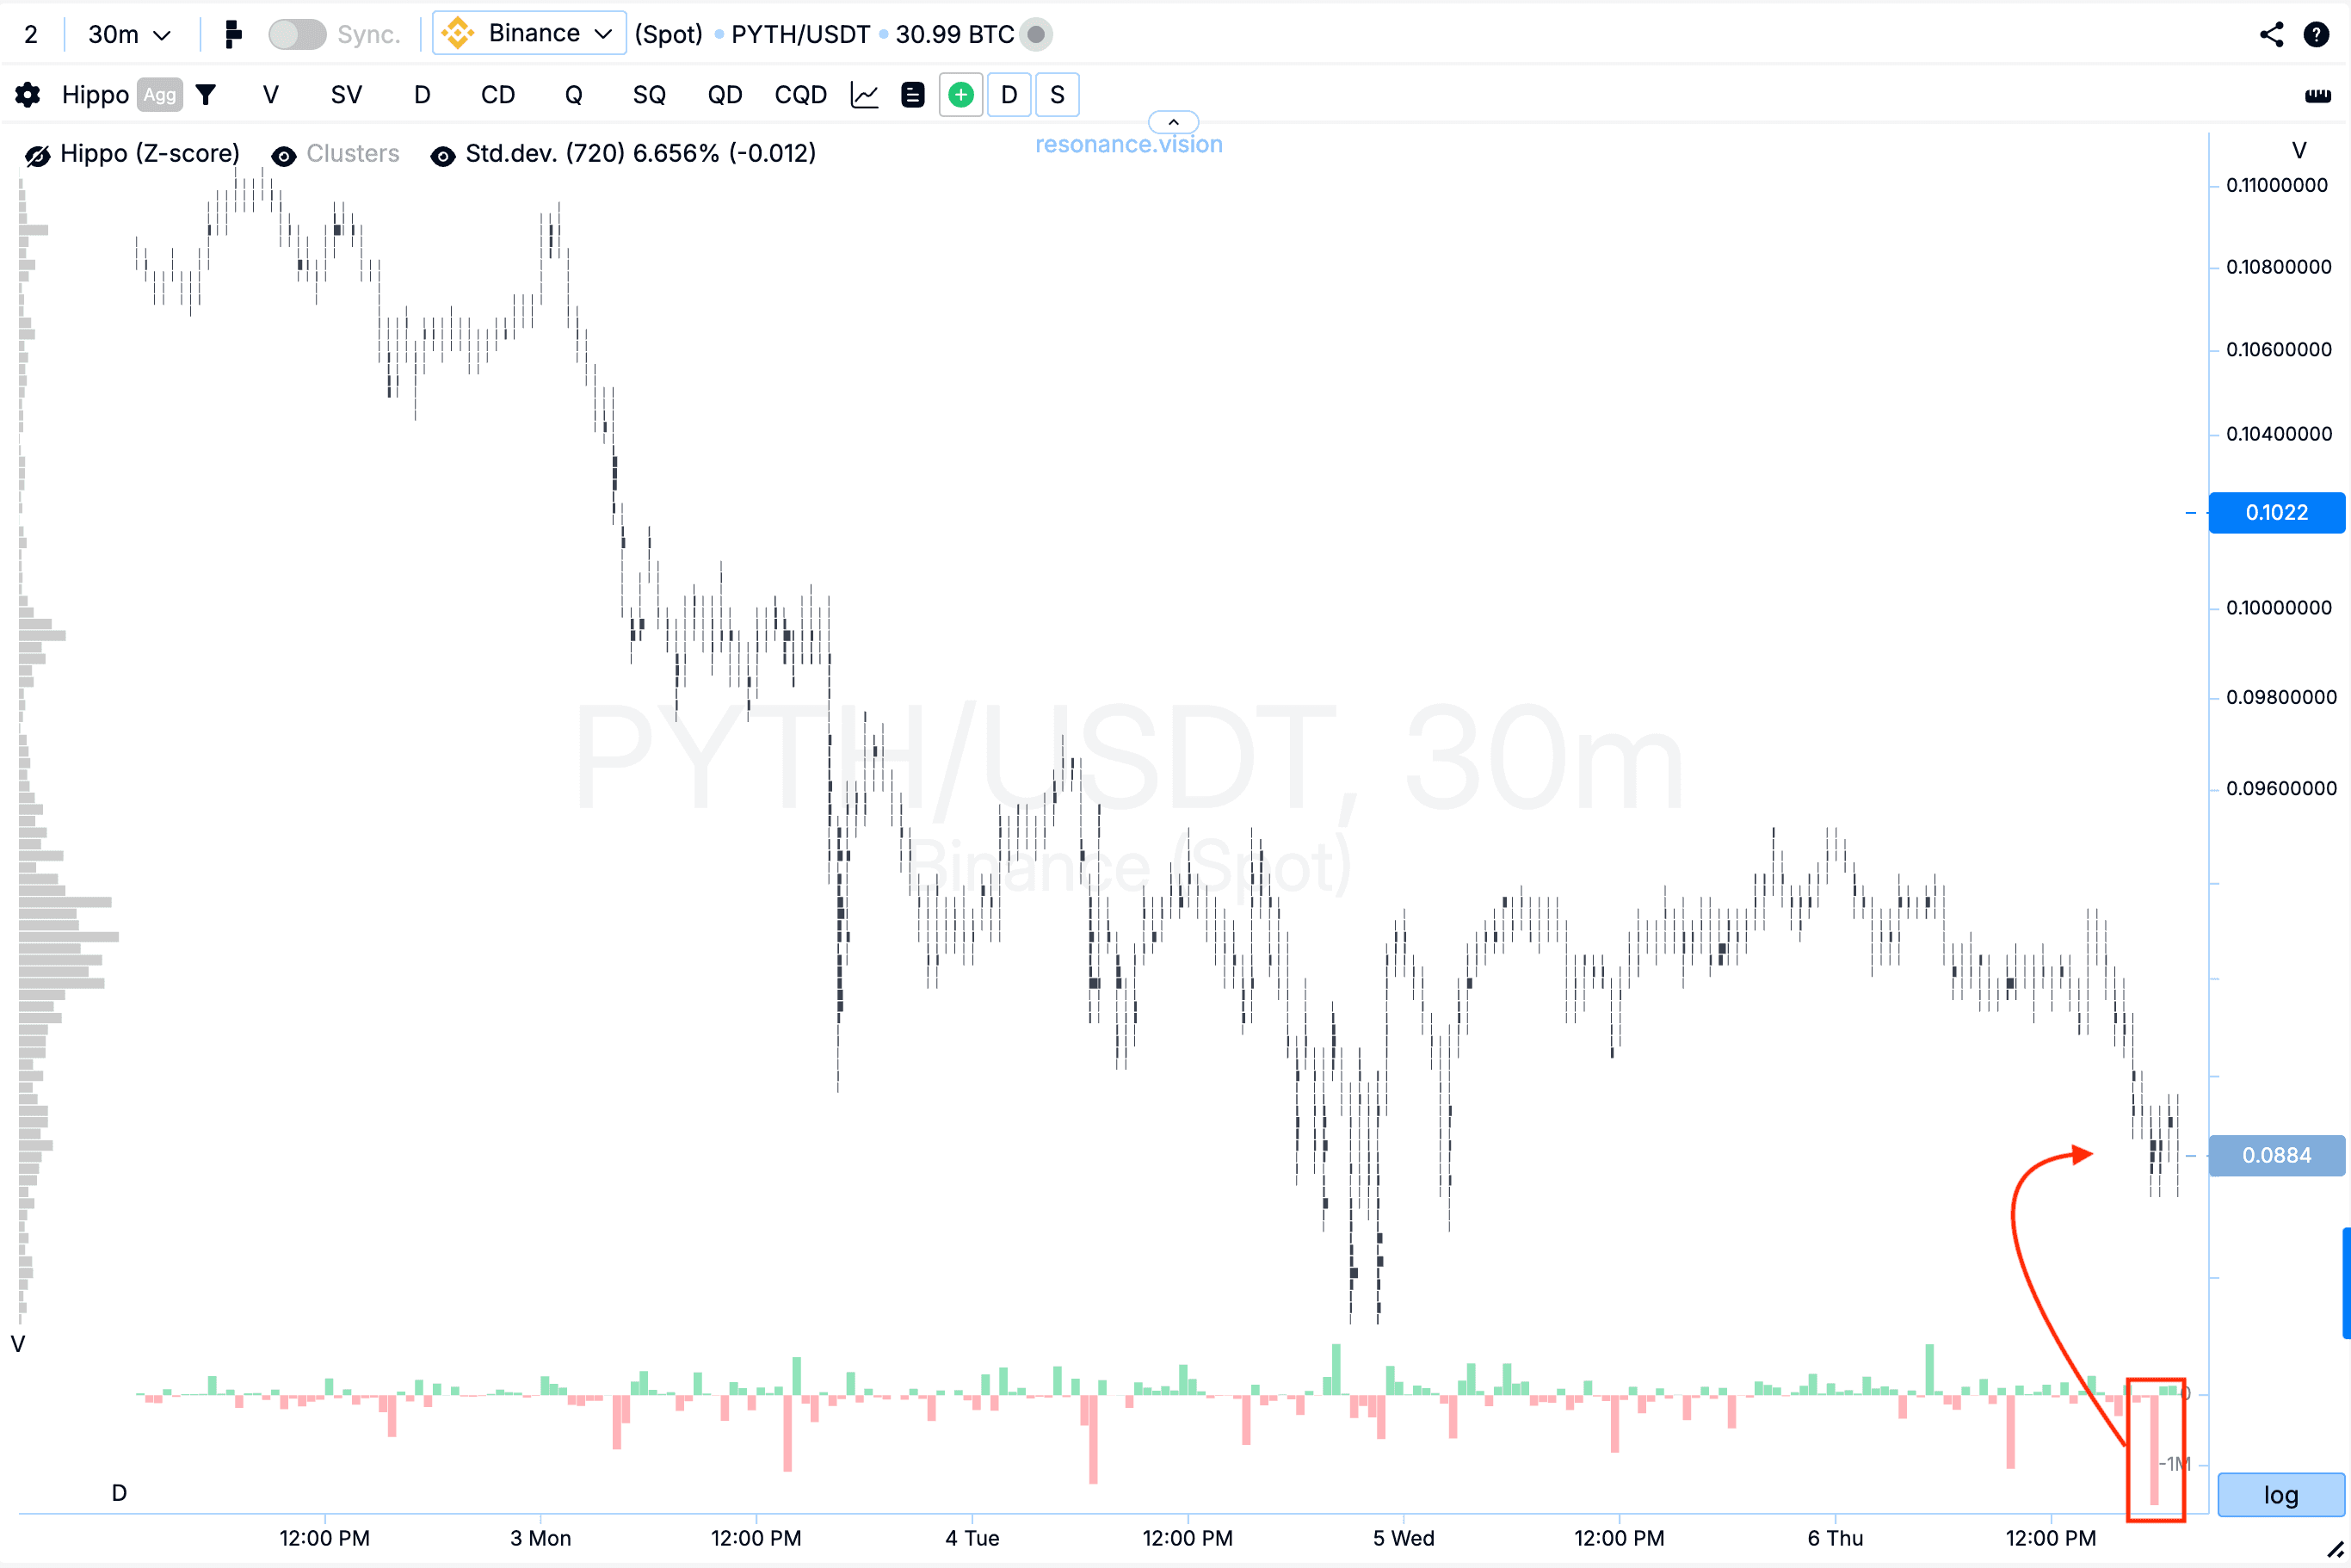
Кластерний графік: на зниженні сформувалася W-подібна формація, в якій при повторному русі вниз з’явилися значні об’єми продажу. Однак ці об’єми не змогли призвести до оновлення локального мінімуму (червоний прямокутник та стрілка). Така динаміка вказує на ознаки локального дефіциту та ослаблення тиску з боку продавців.
У Дешборді
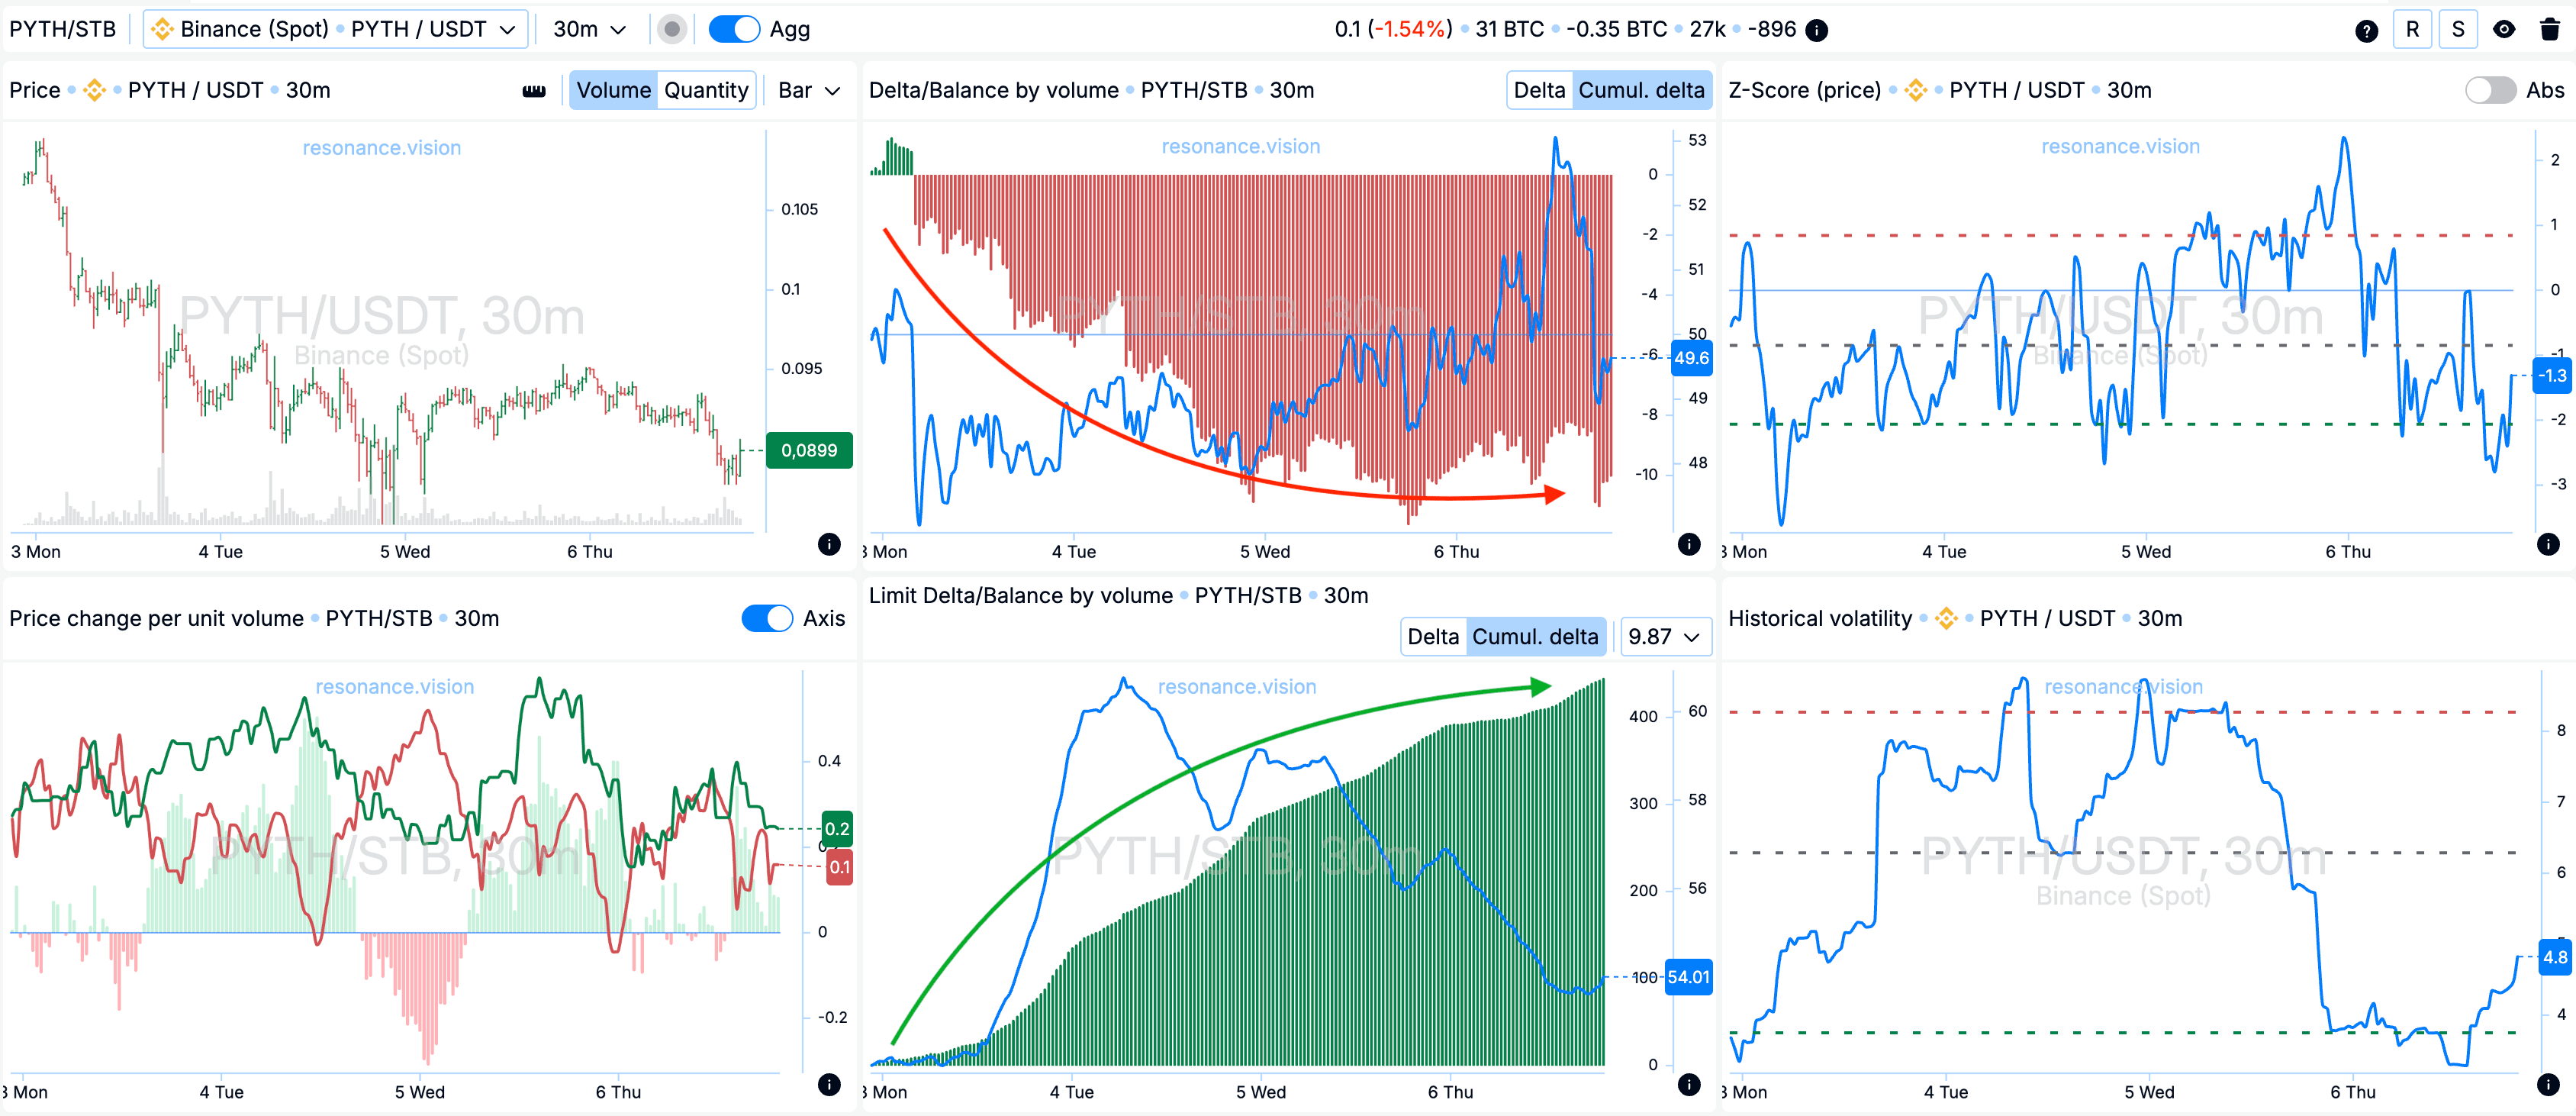
Дельта / Баланс за об’ємом та лімітна дельта: при оцінці агрегованих даних по всіх парах та біржах спостерігається підтвердження картини, зазначеної на кластерному графіку. У цей період ринку домінували об’єми продажів - це чітко видно з гістограмі кумулятивної дельти (червона стрілка). При цьому за лімітними заявками фіксується помітне збільшення кількості заявок на покупку, що відображено на гістограмі кум. дельти (зелена стрілка). Така ситуація вказує на готовність учасників лімітно приймати весь маркет-об’єм на продаж, що формує локальну підтримку.
Причини виходу
Кластерний графік: від точки входу ціна зросла ще на 32,6%, після чого сформувався відкат, після чого наступні покупки вже виявилися неефективними – ціна перестала зростати (зелений прямокутник та стрілка). Додатково зазначу, що ціновий рух становив майже 5 стандартних відхилень, при тому що для даного активу один стандартний рух дорівнює 6,656% (чорний прямокутник і стрілка). Такий рух можна вважати суттєвим та аномальним. У подібних умовах подальше утримання позиції супроводжувалося підвищеними ризиками, тому фіксація прибутку виглядала найбільш раціональним рішенням.

Висновок
У цьому вся розборі видно, як ключову роль зіграло розуміння взаємодії попиту та пропозиції. Незважаючи на активні продажі, ціна не змогла оновити мінімум, що вказувало на локальний дефіцит та готовність учасників лімітно приймати весь ринковий об’єм на продаж. Це дозволило визначити зміну балансу та увійти в позицію в момент, коли ризик був мінімальним.
Зростання більш ніж 30% і досягнення аномального цінового руху підтверджують ефективність аналізу об’ємів та реакції ціни. Важливо пам’ятати - саме поведінка об’єму щодо ціни дає реальне розуміння того, що відбувається на ринку. Дотримуйтесь ризик-менеджменту і на дистанції ви обов’язково відчуєте результат.
Стеж за новими статтями у нашому телеграм каналі.
Не треба вигадувати складних схем та шукати “грааль”. Використовуйте інструменти платформи Resonance.
Реєструйся за посиланням - отримуй бонус і починай заробляти:
OKX | BingX | KuCoin.
Промокод TOPBLOG дає тобі 10% знижки на будь-який тарифний план Resonance.
Рекомендовані статті


