QKC +27,2% (Напрямкова стратегія Resonance)

Розбір QKC/USDT з акцентом на кластери, агреговані дані та реакцію ціни на ринкові продажі. Розглядаємо ознаки локального дефіциту, неефективність продавців та підтвердження точки входу з результатом понад 27% руху.
Зміст

Монета: QKC/USDT
Ризик: середній
Рівень розуміння: новачок
Причини входу
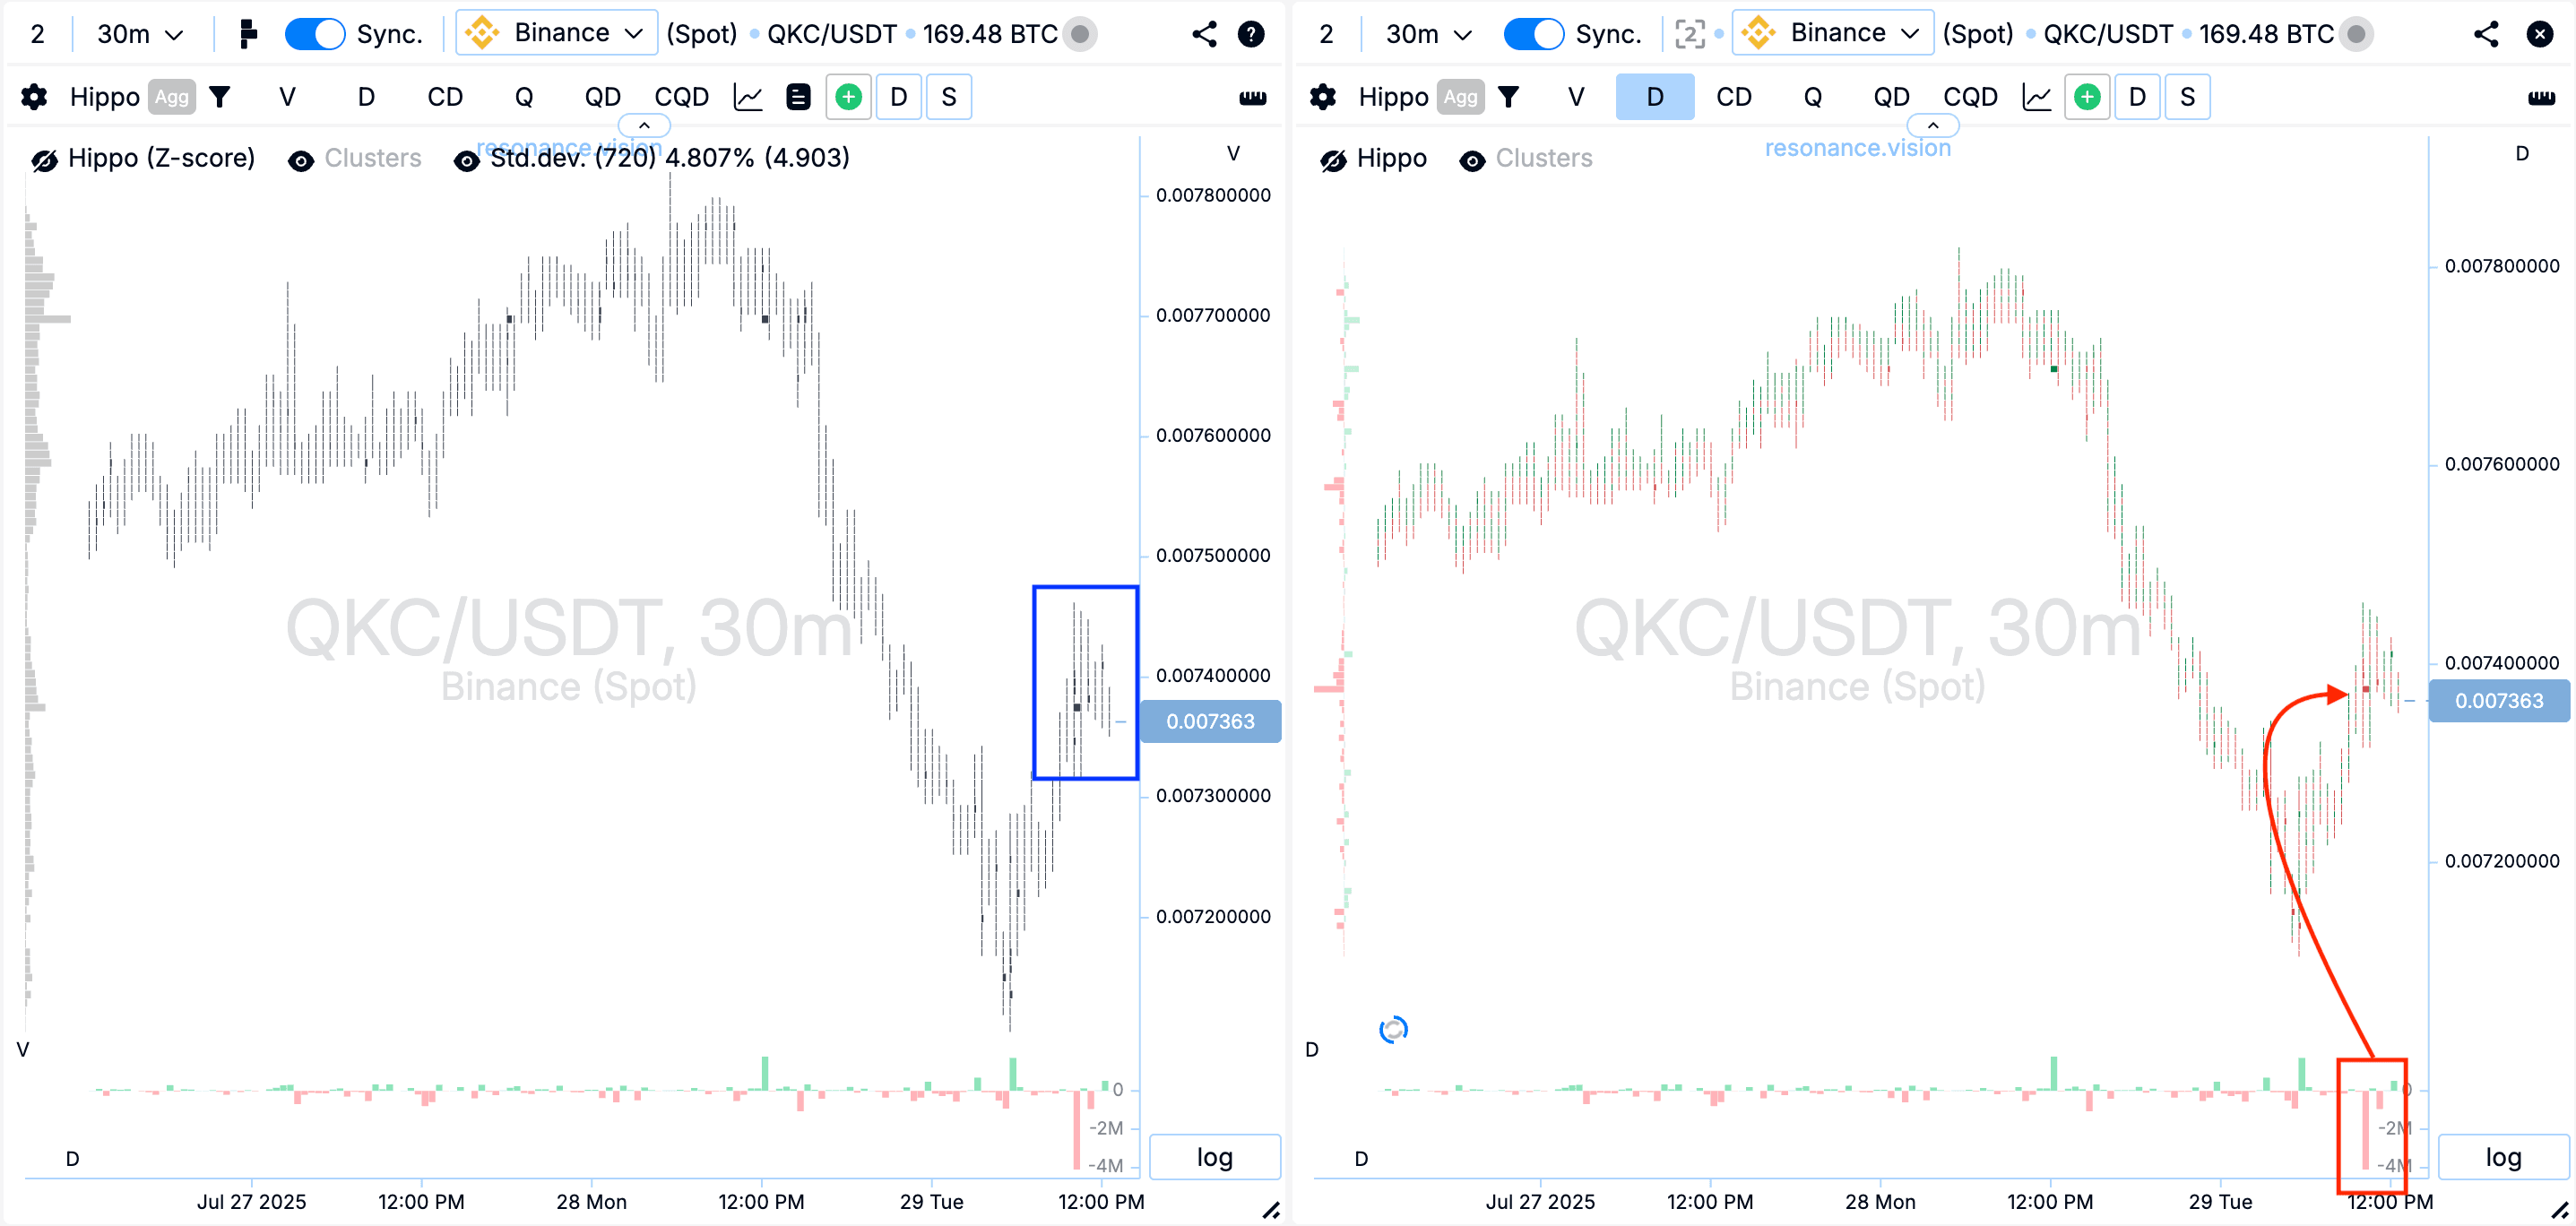
Кластерний графік: почали формуватися об’ємні кластери (синій прямокутник), які супроводжувалися активним ринковим продажем (червоний прямокутник зі стрілкою). Проте ціна на це майже не реагувала – очікуваного зниження не відбулося. Це може вказувати на ознаки локального дефіциту та слабкість з боку продавців.
У Дешборді
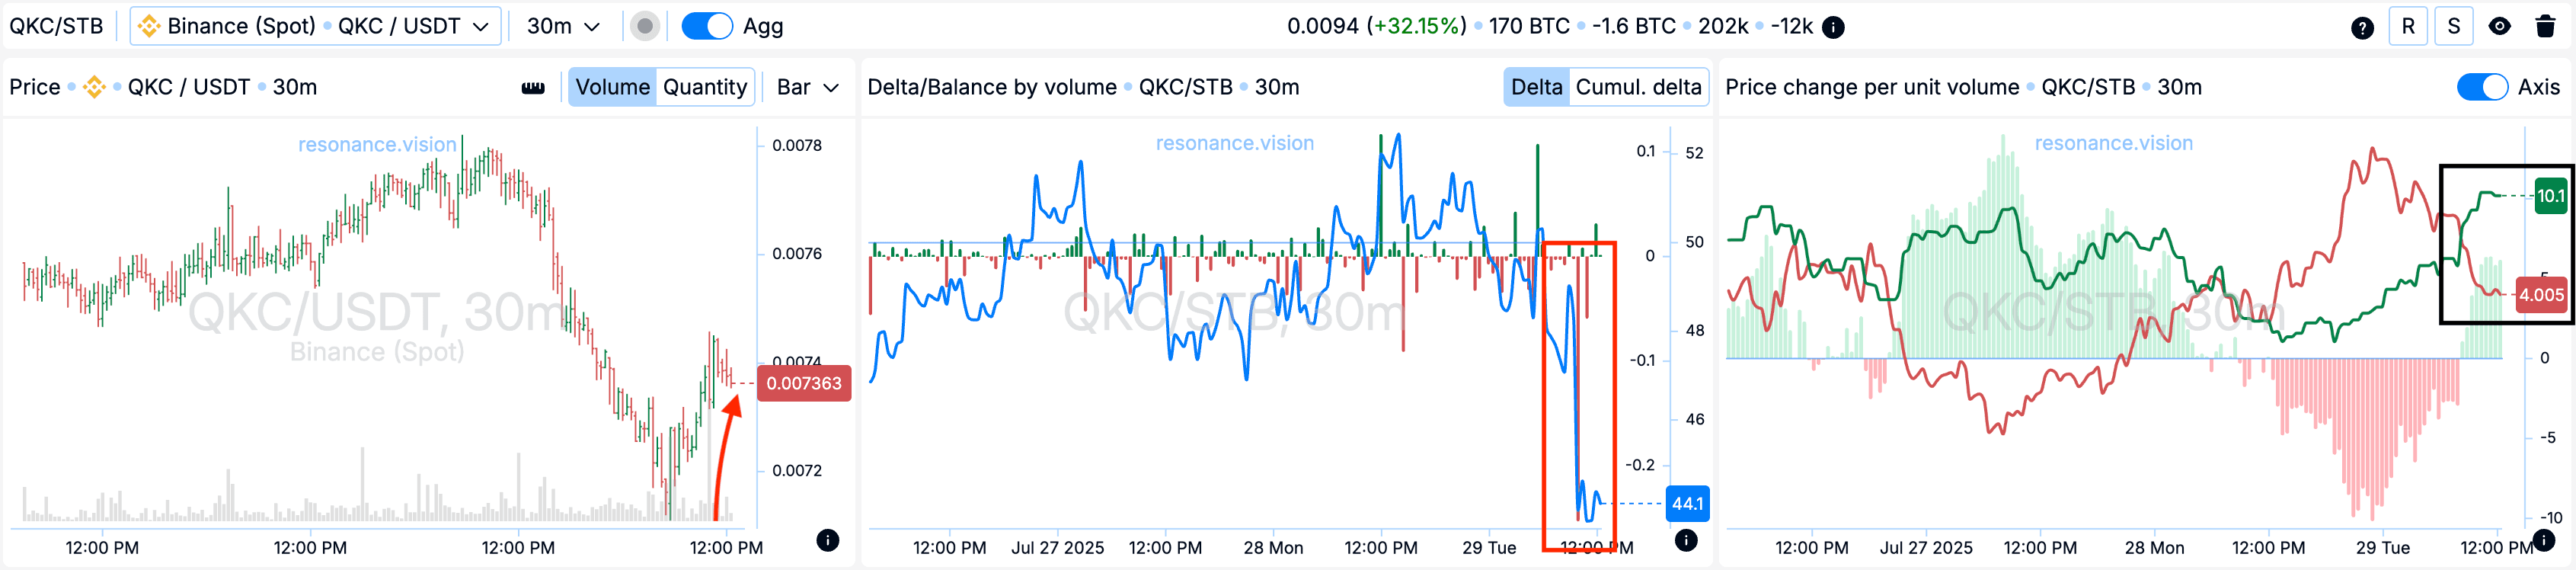
Дельта / Баланс за об’ємом: Агреговані дані показують явну перевагу ринкових продажів по тікеру - на всіх парах і біржах (червоний прямокутник). При цьому ціна, як і раніше, не реагує зниженням, як уже зазначалося вище. Це додатково підтверджує гіпотезу про локальний дефіцит, що зберігається, і посилює аргументи на користь відкриття лонг-позиції.
Ізм. ціни на одиницю об’єму: Ефективність тиску об’єму ринкових ордерів зміну ціни почали розходиться на користь покупців - це видно візуально на графіці (чорний прямокутник).
Причини виходу
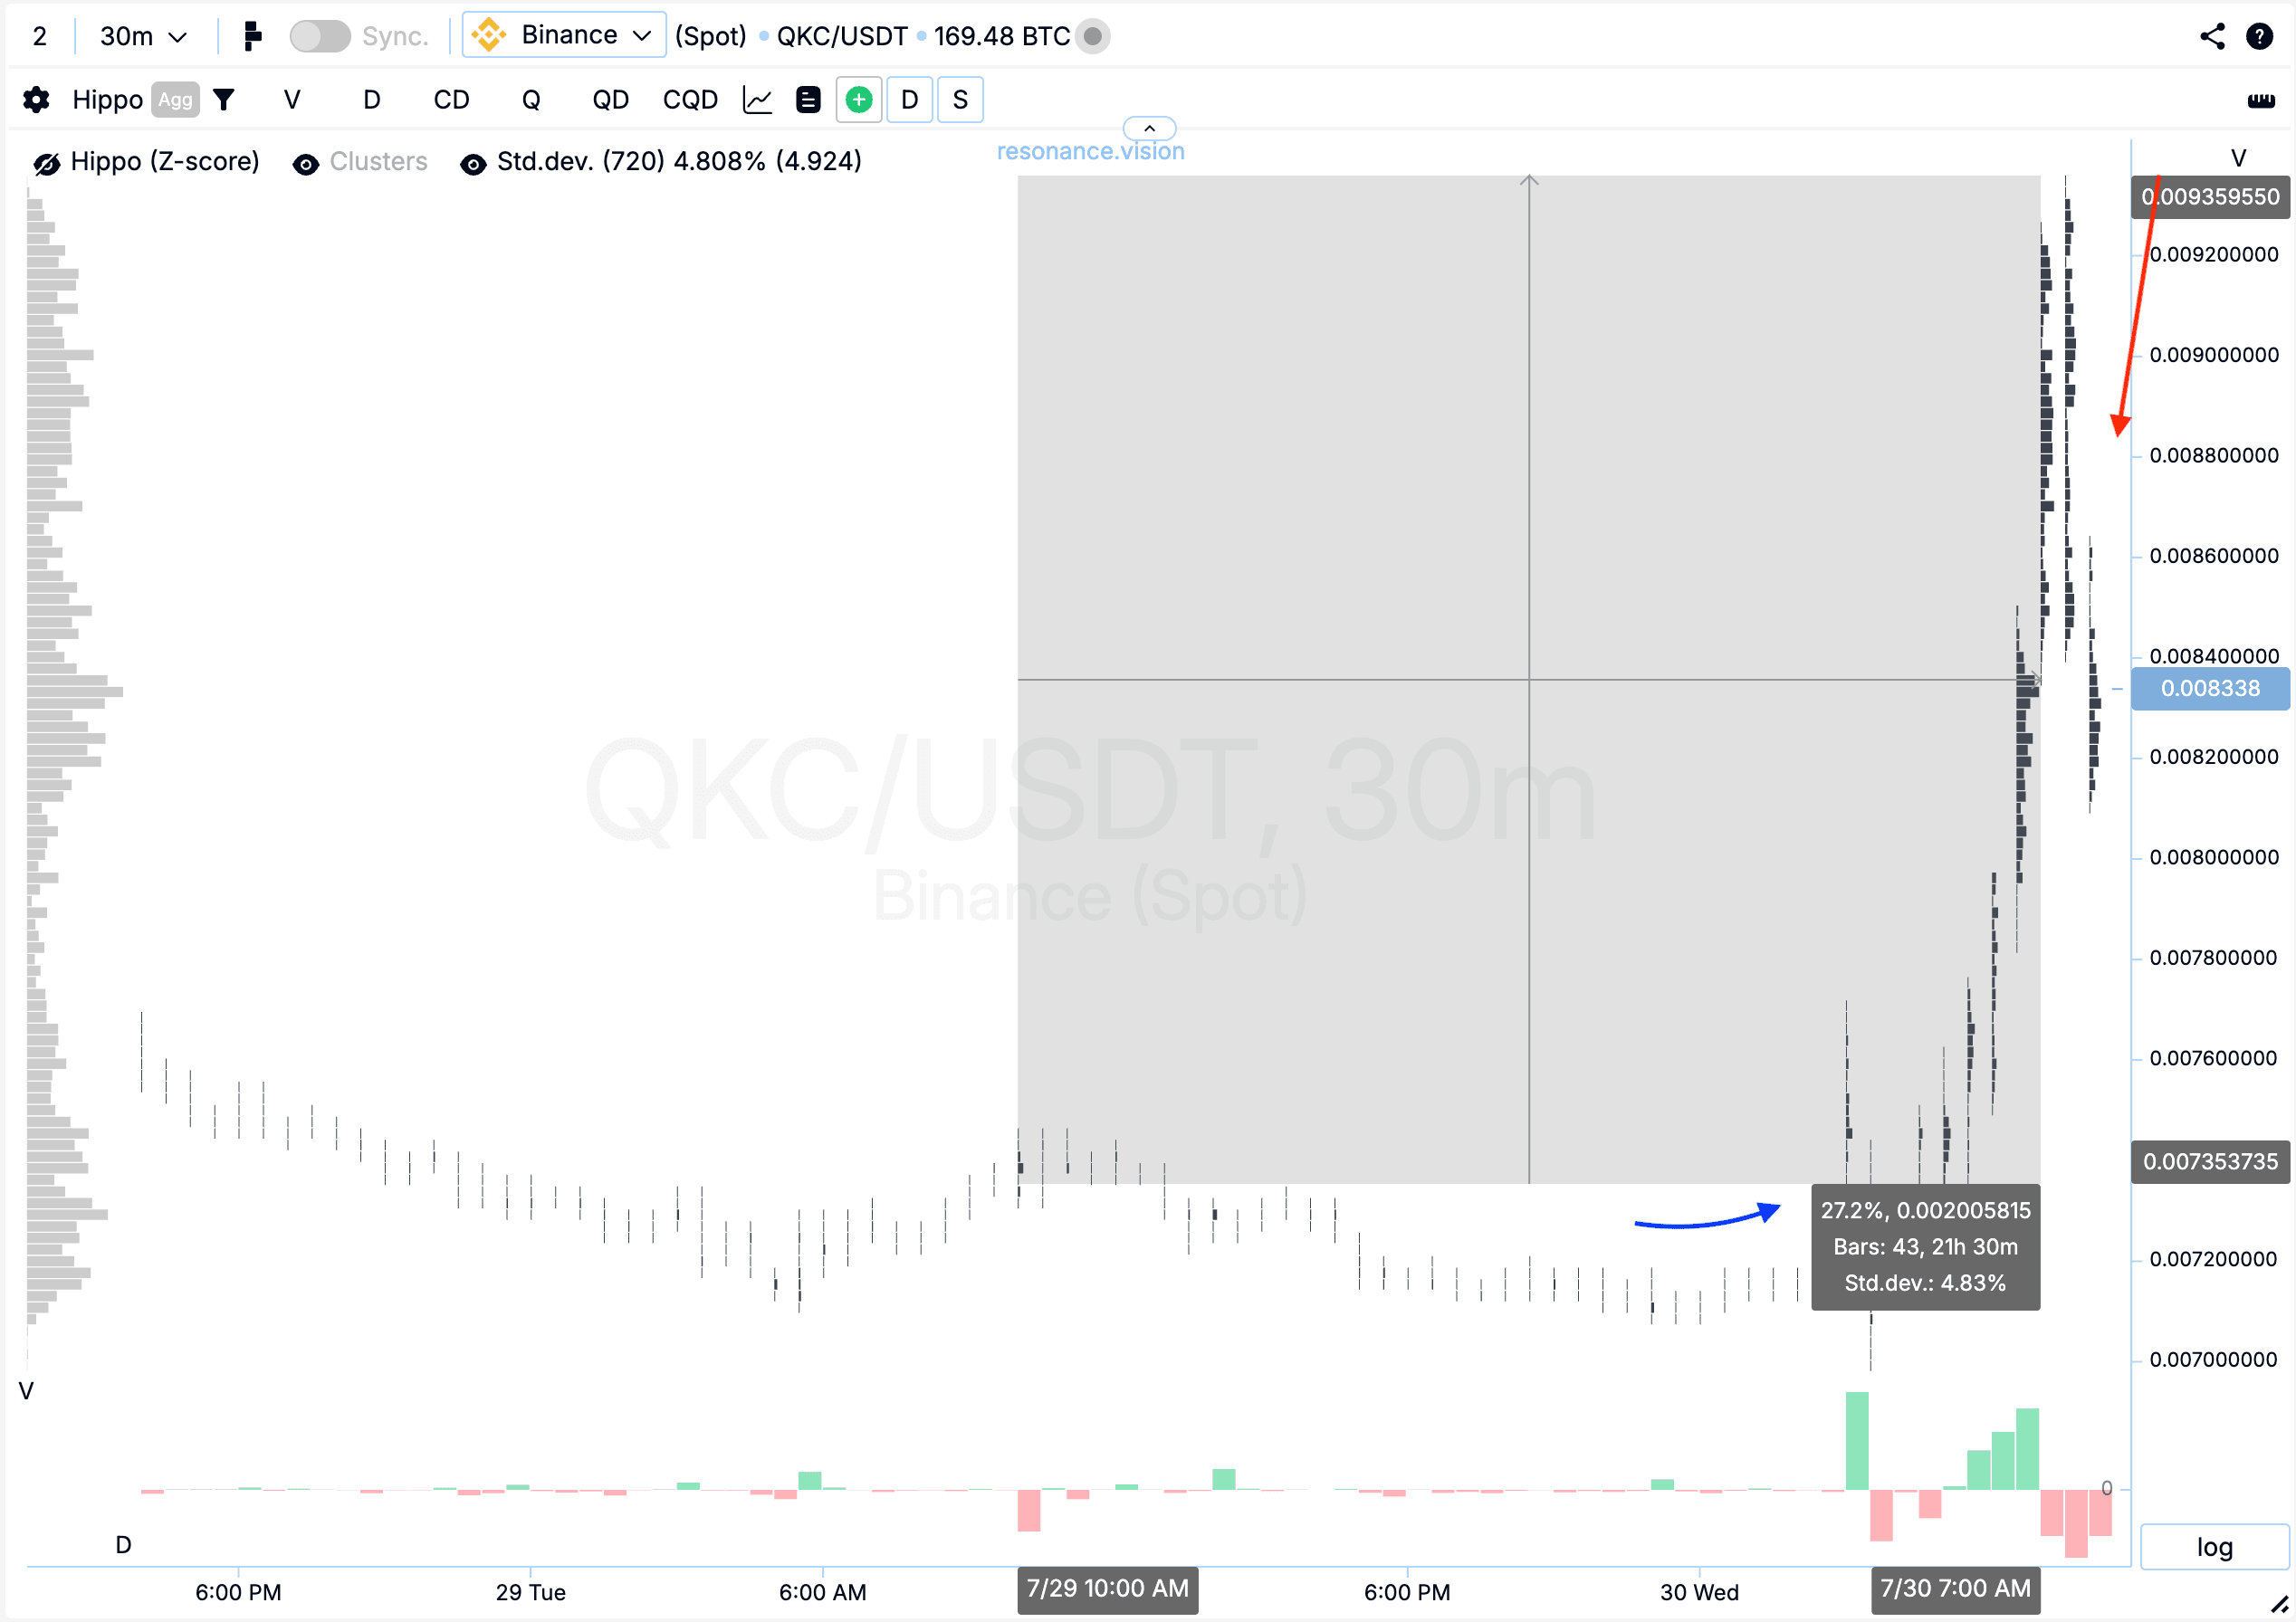
Кластерний графік: Після імпульсного руху почали з’являтися ринкові продажі, на тлі яких ціна трохи відкотилася (позначено червоною стрілкою). Незважаючи на це, від точки входу ціна пройшла більше ніж 27% (синя стрілка), що підтверджує силу імпульсу і є значним рухом.
Висновок
Незважаючи на помітний тиск з боку продавців, як за кластерами, так і за агрегованою дельтою, ціна залишалася стійкою, що вказувало на локальний дефіцит і слабкість продажів. Реакція не забарилася: після входу ціна пройшла більше 27%, що підтверджує коректність гіпотези та якість точки входу. Сценарій відпрацював себе впевнено.
Стеж за новими статтями у нашому телеграм каналі.
Не треба вигадувати складних схем та шукати “грааль”. Використовуйте інструменти платформи Resonance.
Реєструйся за посиланням - отримуй бонус і починай заробляти:
OKX | BingX | KuCoin.
Промокод TOPBLOG дає тобі 10% знижки на будь-який тарифний план Resonance.
Рекомендовані статті


