RENDER +63.9% (Resonance Directional Strategy)

An example of a trade where a price increase amid market selling indicated a local shortage and strong demand. Entry and exit were determined by volume, price reaction, and a change in market momentum.
Table of contents

Coin: RENDER/USDT
Risk: high
Level of understanding: beginner
Reasons for entry
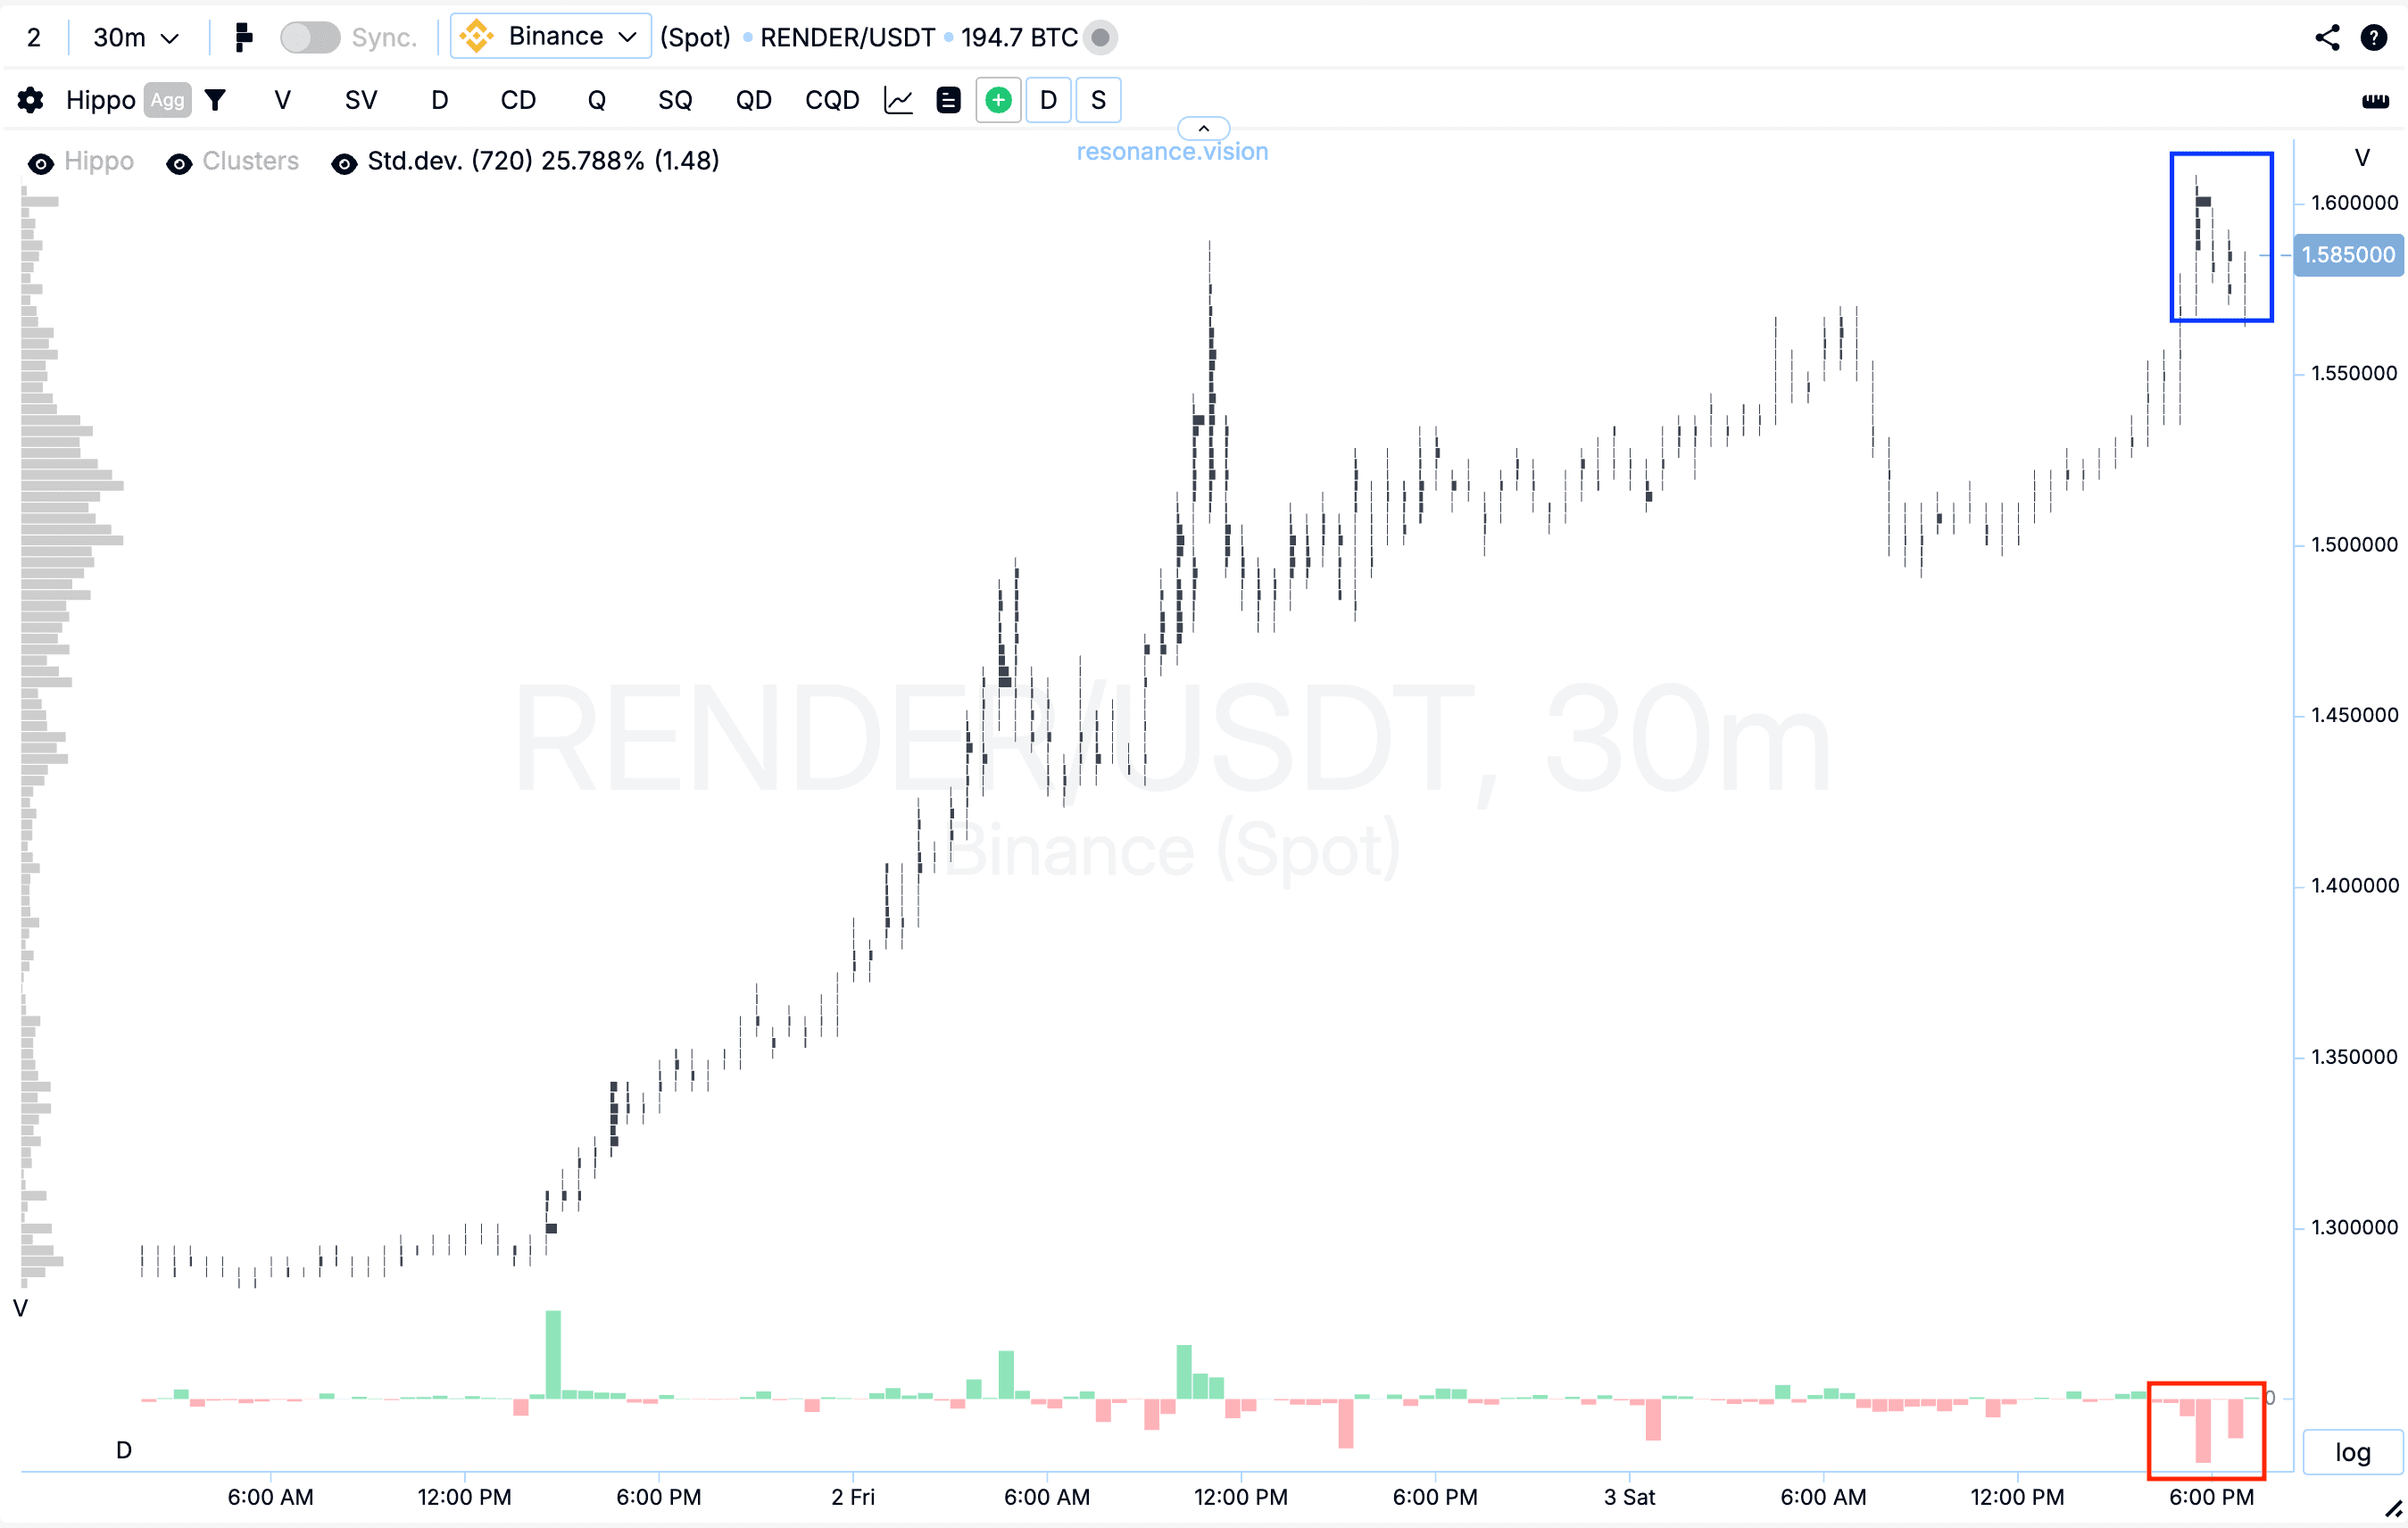
Cluster chart: during the repeated upward move, large volume clusters began to form (blue rectangle), within which noticeable market sell orders were executed (red rectangle). However, despite increasing selling pressure, the price not only failed to decline but instead continued to rise gradually. Such market behavior indicates growing demand and the presence of a local deficit: sellers keep spending volume, but their impact on price becomes ineffective.
In the Dashboard
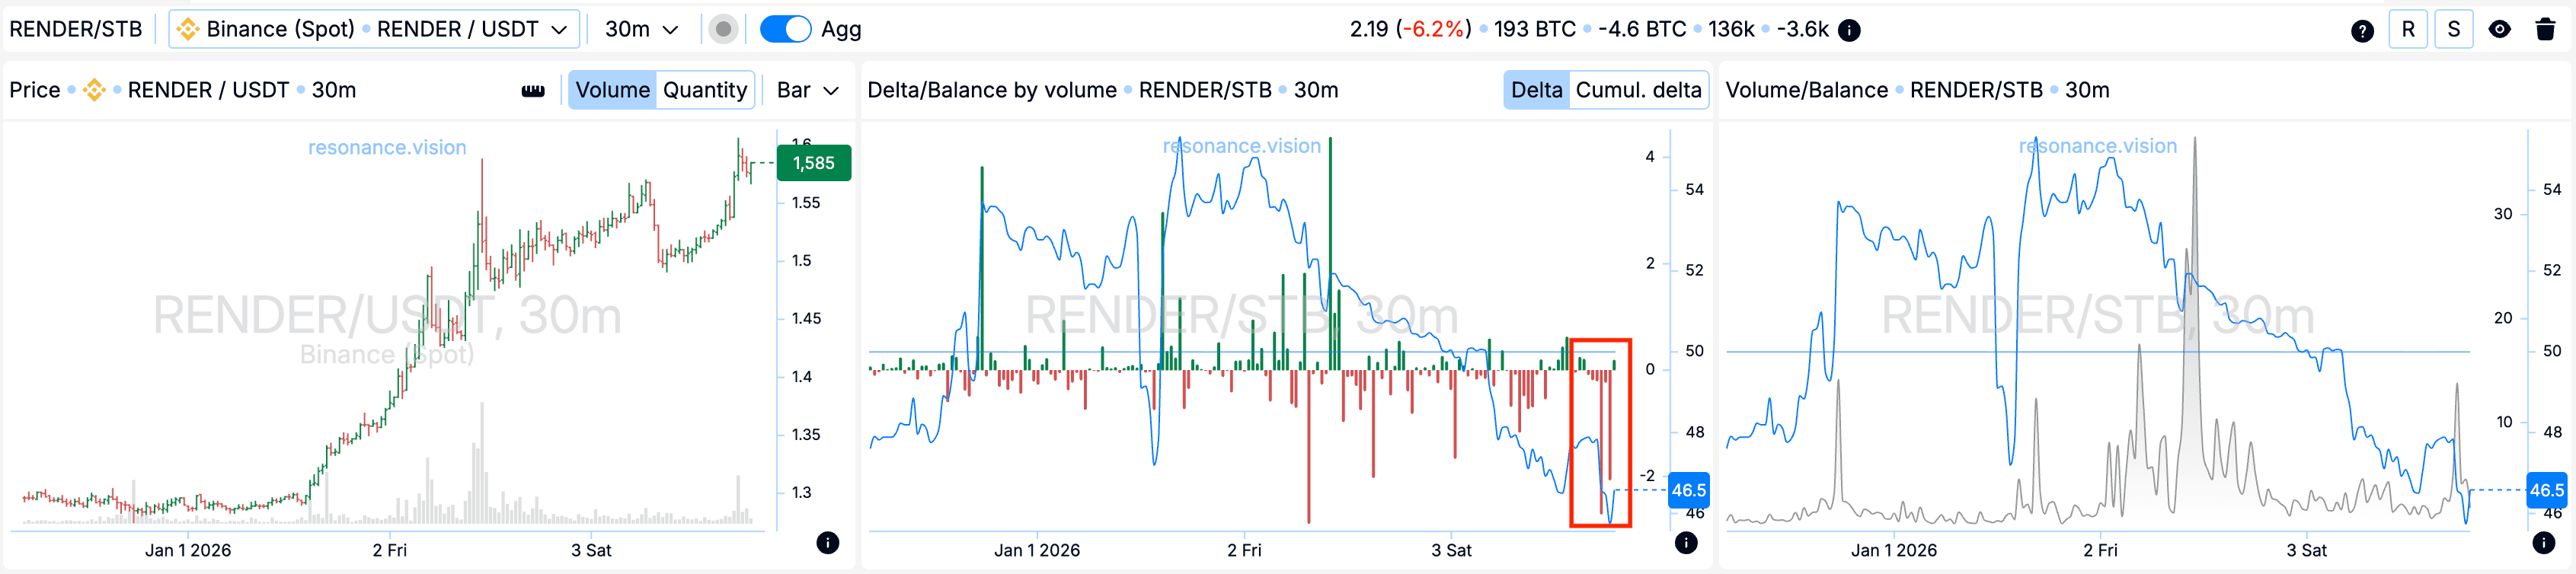
Delta / Volume balance: aggregated data across all pairs and exchanges confirms the picture observed on the cluster chart. During the analyzed period, market sell volumes increased noticeably (red rectangle), while the price remained stable and showed no signs of decline. This combination indicates that participants are willing to absorb incoming market sell volume with limit orders, forming local support within the price range.
Reasons for exit
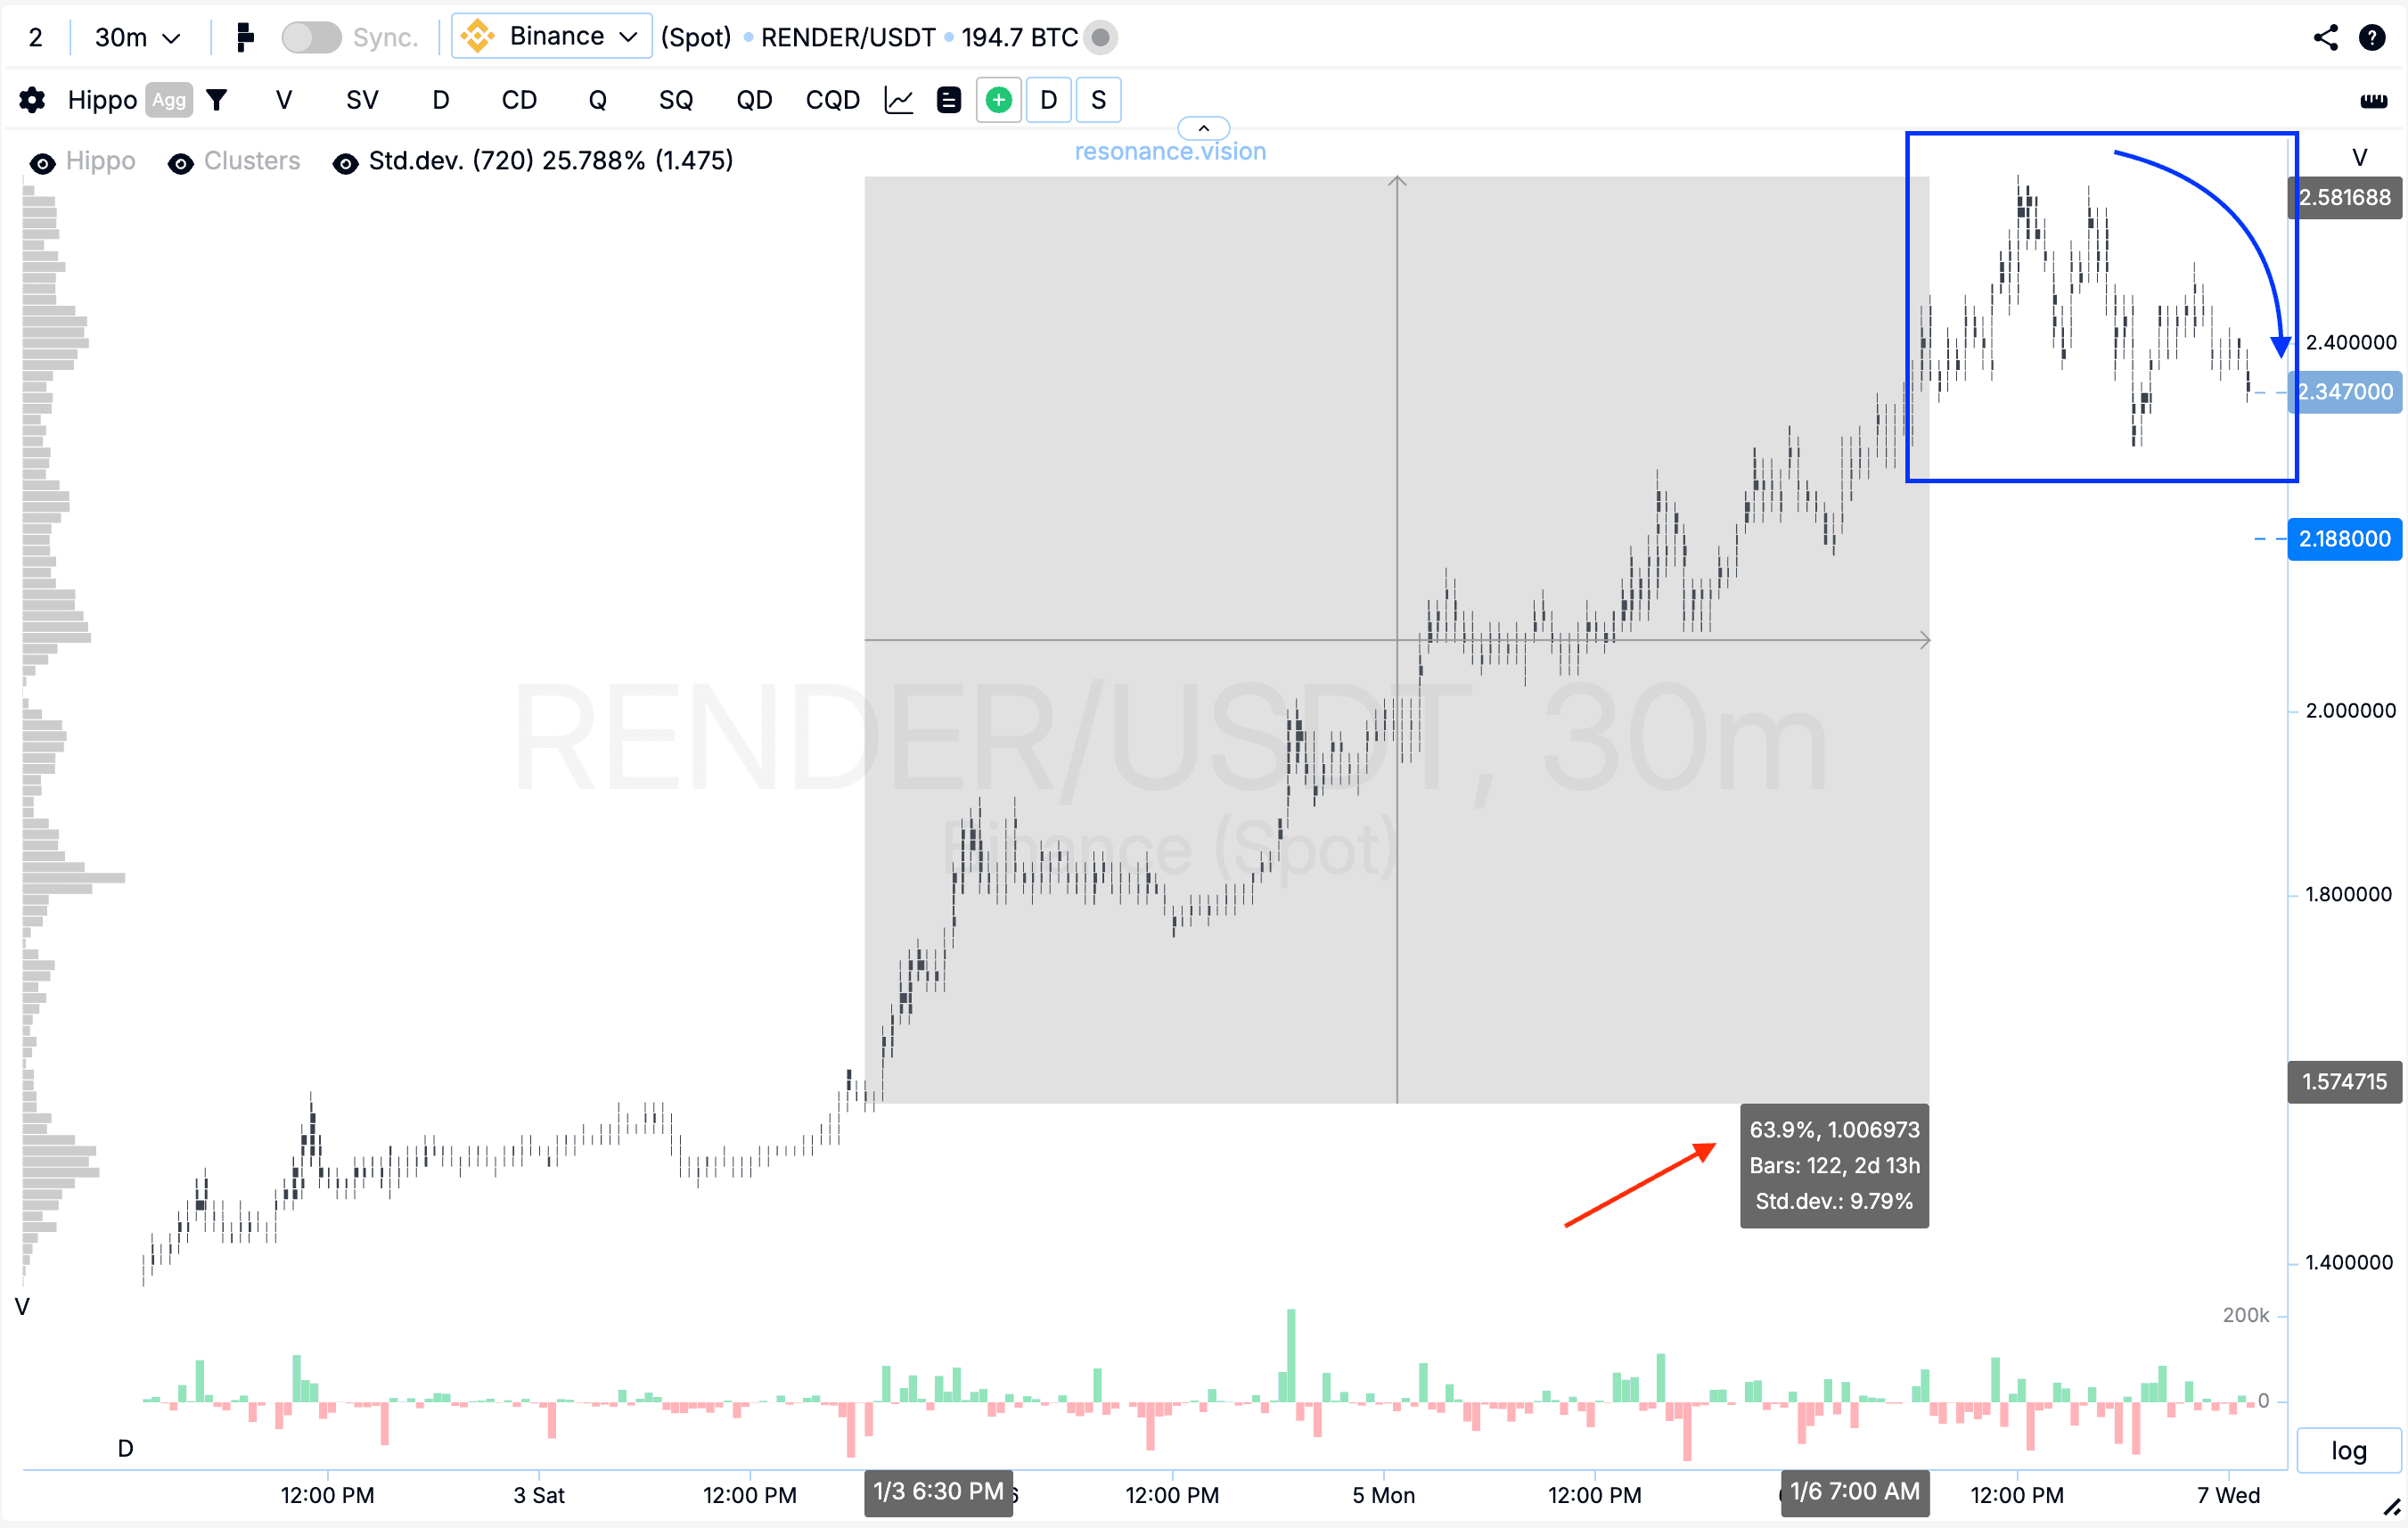
Cluster chart: after the entry point, the price increased by more than 60%, which represents a significant price movement (red arrow). Within the highlighted range, volatility increased substantially, followed by a pullback (blue rectangle and arrow). Such dynamics raise the risks of further position holding and often indicate that the market is entering a balance-search phase. Under these conditions, closing the position was the most rational decision, allowing the already realized move to be secured while reducing risk.
Conclusion
This analysis clearly demonstrates how volume analysis and price reaction help to timely identify shifts in market initiative. Despite the dominance of market sell orders, the price showed strength and continued to rise, indicating strong limit demand and the formation of a local deficit. A comprehensive assessment of the cluster chart and aggregated delta data made it possible to objectively determine the entry point, while the subsequent increase in volatility and the appearance of a pullback served as a logical signal to exit the position. This approach allows movements to be managed consciously, with clear logic and controlled risk.
Follow new insights in our telegram channel.
No need to invent complex schemes and look for the "grail". Use the Resonance platform tools.
Register via the link — get a bonus and start earning:
OKX | BingX | KuCoin.
Promo code TOPBLOG gives you a 10% discount on any Resonance tariff plan.
Recommended articles


