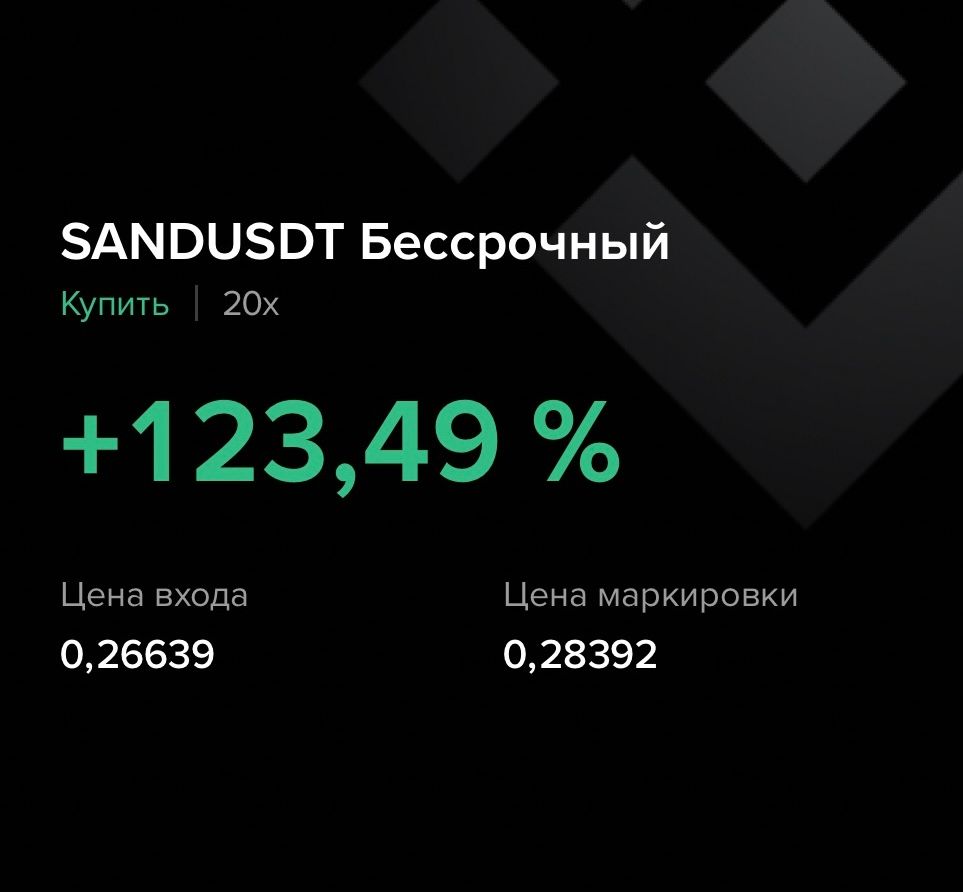
SAND +123.49% (Спрямована стратегія Резонанс)

У цьому розборі розглянуто угоду щодо SAND/USDT, де поєднання кластерного аналізу, теплової карти та даних Дешборда допомогло визначити зміну ініціативи від продавців до покупців. Незважаючи на тиск з боку маркет-продажів, ціна втрималася завдяки лімітній підтримці знизу, що стало основою входу в лонг. Фіксація прибутку відбулася після ослаблення купівельної активності та зниження ефективності обсягів.
Зміст

Монета: SAND/USDT
Ризик: середній
Рівень розуміння: новачок
Причини входу
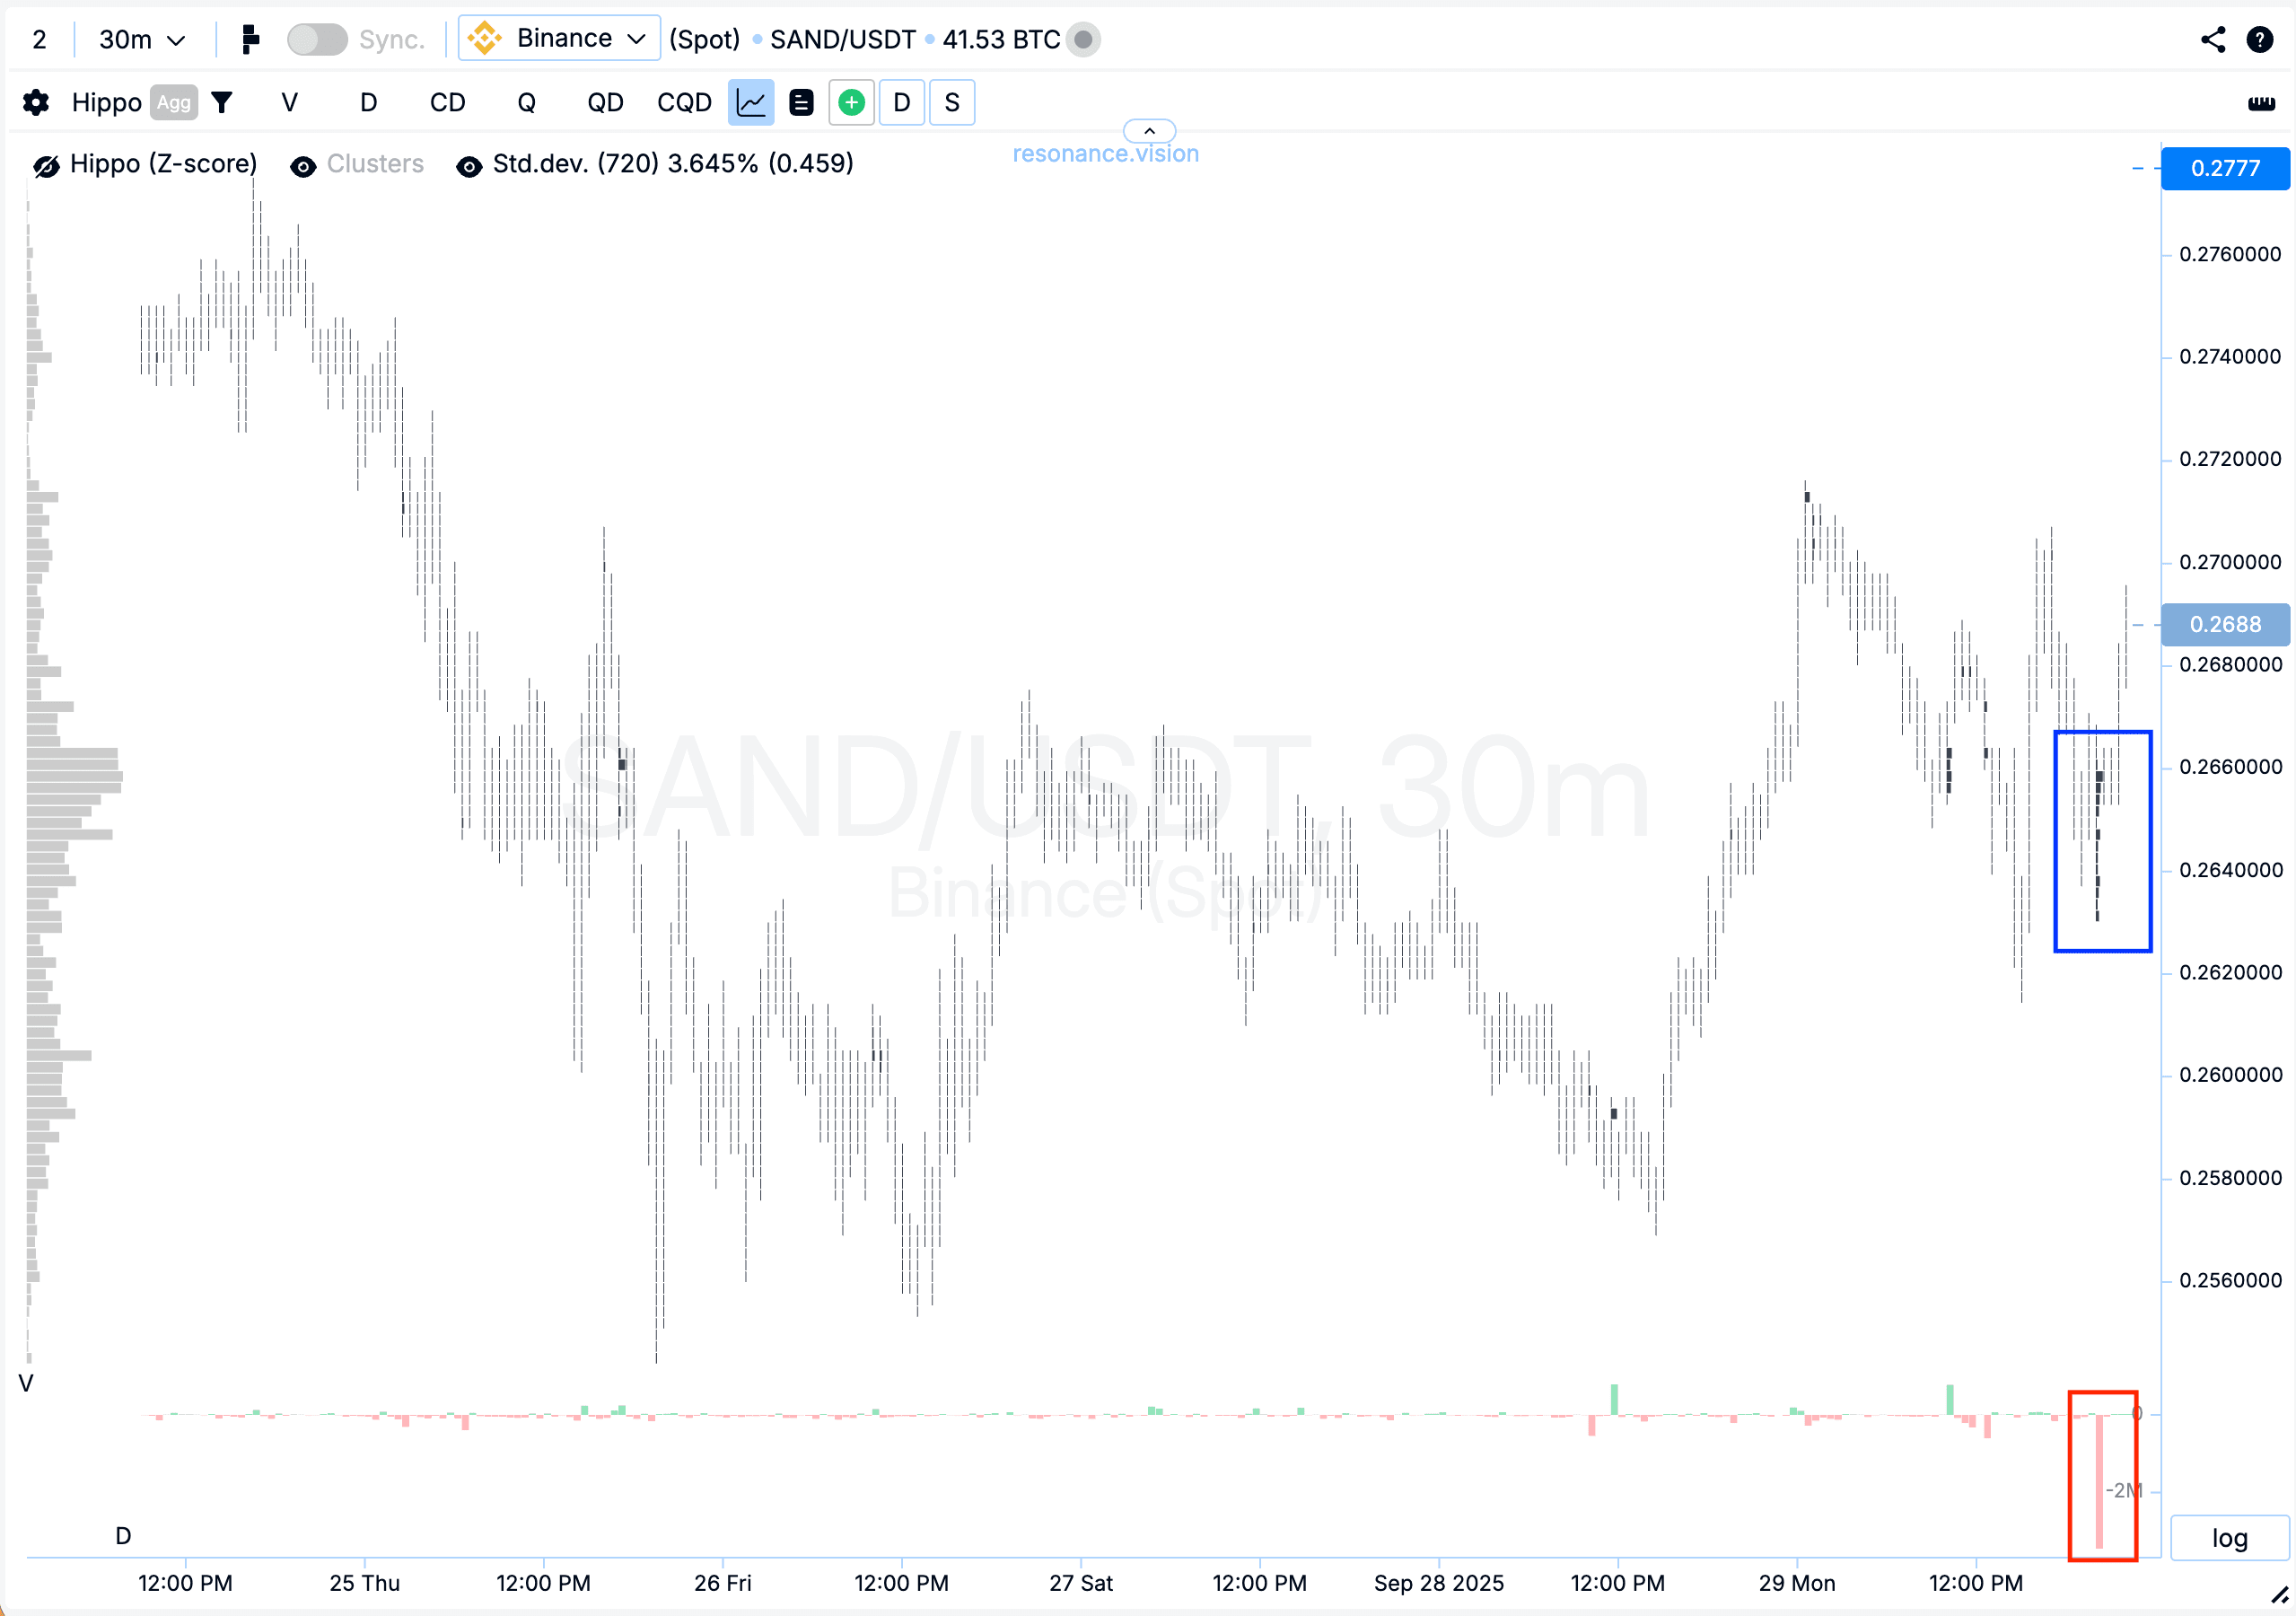
Кластерний графік: почали формуватися об’ємні кластери (синій прямокутник), у яких помітно переважали продажі (червоний прямокутник). Незважаючи на тиск продавців, ціна не оновлює локальний мінімум і утримується в ціновому діапазоні. Це вказує на локальний дефіцит та ослаблення ініціативи з боку продавців.
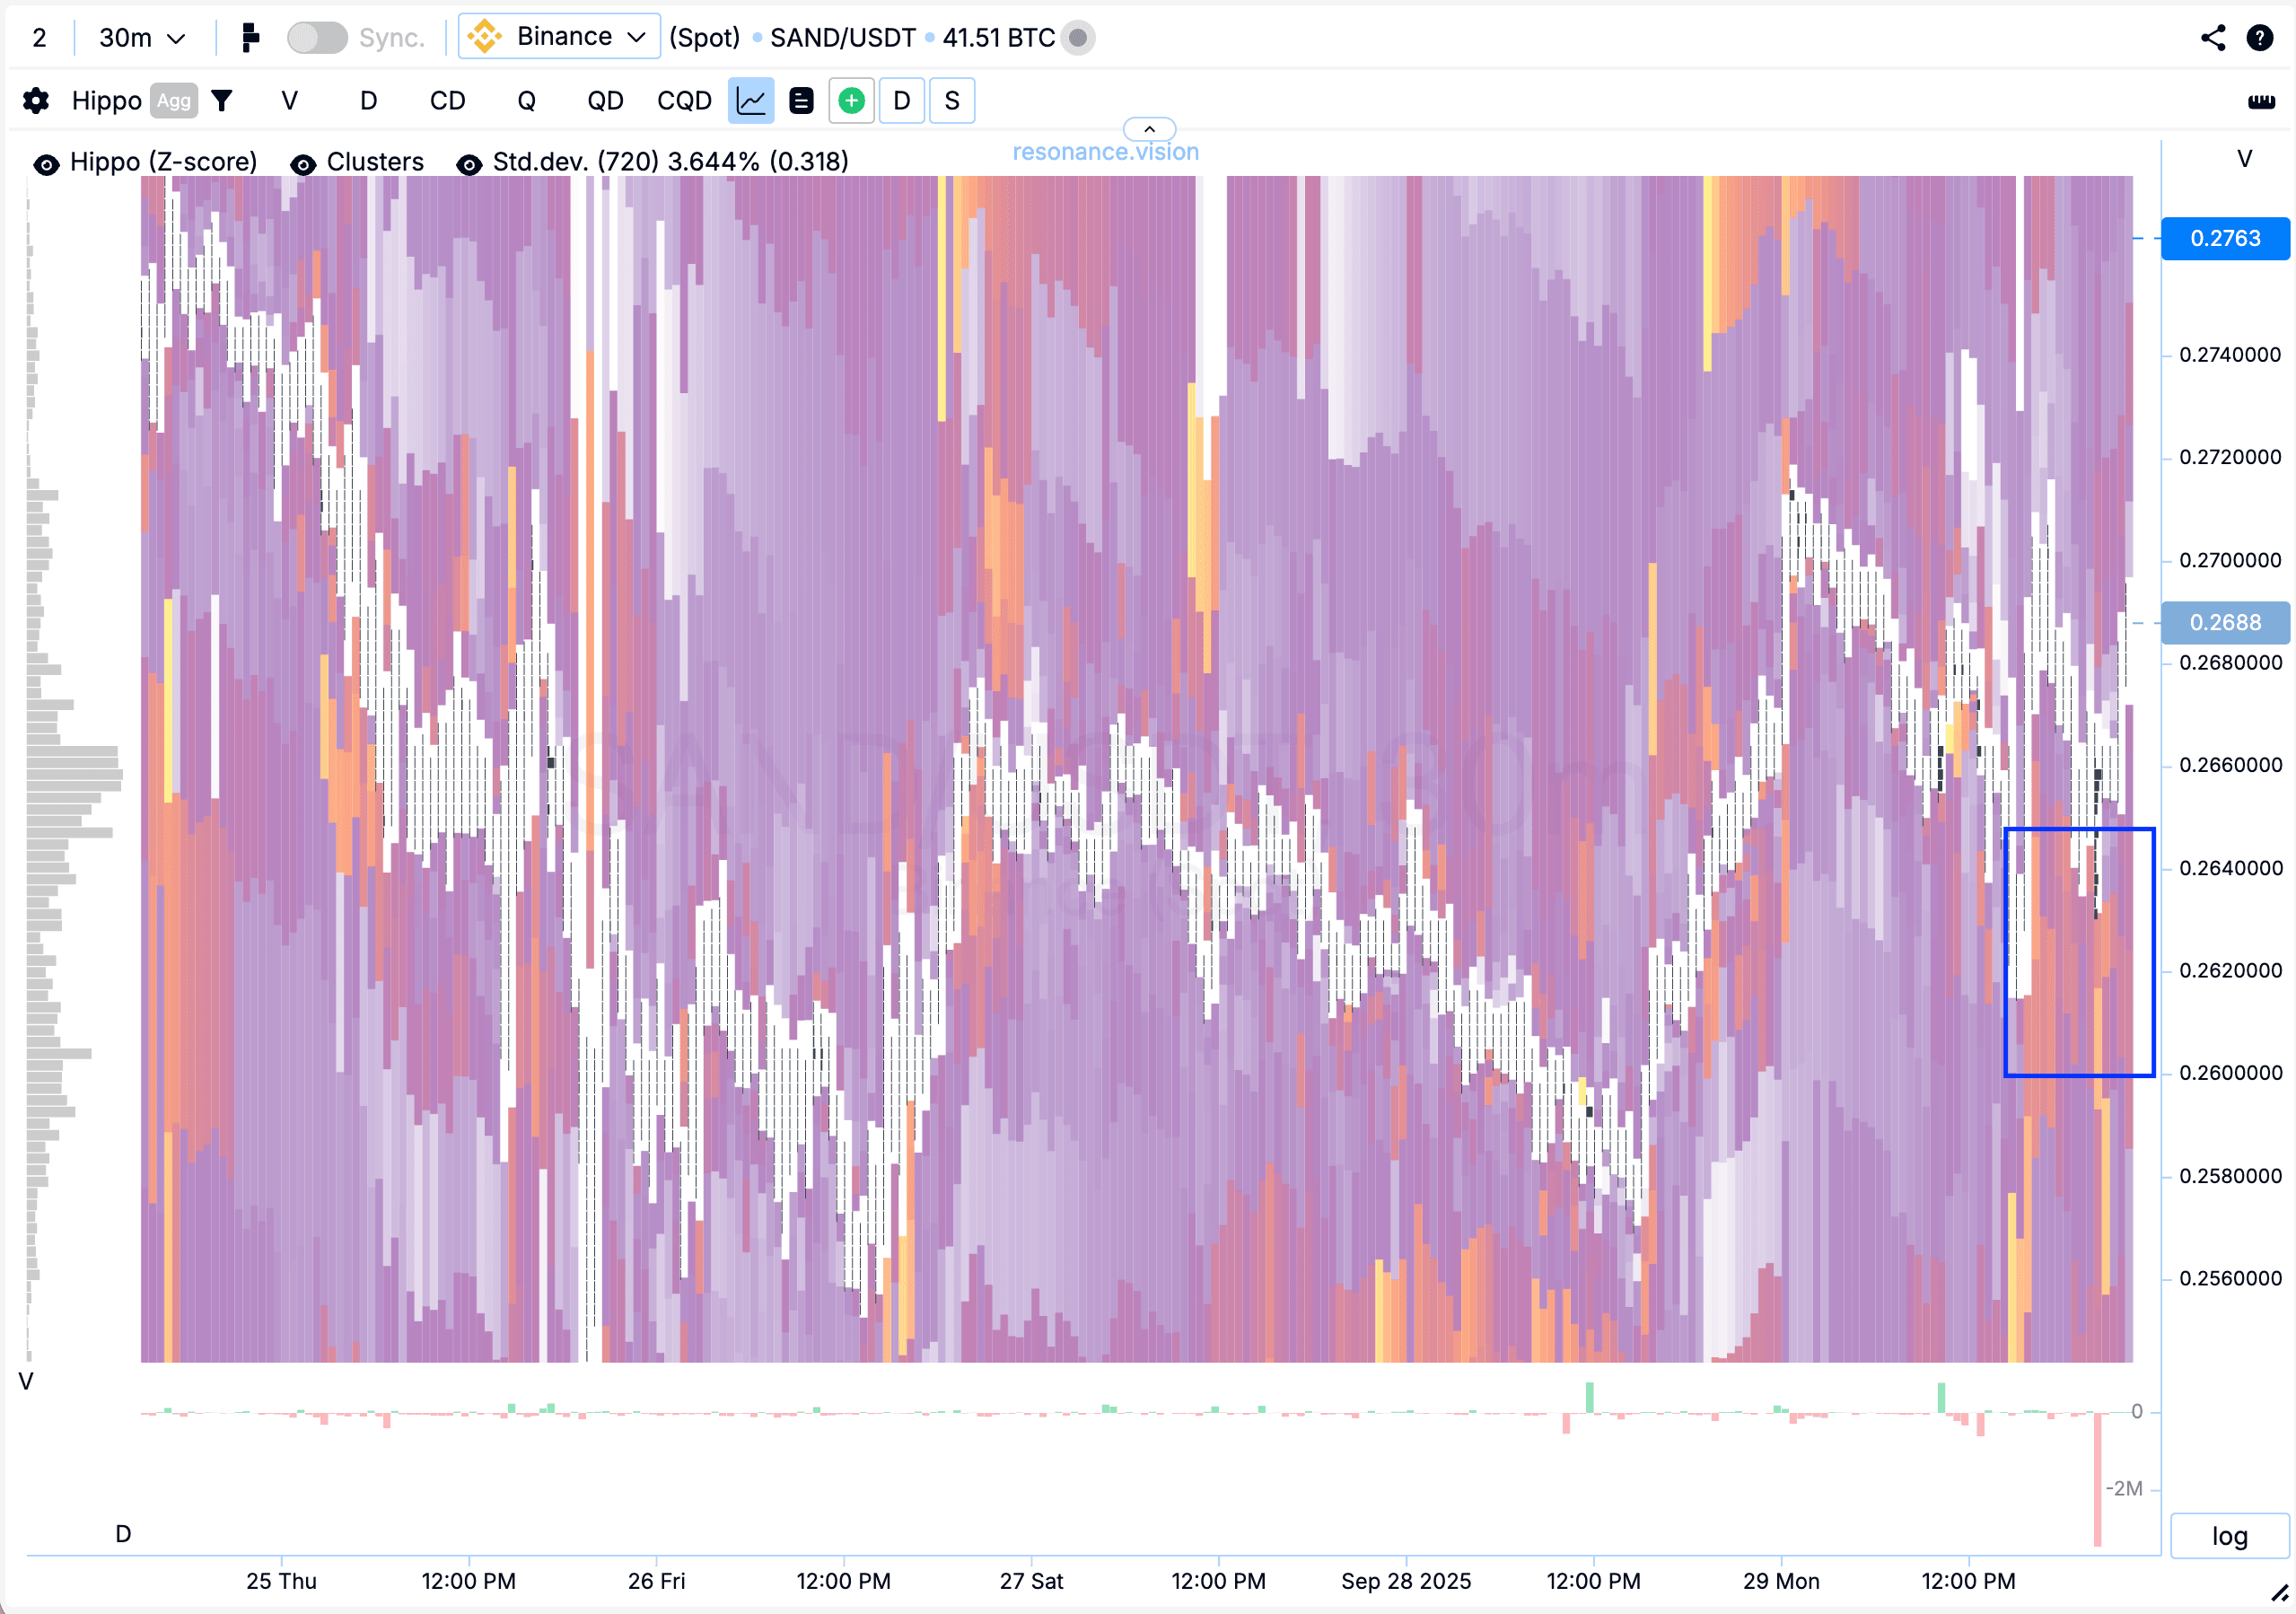
Теплова карта (Z-Score): відзначаються аномальні лімітні щільності на покупку (синій прямокутник), які поглинули об’єми маркет продажу. Така динаміка вказує на збереження ознак локального дефіциту та готовність покупців утримувати рівень.
У Дешборді
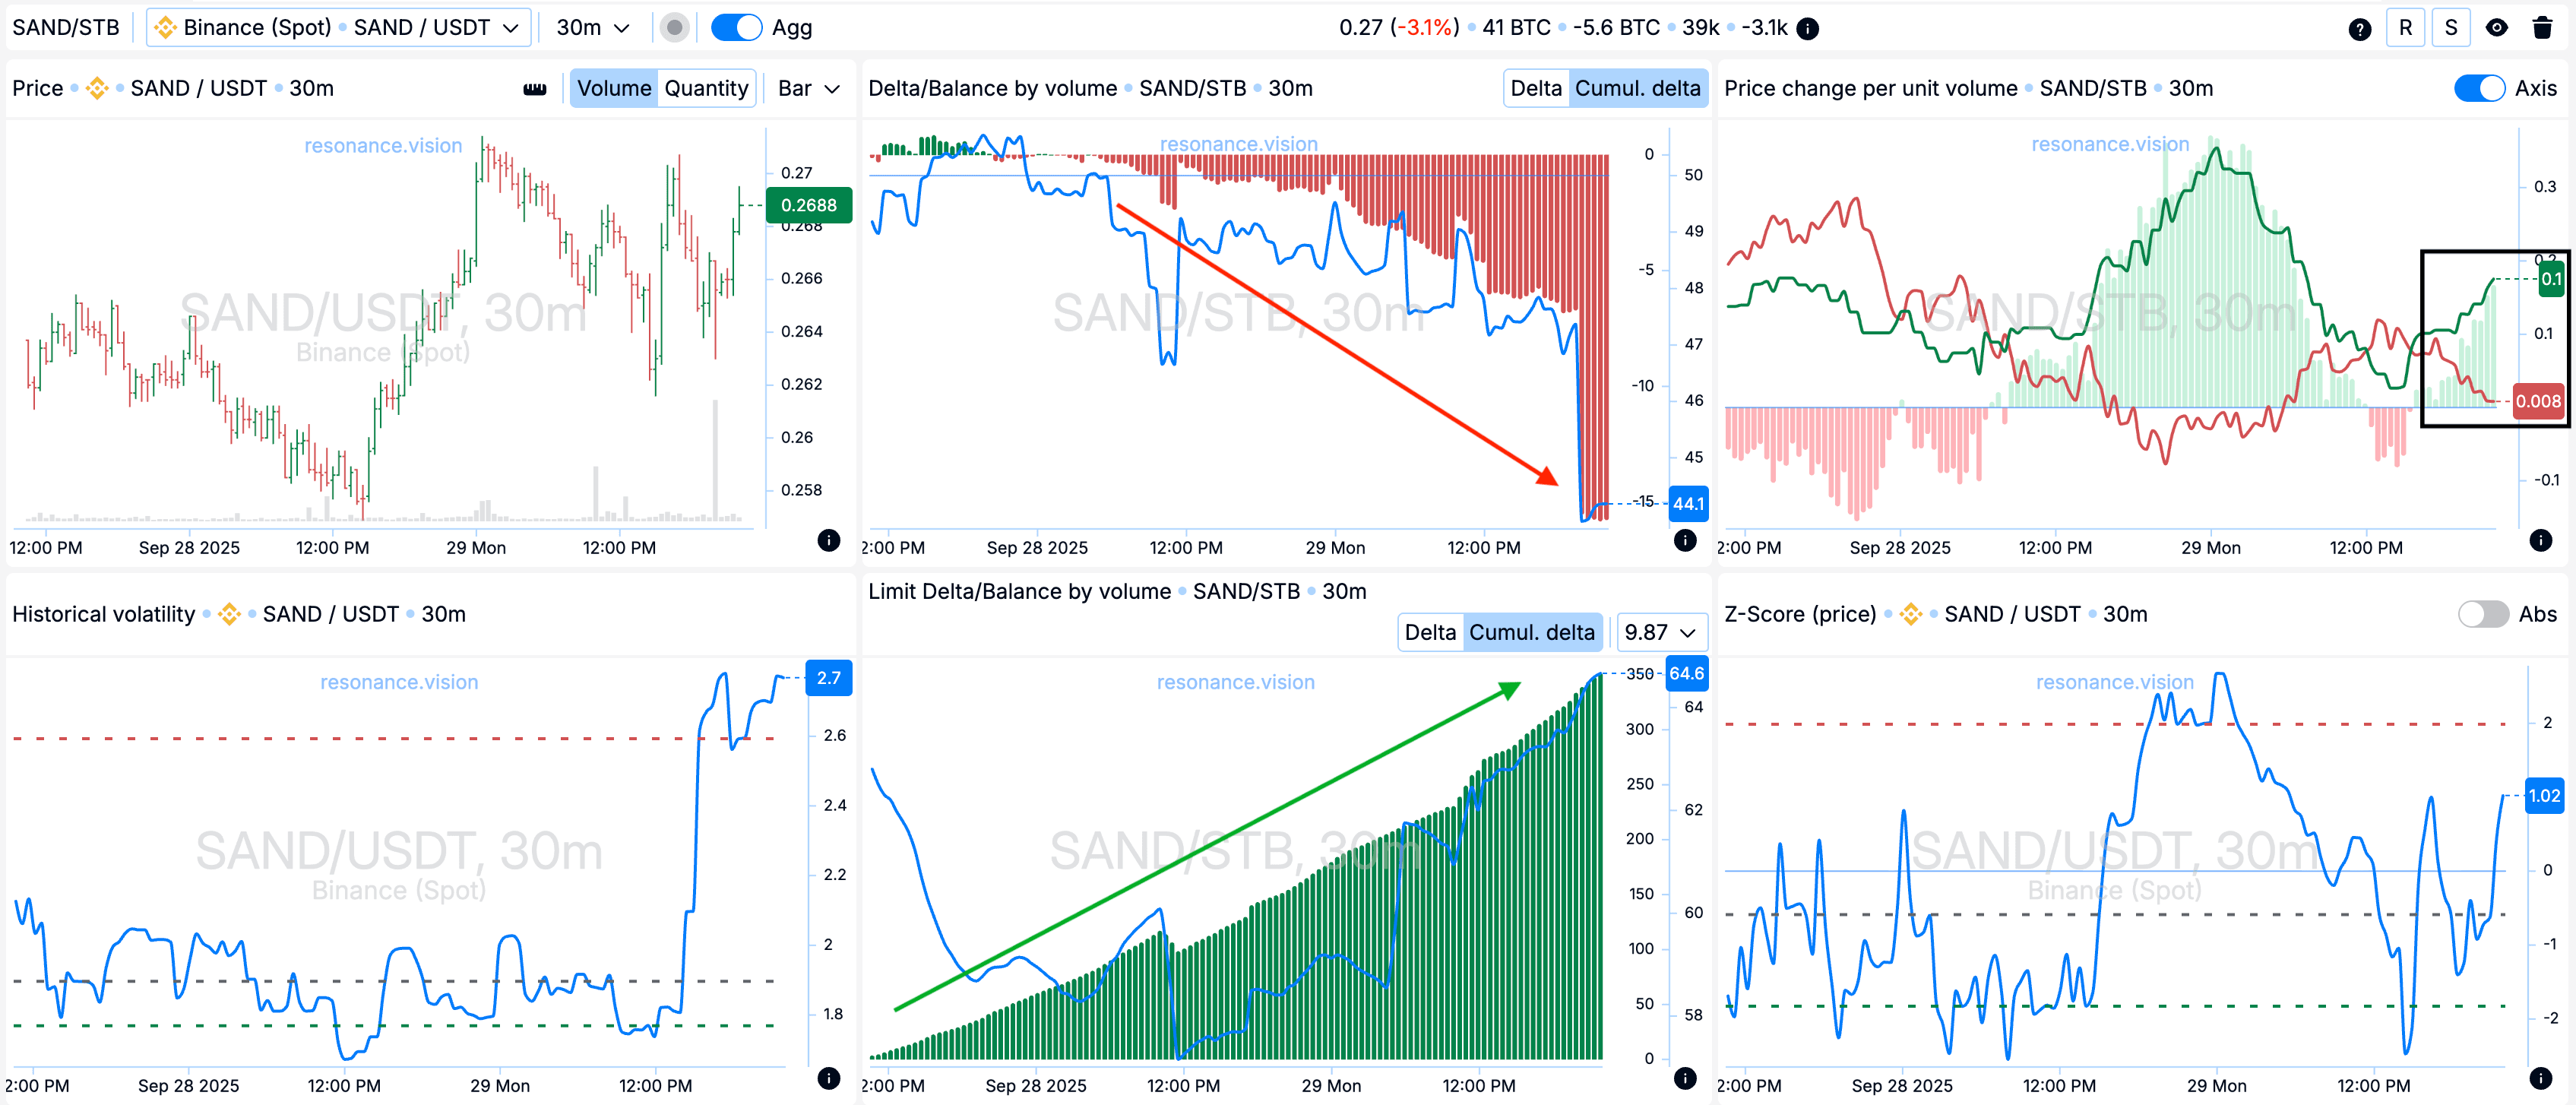
Дельта / Баланс за об’ємом та лімітна дельта: за ринковими ордерами спостерігається помітне переважання продажів - це підтверджується кумулятивною гістограмою дельти (червона стрілка). Однак, незважаючи на тиск із боку продавців, ціна залишається стійкою. При цьому лімітні заявки на покупку в цей період збільшуються, що відбивається на гістограмі дельти лімітної (зелена стрілка).
Зміна ціни на одиницю об’єму: Ефективність впливу ринкових ордерів на ціну почали розходитися на користь покупців (чорний прямокутник).
Причини виходу
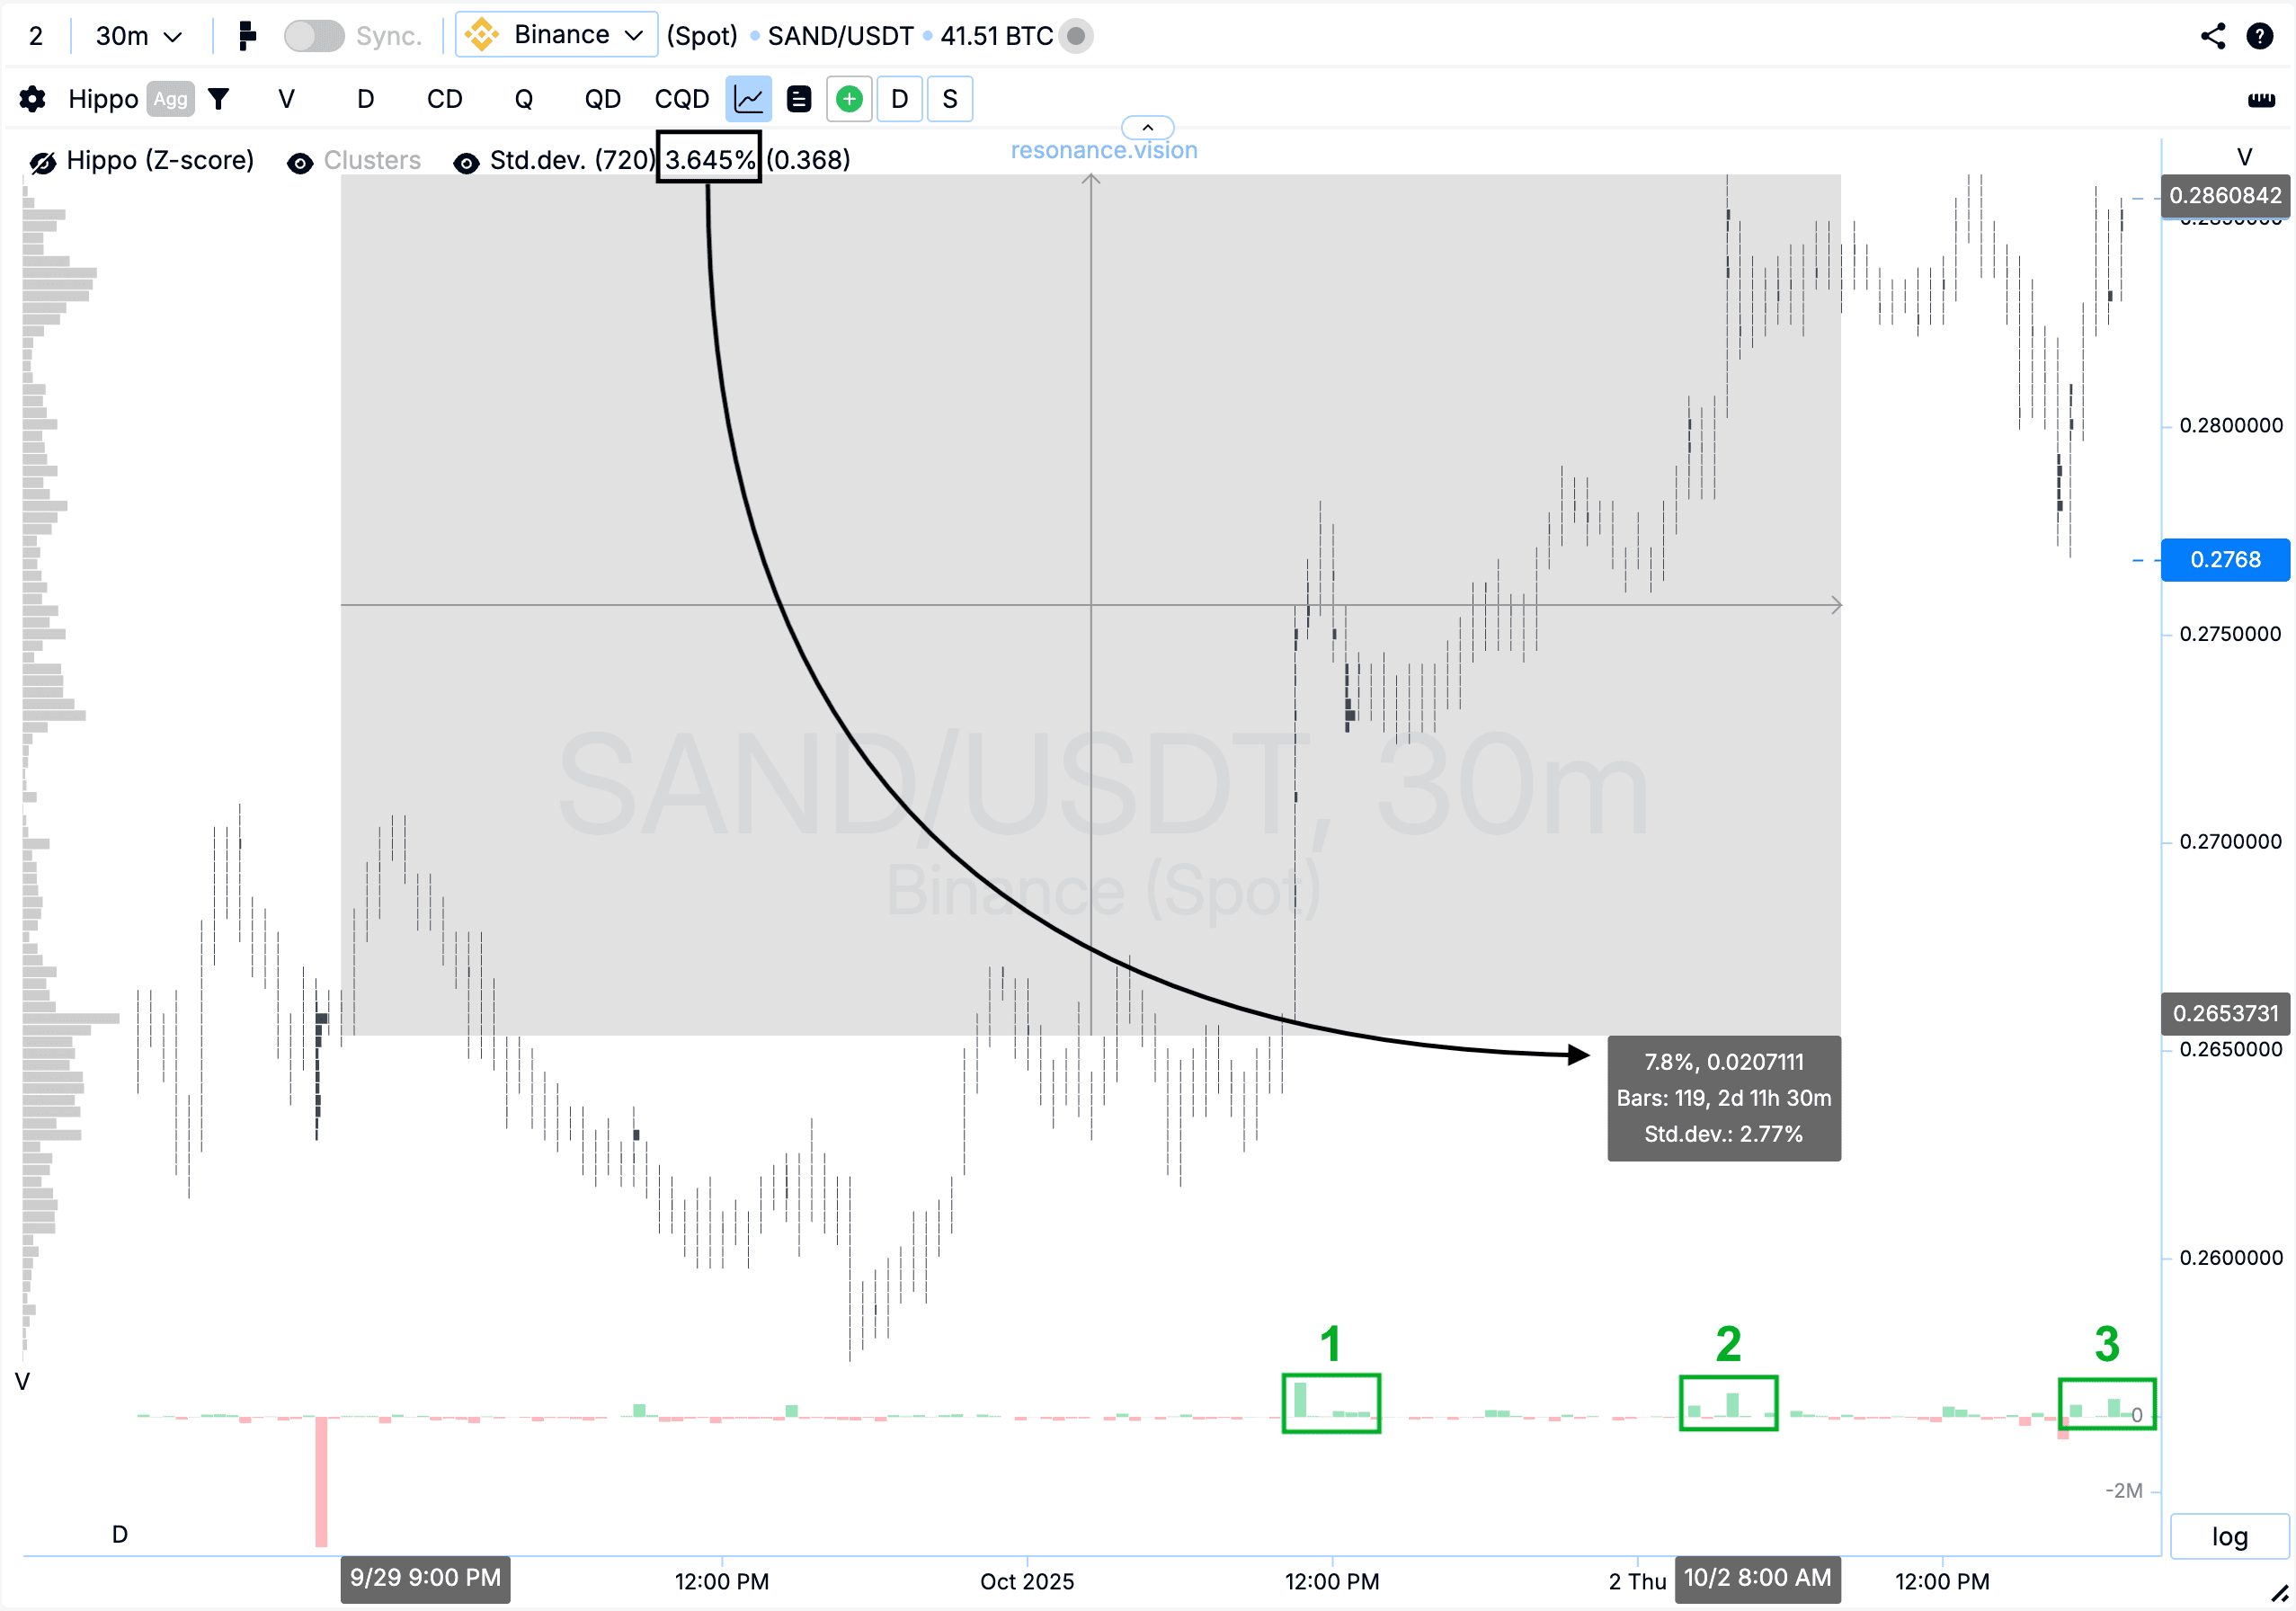
Кластерний графік: від точки входу ціна пройшла ще близько 8%, що відповідає більш ніж двом стандартним рухам. При цьому помітно, що об’єми покупок, аналогічні тим, що спостерігалися раніше (прямокутники №1–2), тепер менш впливають на ціну — локальний максимум не оновлюється (прямокутник №3). Така динаміка може вказувати на ослаблення ініціативи покупців після такого руху та можливе подальше зниження.
Підсумок
Внаслідок цього вдалося зафіксувати прибуток у розмірі +123.49%.
Висновок
Ця угода показує, як поєднання аналізу кластерного графіка, теплової карти та даних Дешборда допомагає знаходити точки входу з високим потенціалом. Незважаючи на домінування ринкових продажів, утримання ціни та зростання лімітних покупок сигналізували про локальний дефіцит та усунення балансу на користь покупців — це стало підставою для відкриття позиції.
На виході зниження ефективності покупок та відсутність оновлення локального максимуму стали вагомим сигналом фіксації результату. Такий підхід дозволив зберегти прибуток та уникнути можливого відкату після руху.
Цей приклад наголошує на важливості спостереження за зміною поведінки учасників: коли ринкові ордери втрачають силу — це привід задуматися про вихід.
Стеж за новими статтями у нашому телеграм каналі.
Не треба вигадувати складних схем та шукати “грааль”. Використовуйте інструменти платформи Resonance.
Реєструйся за посиланням - отримуй бонус і починай заробляти:
OKX | BingX | KuCoin.
Промокод TOPBLOG дає тобі 10% знижки на будь-який тарифний план Resonance.
Рекомендовані статті


