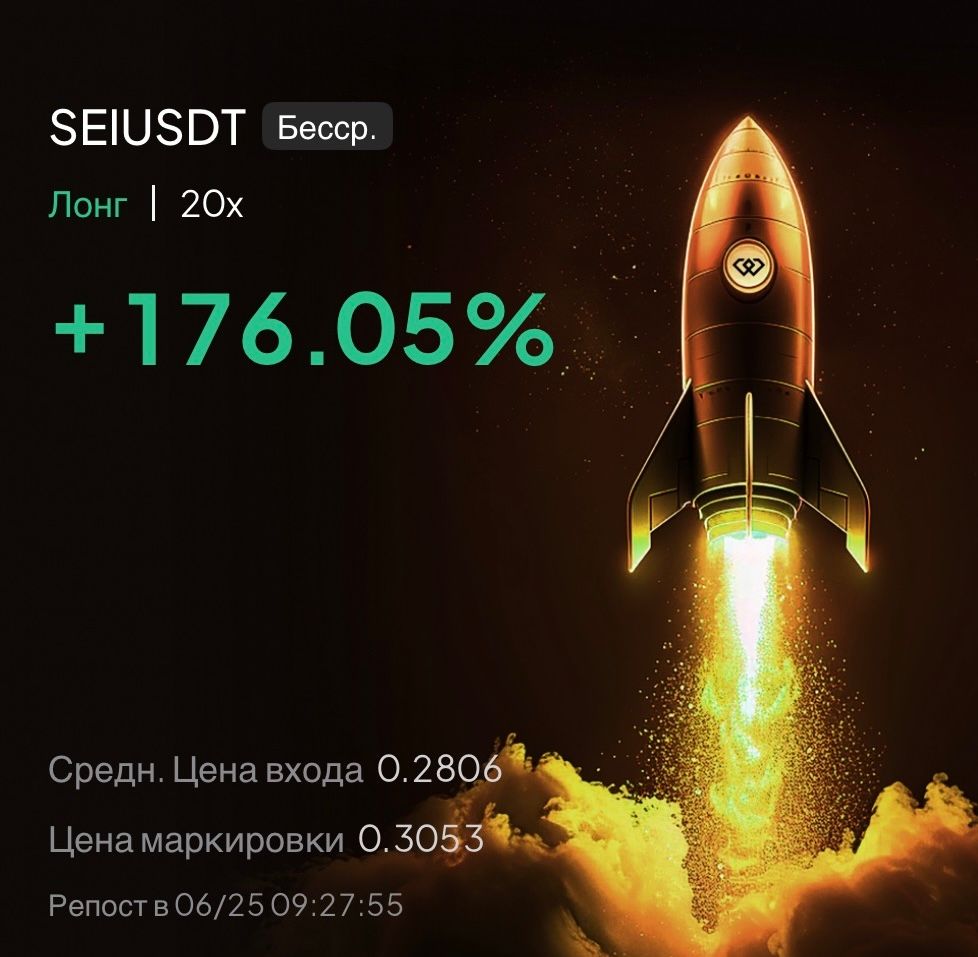
SEI +176.05% (Напрямкова стратегія Резонанс)

У цьому розборі розглянемо угоду з монети SEI/USDT, де ключовим сигналом для входу став локальний дефіцит - момент, коли ціна стійко тримається на тлі ринкових продажів, а лімітні заявки продовжують поглинати об’єм. Докладно покажемо, як поєднання кластерного графіка та агрегованих даних допомагає побудувати виважене торгове рішення, а також вчасно вийти з позиції, не піддаючись емоціям.
Зміст

Монета: SEI/USDT
Ризик: високий
Рівень розуміння: новачок
Причини входу
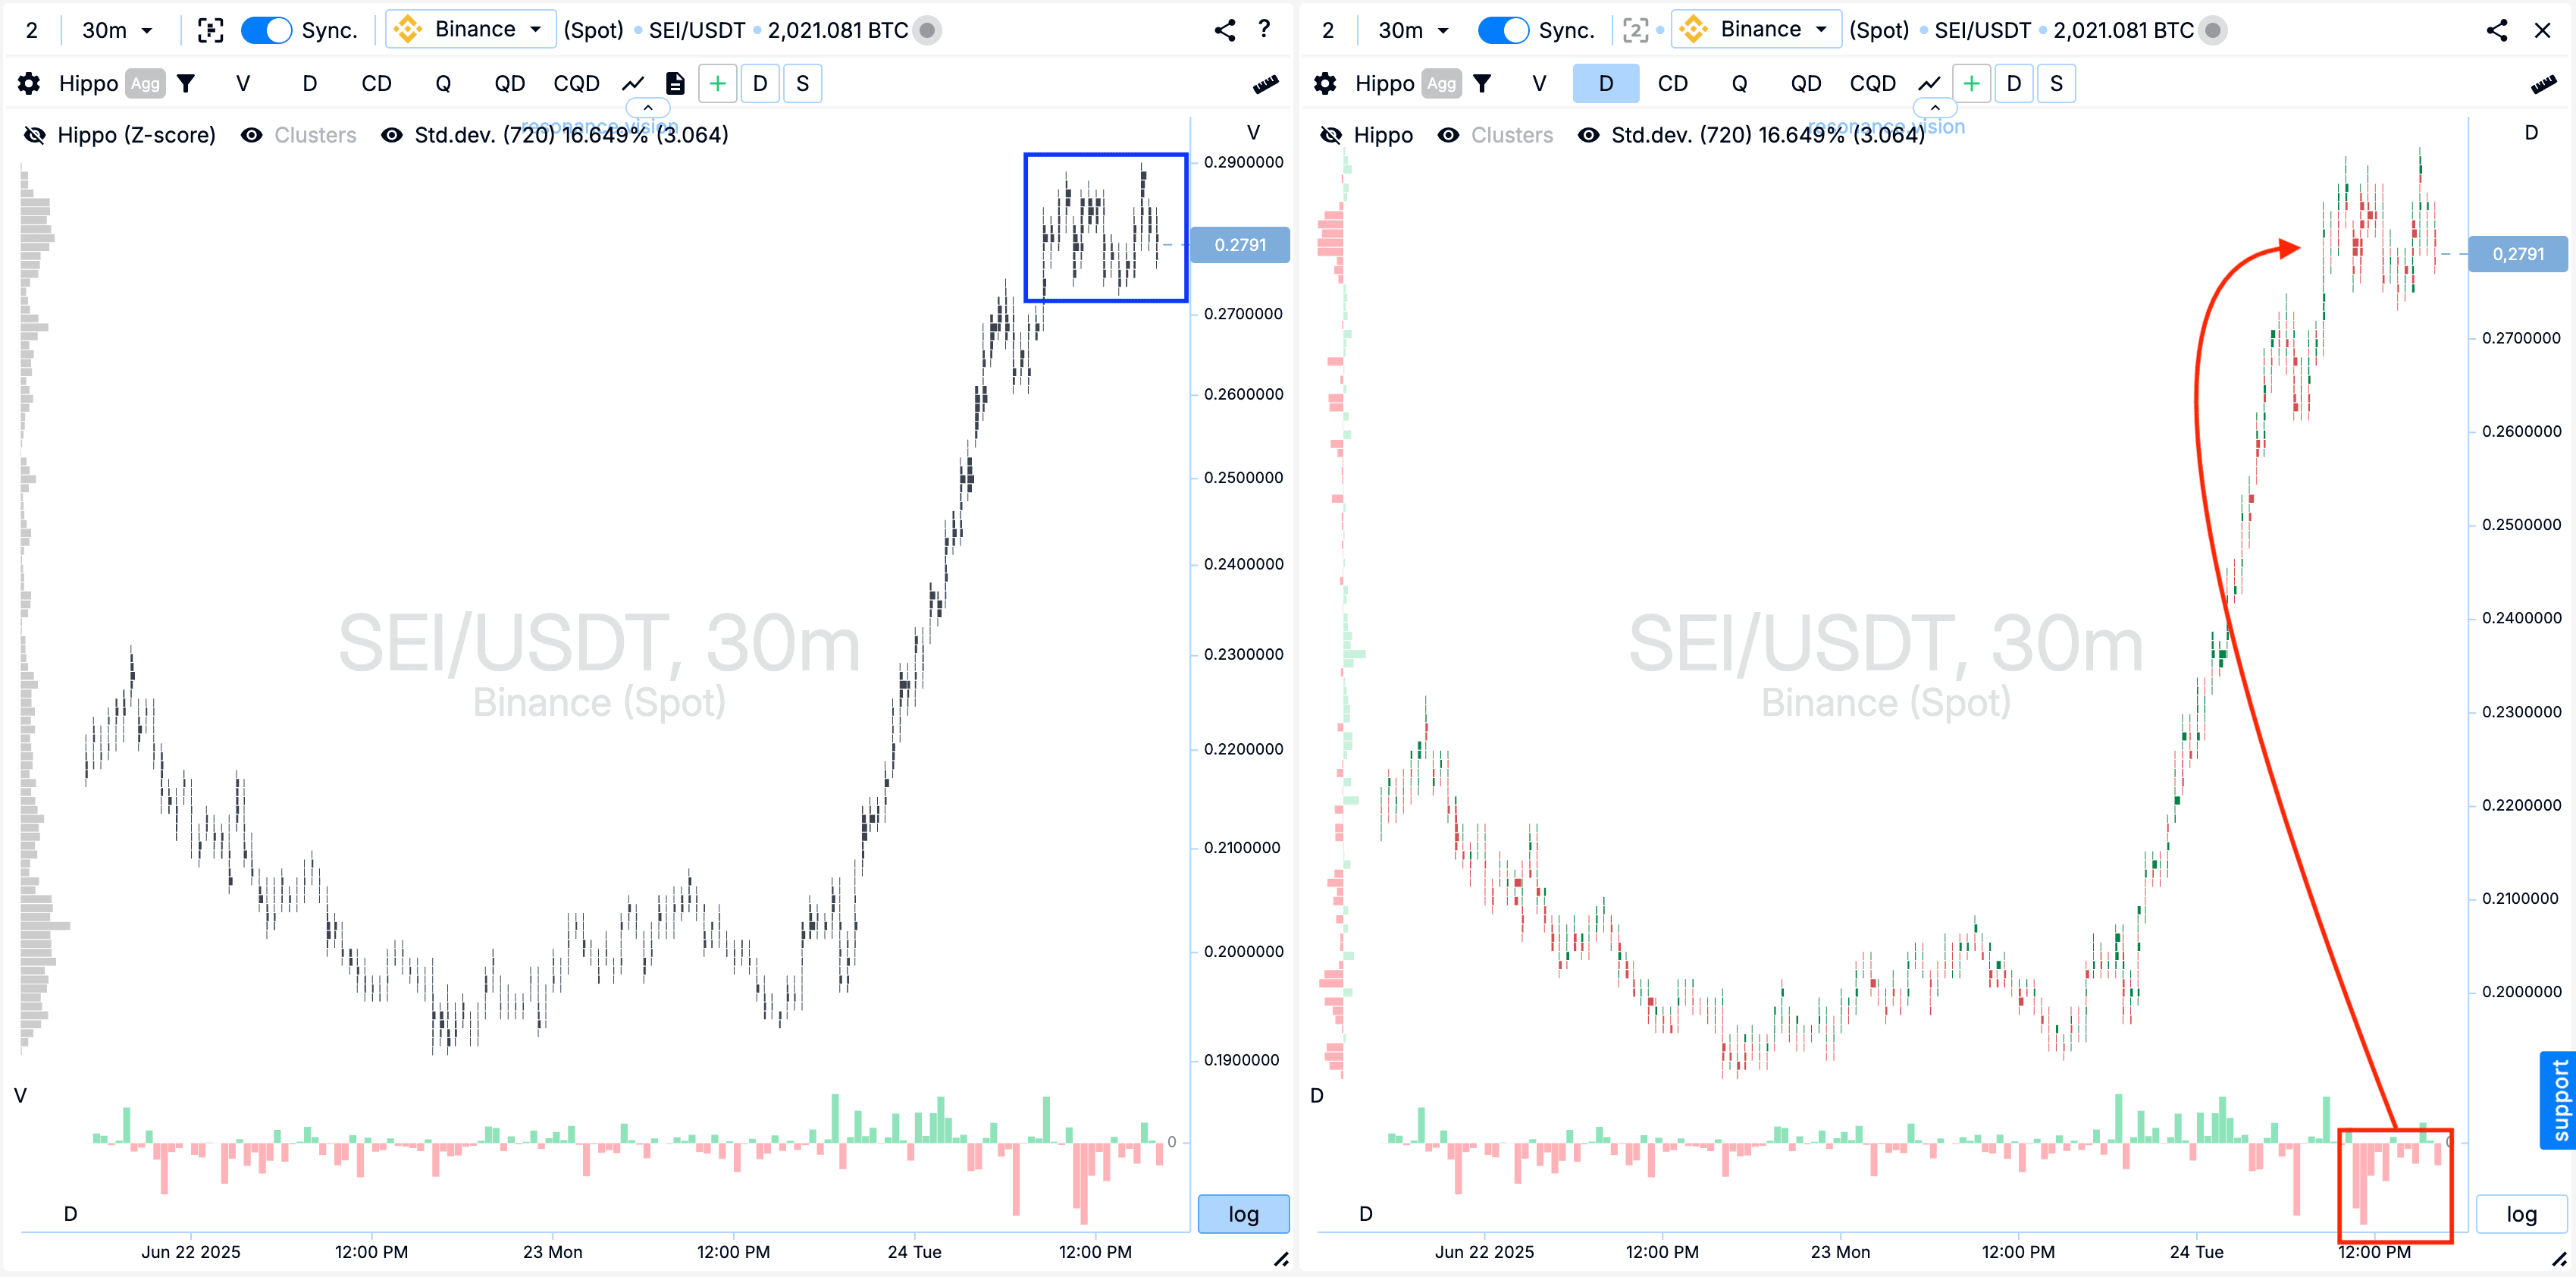
Кластерний графік: Після локального та значного зростання в ціновому діапазоні сформувалися кластери за об’ємом (синій прямокутник). Об’єми супроводжувалися активним продажем (червоний прямокутник зі стрілкою), проте ці продажі не викликали очікуваного зниження — ціна продовжує коливатися в межах цього діапазону. Це може вказувати на те, що ініціатива залишається на боці покупців, які тримають контроль над рухом.
У Дешборді
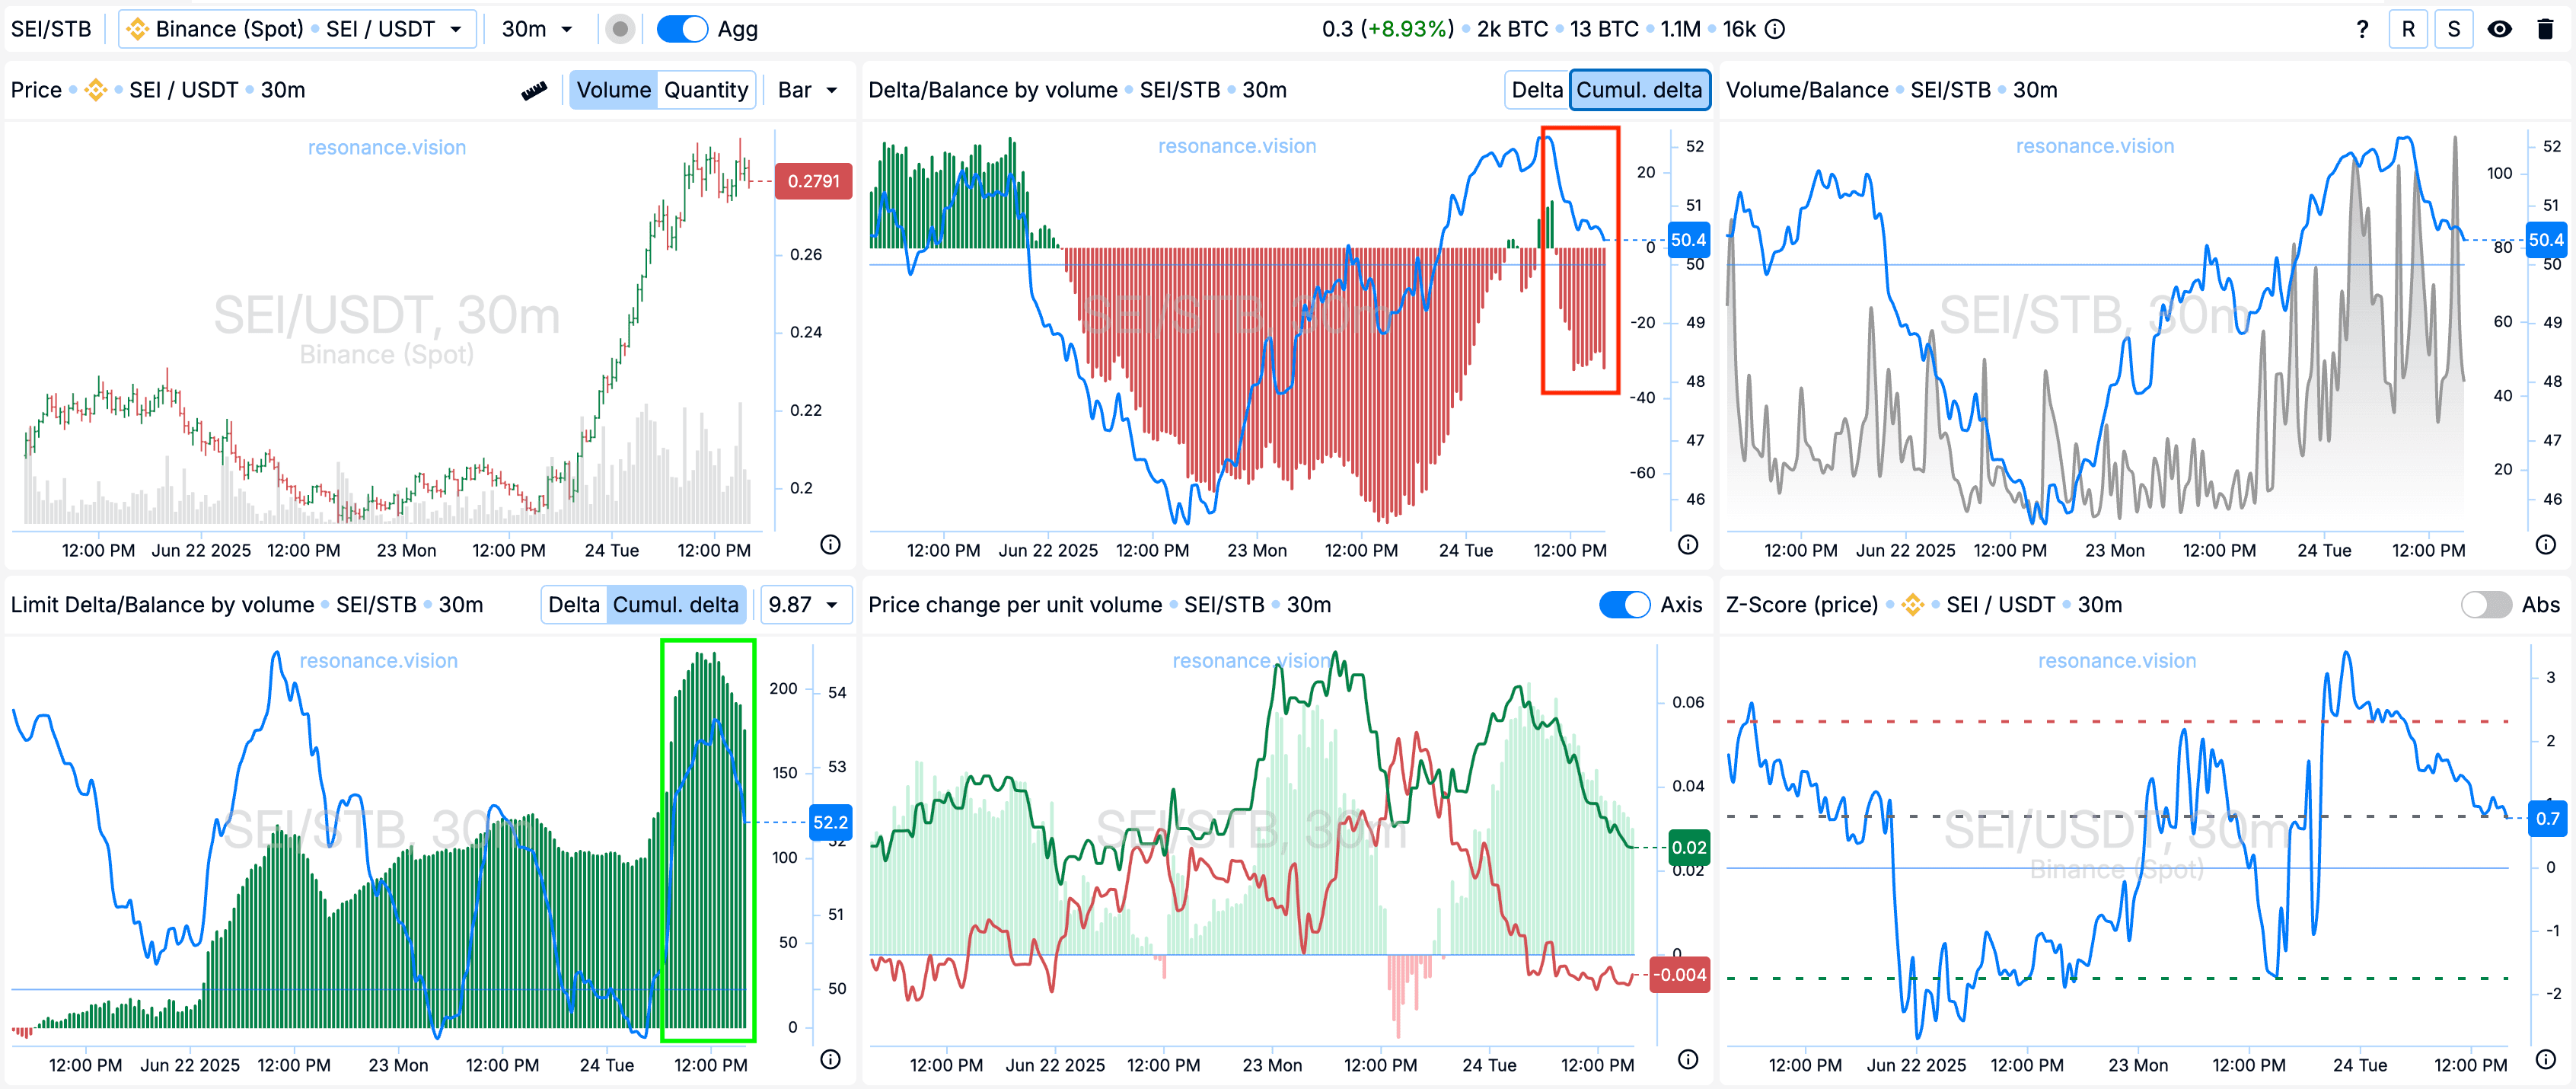
Дельта/Баланс за об’ємом та лімітна дельта: Згідно з агрегованими кумулятивними даними, переважають ринкові продажі (червоний прямокутник). Однак за лімітними заявками спостерігається активна підстановка ордерів на покупку - це видно з позитивної динаміки на гістограмі дельта кумулятивної (зелений прямокутник).
Це вказує на наявність локальної лімітної підтримки, здатної продовжити поглинати ринковий об’єм продажів, що входить. Це додатково підтверджує гіпотезу про локальний дефіцит, що зберігається.
Причини виходу
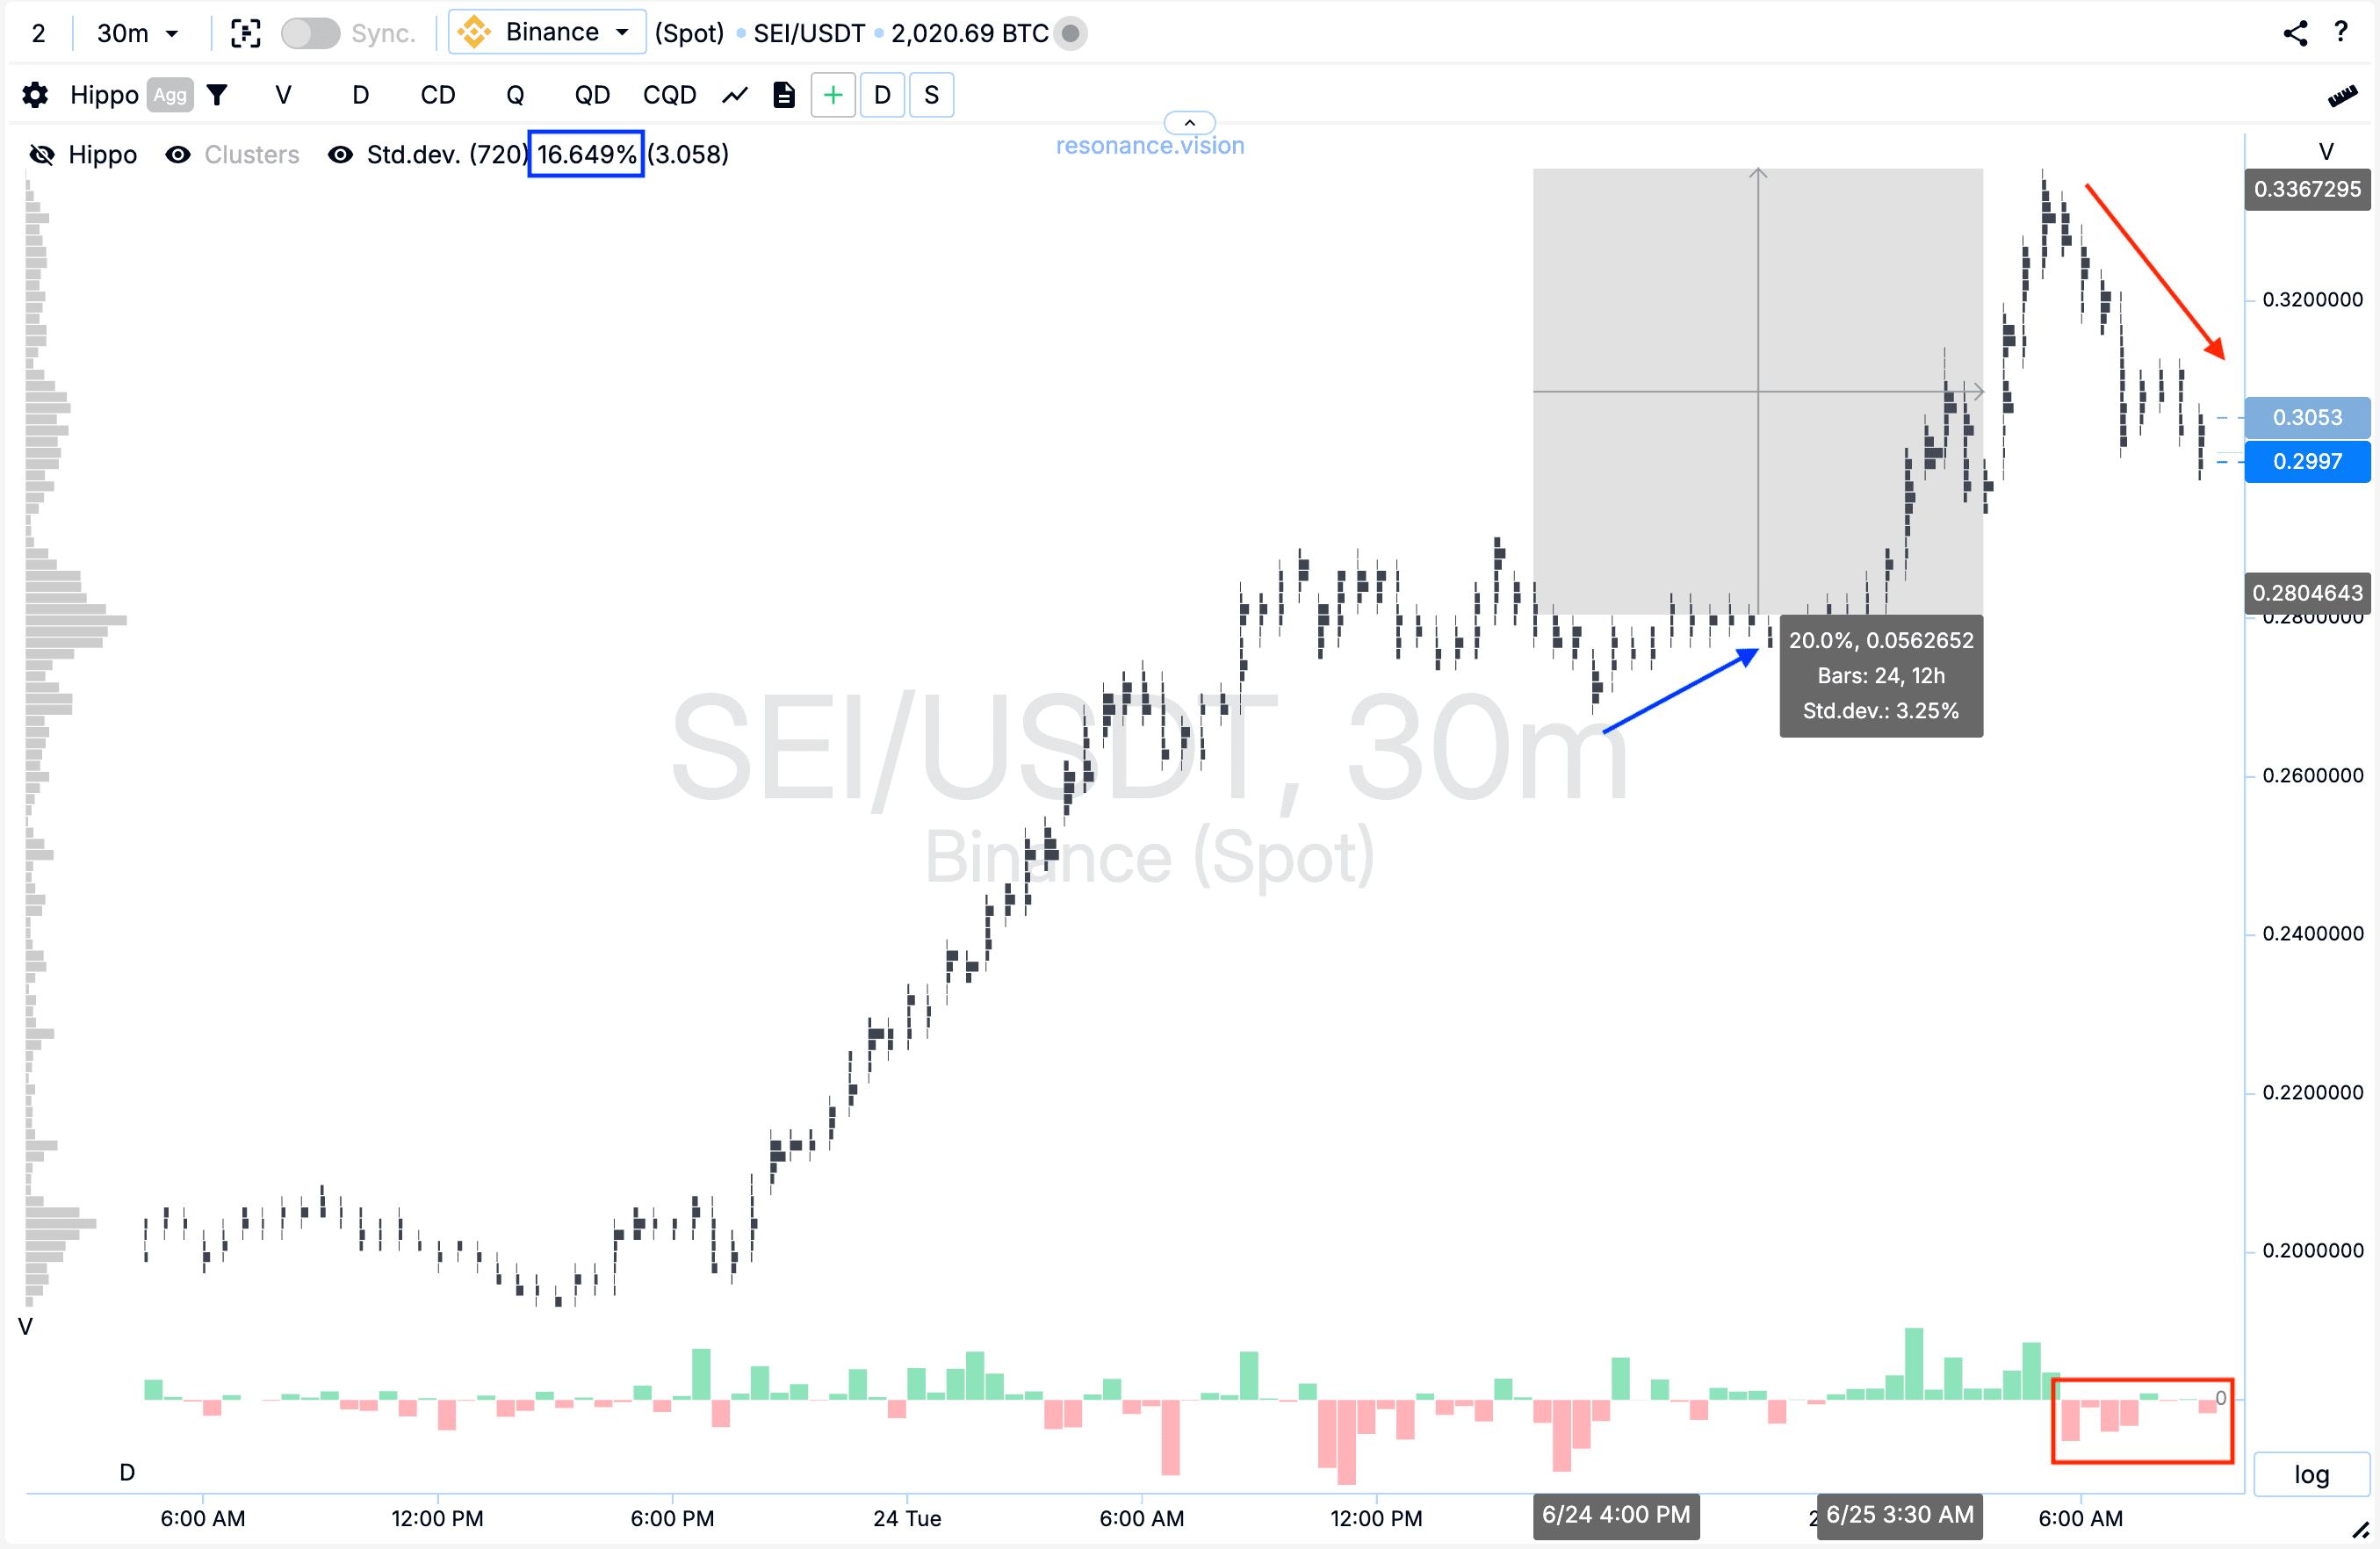
Кластерний графік: Від точки входу ціна пройшла вгору ще 20%, що перевищує один стандартний рух (синій прямокутник та стрілка). Надалі почали переважати ринкові продажі, об’єми яких поступово зменшувалися, проте ціна продовжувала знижуватися (червоний прямокутник та стрілка).
Це стало сигналом до фіксації всієї позиції - розумне рішення, що дозволяє уникнути емоційної реакції і не піддатися FOMO у разі продовження зниження.
Підсумок
Внаслідок цього вдалося зафіксувати прибуток у розмірі +176.05%.
Висновок
У цій угоді ключовим чинником послужила не реакція ціну, та її відсутність убік продавців. Незважаючи на активний ринковий продаж, ціна стійко трималася, а лімітна підтримка продовжувала поглинати маркет ордера. Це дало привід сформувати гіпотезу про наявність локального дефіциту та відкрило вікно для входу.
Проте ринок який завжди рухається лінійно. Після зростання більш ніж на 20% стали з’являтися ознаки уповільнення: продаж посилився, а ціна почала знижуватися. Саме в такий момент важливо діяти холоднокровно — своєчасна фіксація прибутку дозволяє зберегти результат та уникнути емоційних помилок. Угода наочно показує, наскільки важливо враховувати взаємодію ринкових обсягів та лімітних заявок, щоб приймати виважені та обґрунтовані торговельні рішення.
Стеж за новими статтями у нашому телеграм каналі.
Не треба вигадувати складних схем та шукати “грааль”. Використовуйте інструменти платформи Resonance.
Реєструйся за посиланням - отримуй бонус і починай заробляти:
OKX | BingX | KuCoin.
Промокод TOPBLOG дає тобі 10% знижки на будь-який тарифний план Resonance.
Рекомендовані статті


