SKL +43,2% (Направленная стратегия Resonance)

Разбор сделки SKL/USDT с акцентом на дисбаланс между покупателями и продавцами, кластерный анализ и дельту. Показано, как лимитные заявки и поведение цены помогли определить точки входа и выхода, а также управлять риском после сильного движения. Практический пример комплексного подхода к торговле на рынке с высокой волатильностью.
Содержание

Монета: SKL/USDT
Риск: средний
Уровень понимания: новичок
Причины входа
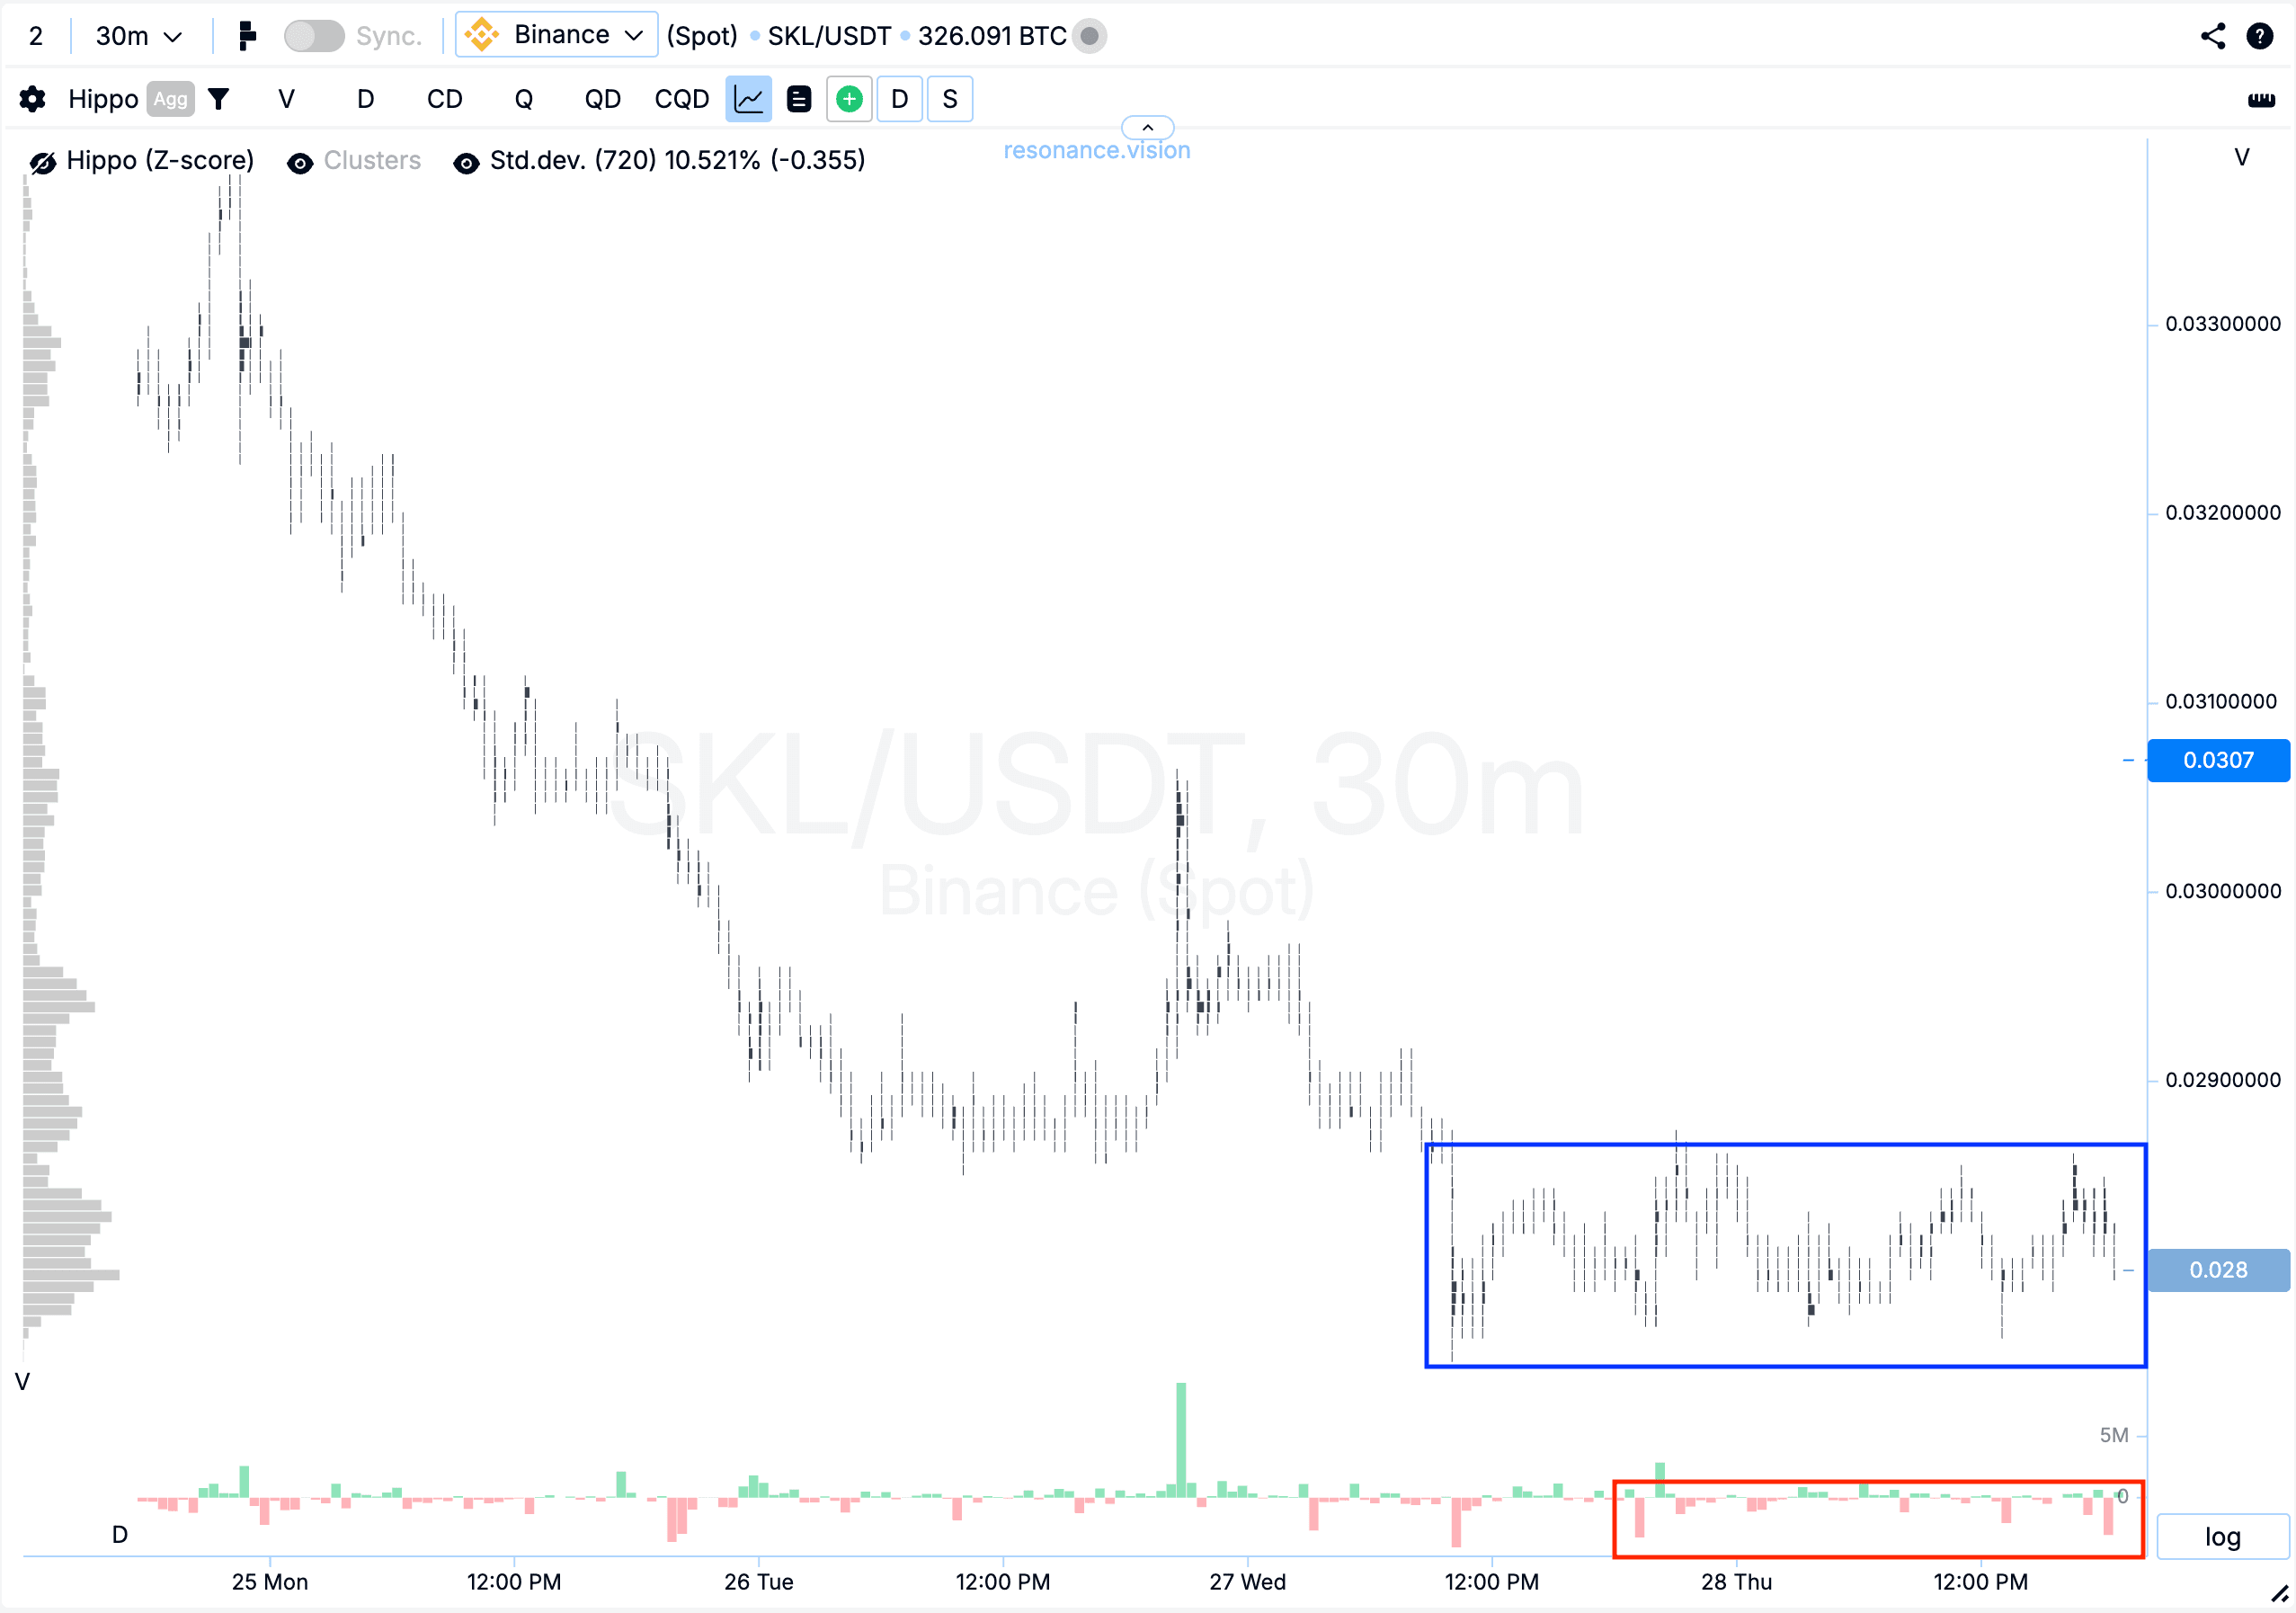
Кластерный график: на снижении начали формироваться кластера по объёму (синий прямоугольник), где видно что преобладают продажи — это подтверждается дельтой (красный прямоугольник). Однако, несмотря на давление со стороны продавцов, цена уже не снижается и не обновляет локальный минимум, что может указывать на признаки локального дефицита и ослабление инициативы продавцов.
В Дешборде
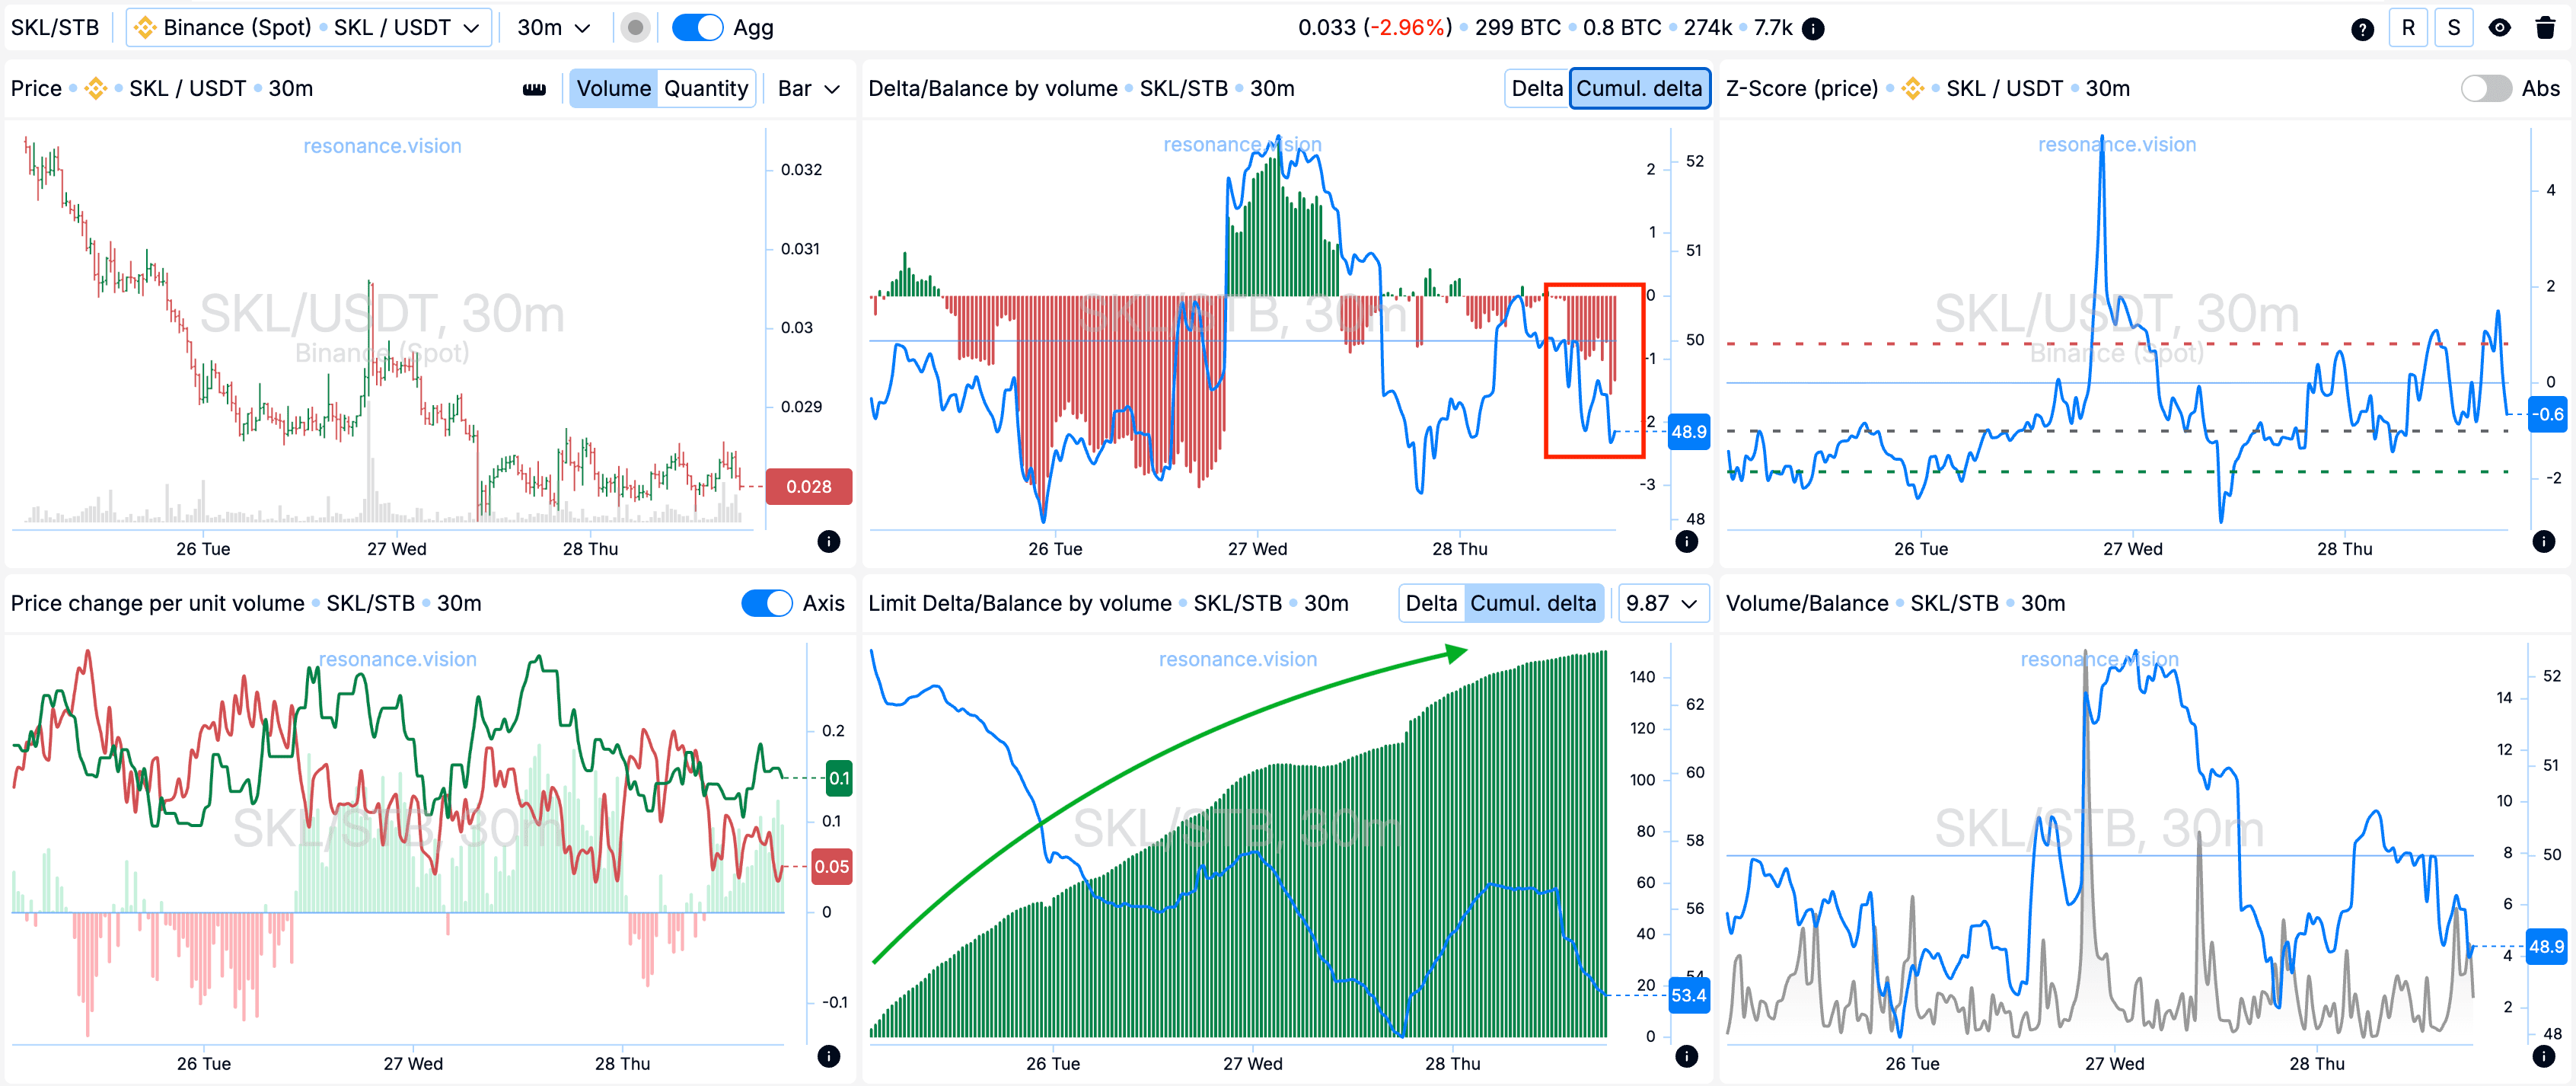
Дельта/Баланс по объёму и лимитная дельта: по агрегированным данным фиксируется явное преобладание рыночных продаж — это видно по кумулятивной гистограмме дельты (красный прямоугольник). Однако, несмотря на такое давление, цена перестала снижаться.
При этом по лимитным заявкам наблюдается рост кумулятивной дельты (зелёная стрелка), что указывает на доминирование лимитных заявок на покупку. Такая динамика потенциально говорит о готовности участников рынка активно поглощать объёмы продаж в текущем диапазоне и удерживать цену от дальнейшего падения.
Причины выхода
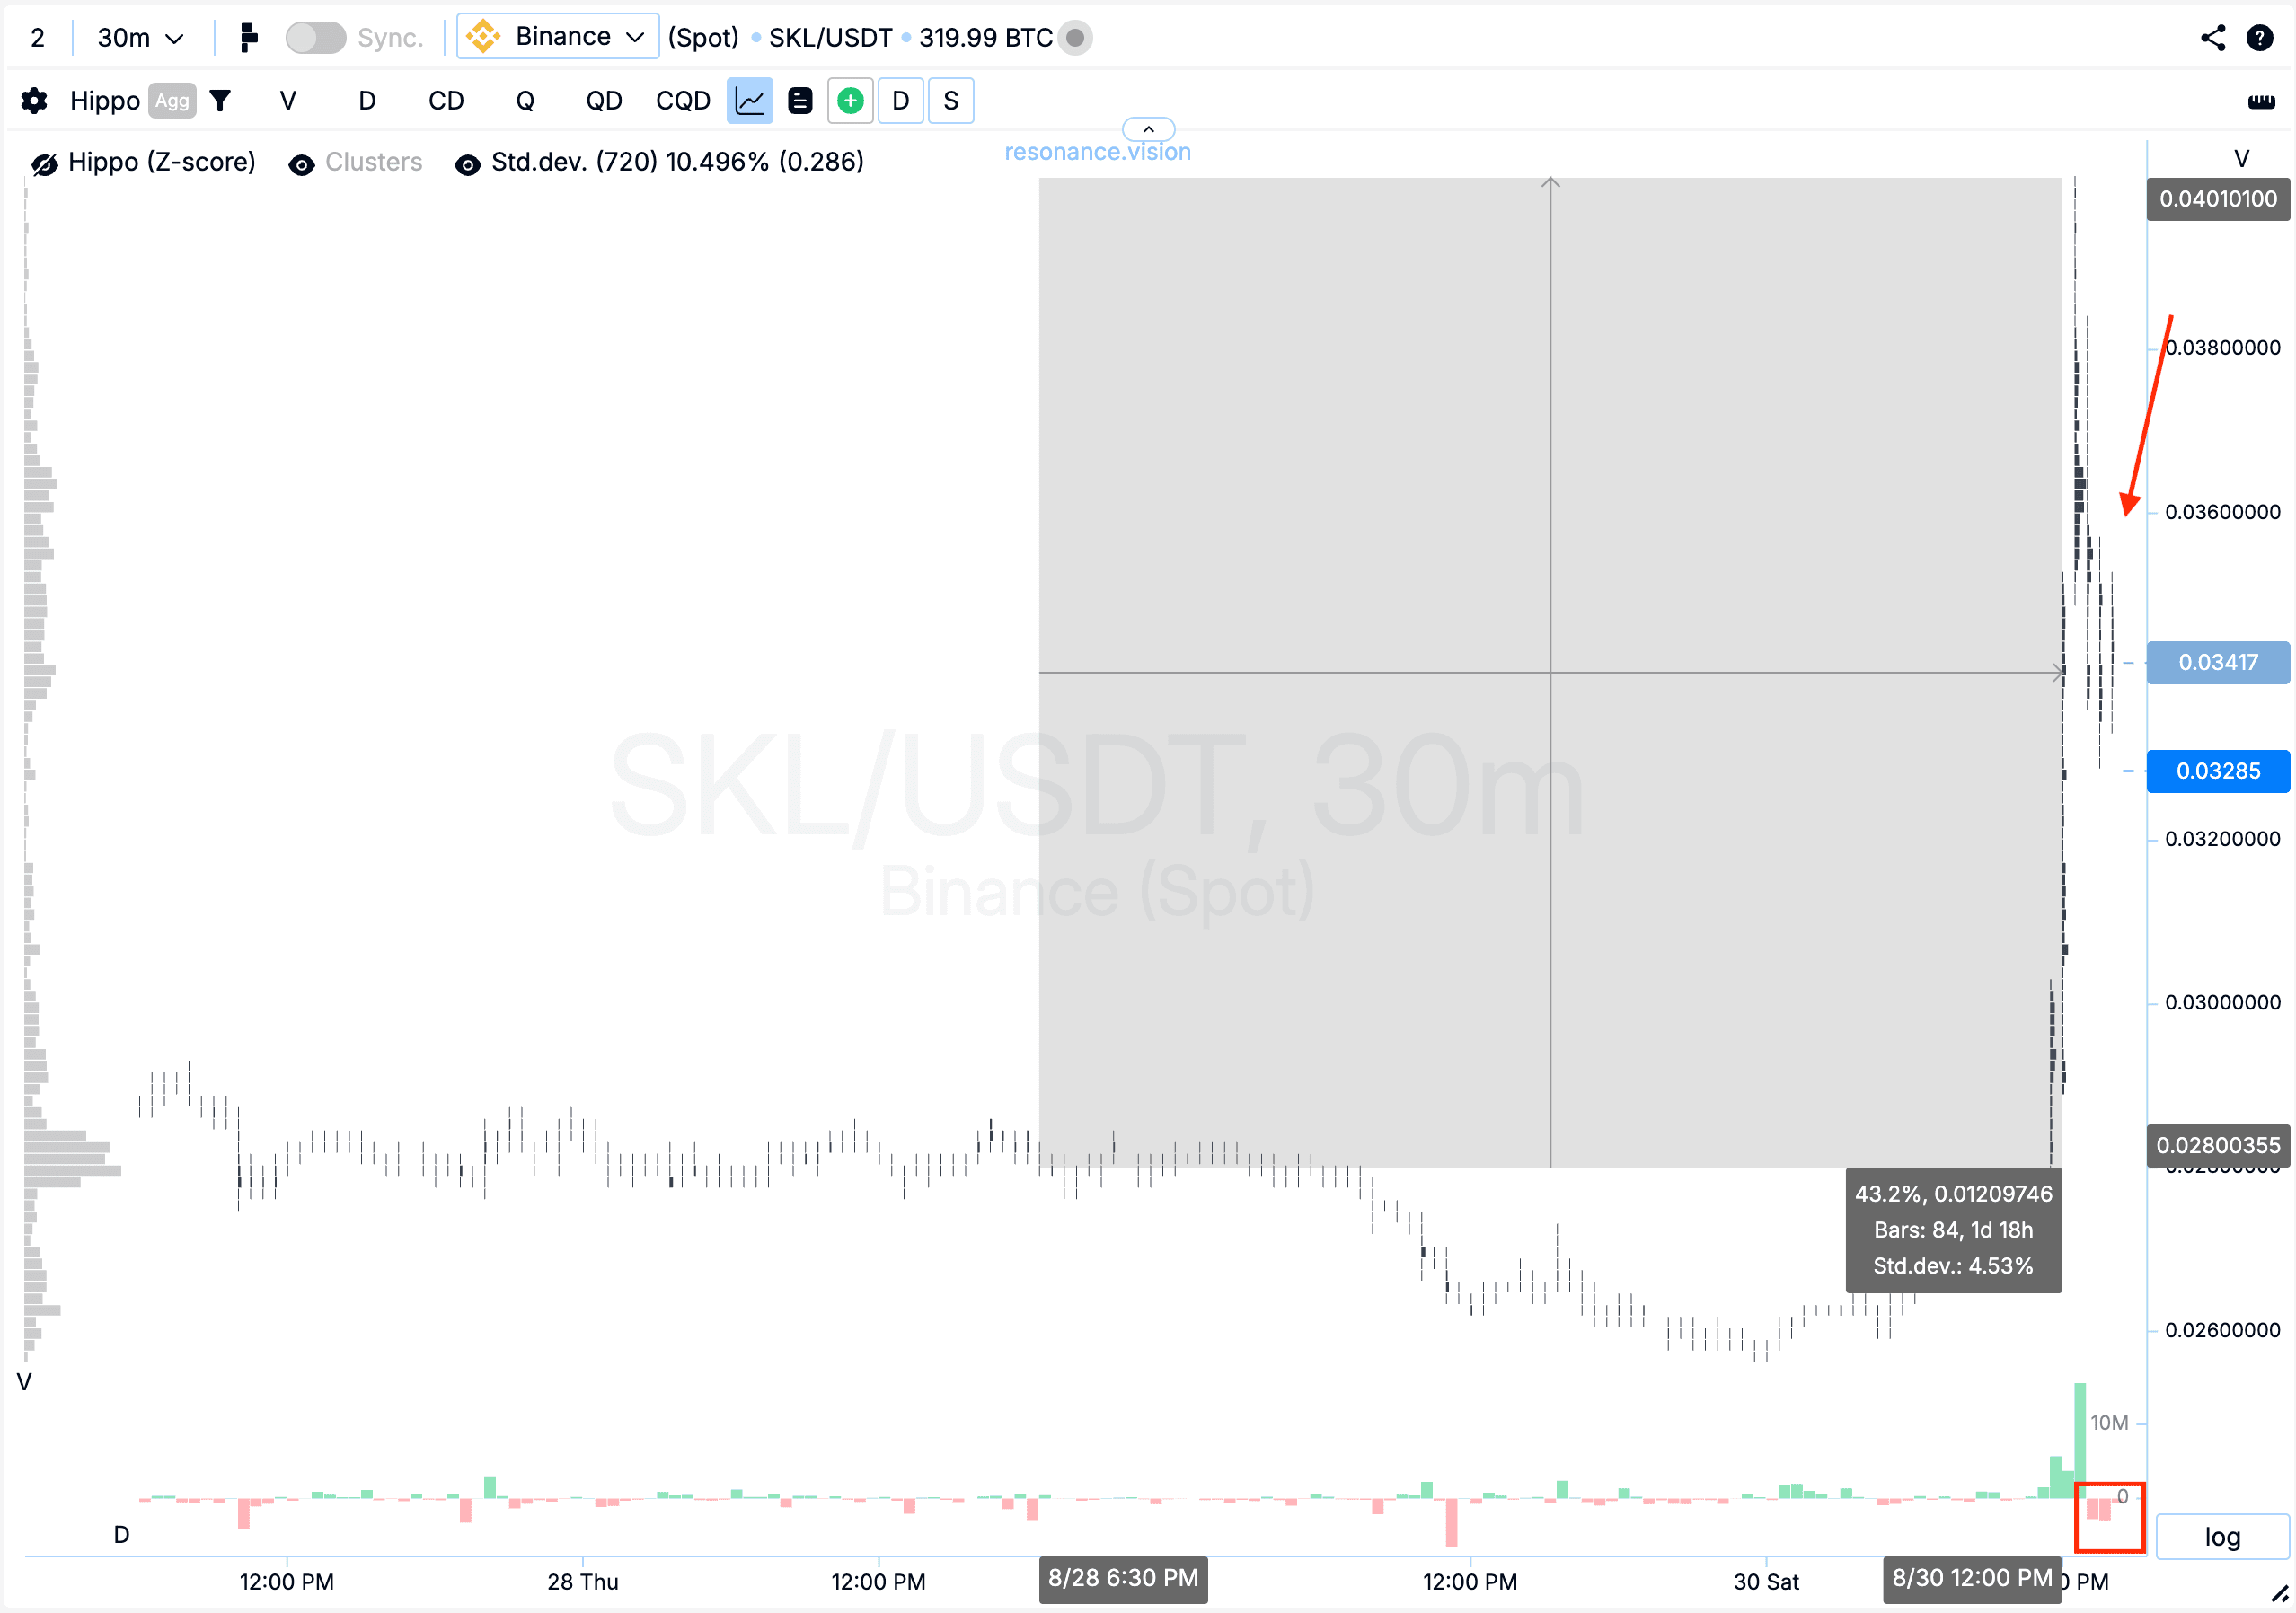
Кластерный график: с момента точки входа цена выросла более чем на 40%, что является значительным движением. Далее наблюдался откат и постепенное снижение, сопровождаемое объёмными продажами (красный прямоугольник и стрелка).
Дальнейшее удержание позиции несёт повышенный риск, поскольку после такого импульсного движения возникает неопределённость в действиях участников рынка.
Заключение
Эта сделка демонстрирует, как наблюдение за дисбалансом между покупателями и продавцами позволяет строить обоснованные торговые гипотезы. Несмотря на преобладание рыночных продаж, цена переставала снижаться и не обновляла локальный минимум, что указывало на признаки локального дефицита и ослабление инициативы продавцов.
Пример подчёркивает ценность комплексного подхода: совмещение кластерного анализа, дельты и лимитных заявок позволяет находить качественные точки входа и выхода, и реализовывать прибыльные торговые идеи.
Следи за новыми статьями в нашем телеграм канале.
Не нужно выдумывать сложных схем и искать “грааль”. Используй инструменты платформы Resonance.
Регистрируйся по ссылке — получай бонус и начинай зарабатывать:
OKX | BingX | KuCoin.
Промокод TOPBLOG дает тебе 10% скидки на любой тарифный план Resonance.
Рекомендуемые статьи


