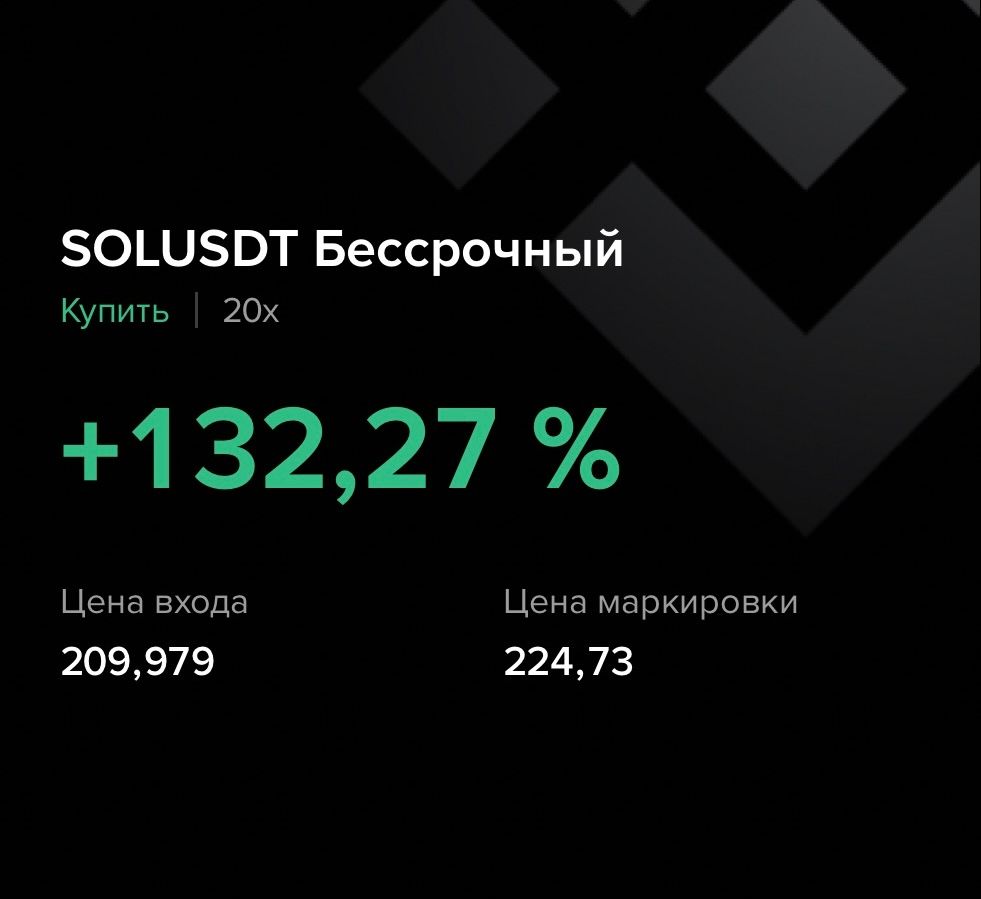
SOL +132,27% (Направленная стратегия Резонанс)

В этом разборе показываю, как использовал тепловую карту (Z-Score) для выявления аномальных лимитных плотностей и управление позицией с доборами. Разберём логику входа, реакцию цены на кластеры и то, как грамотно усиливать идею без лишней жадности.
Содержание

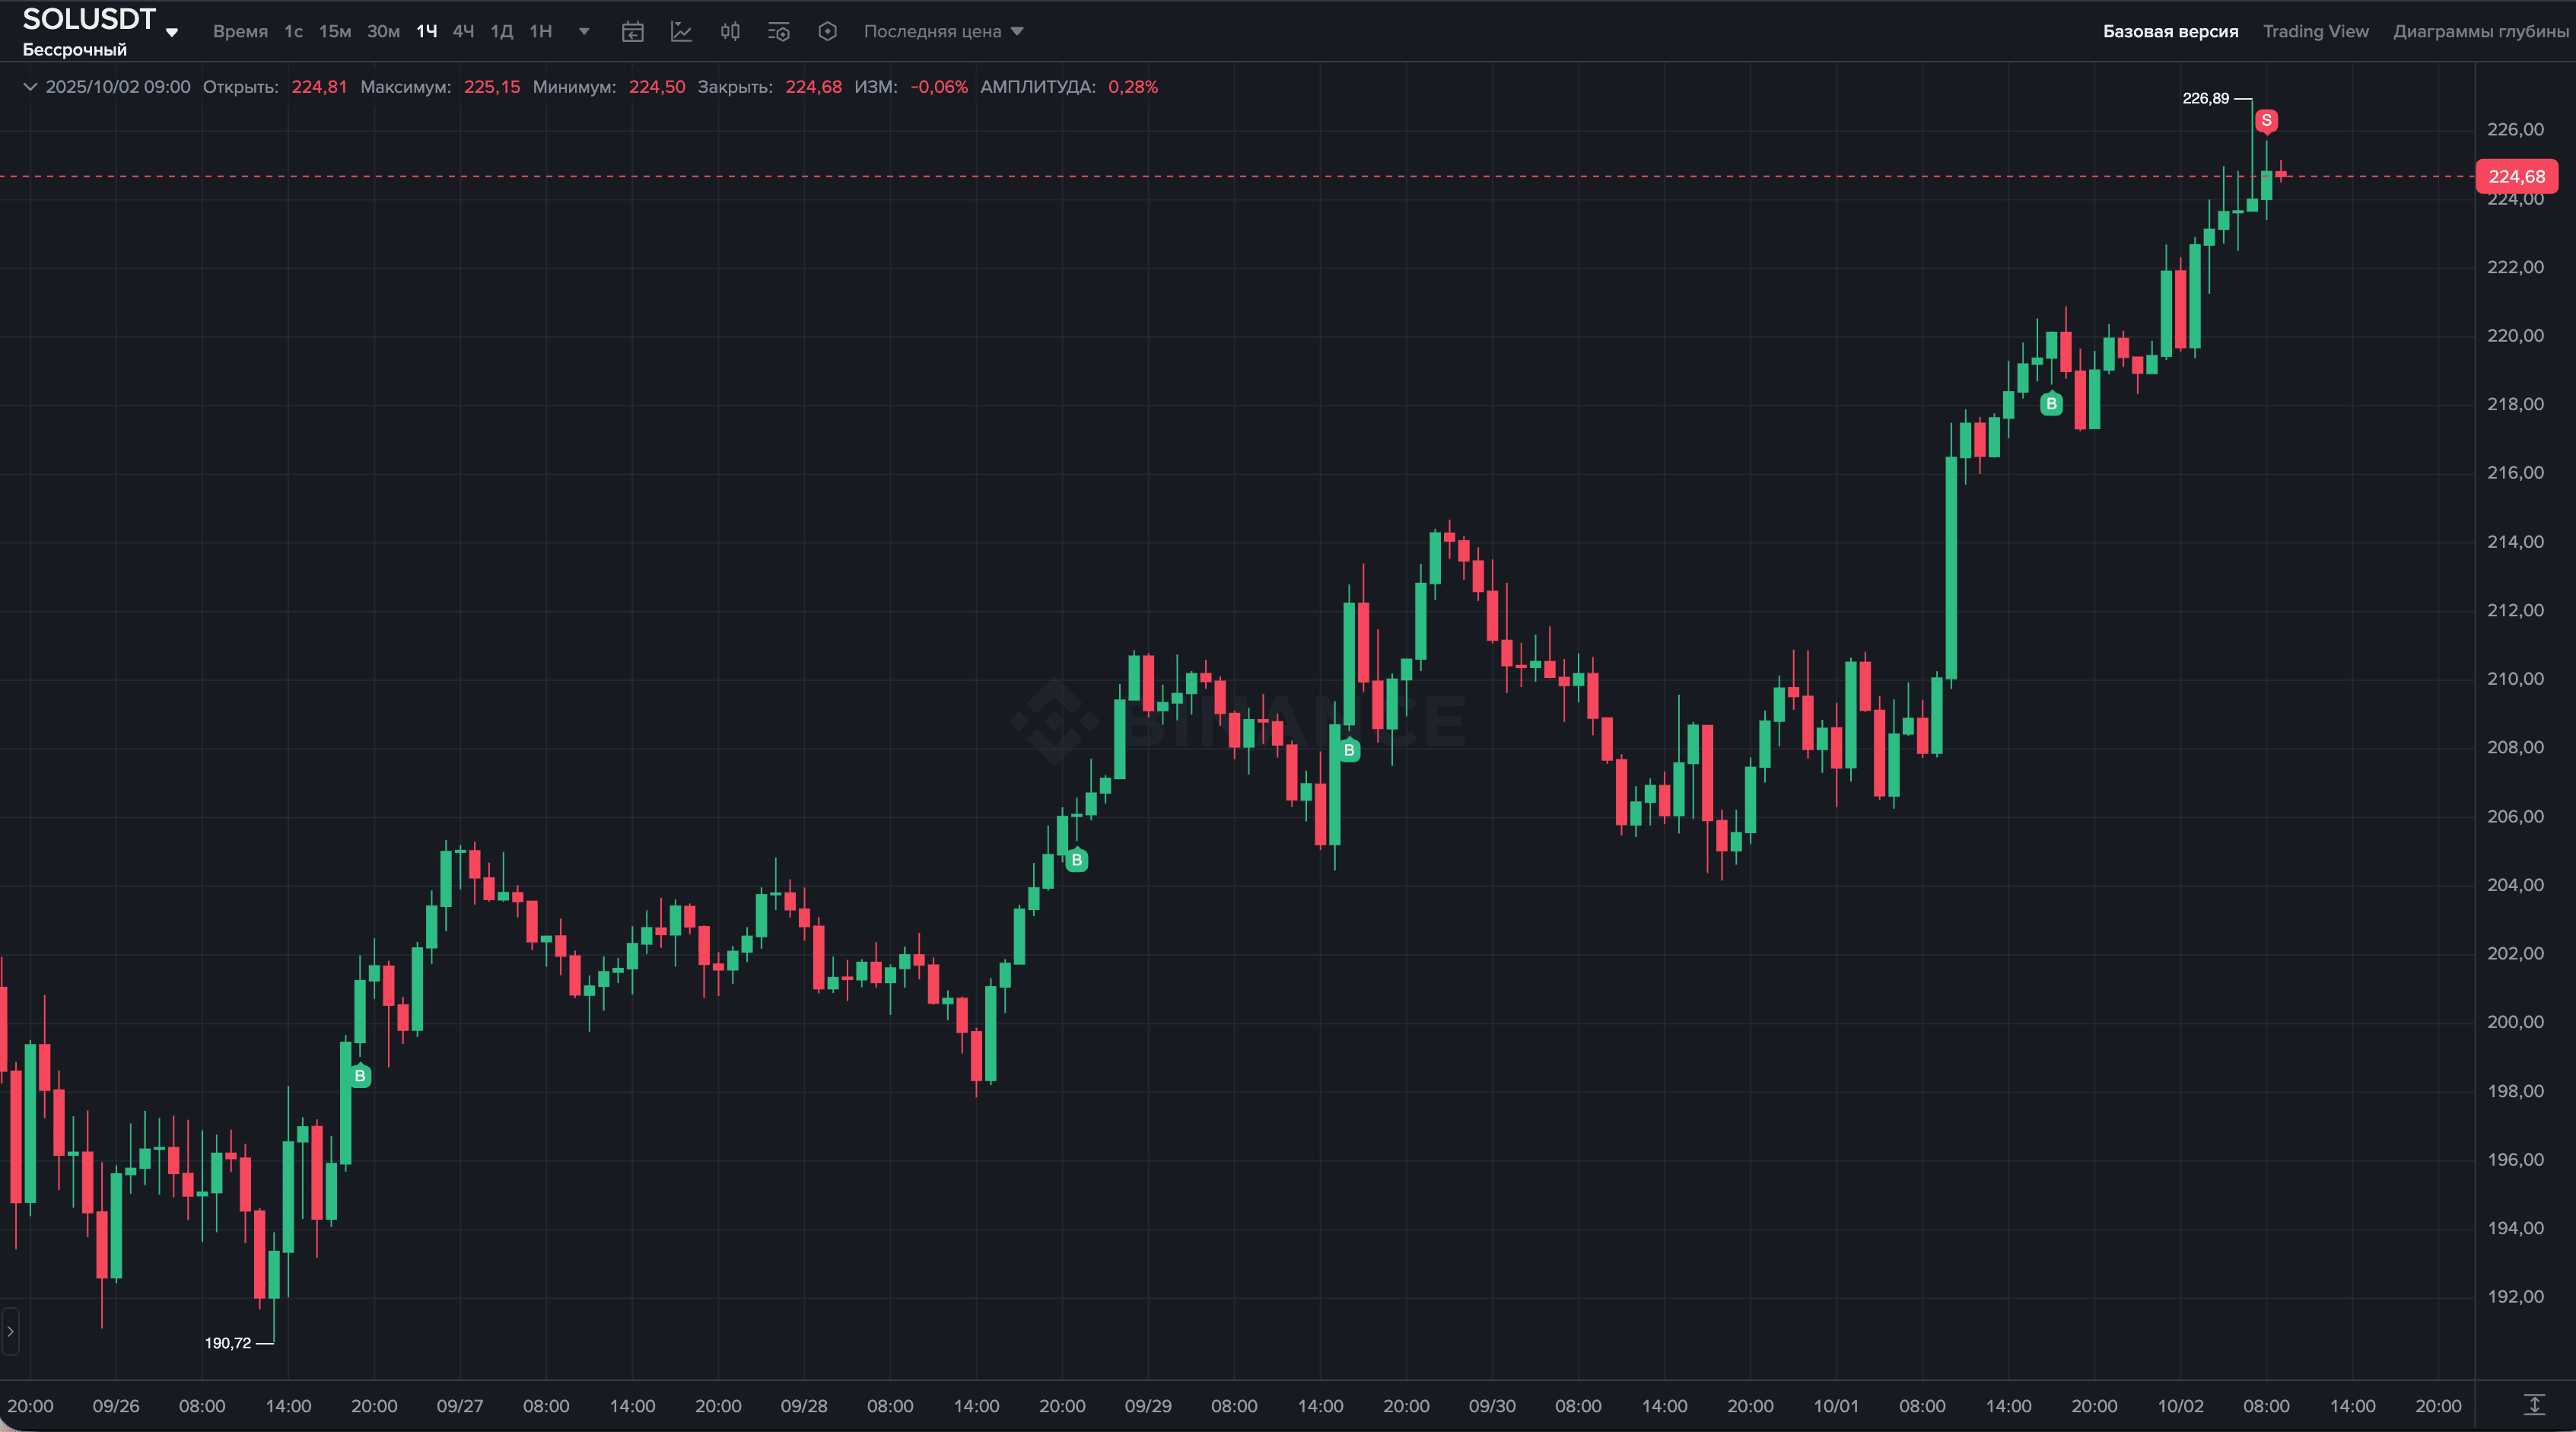
Монета: SOL/USDT
Риск: низкий
Уровень понимания: новичок
Причины входа
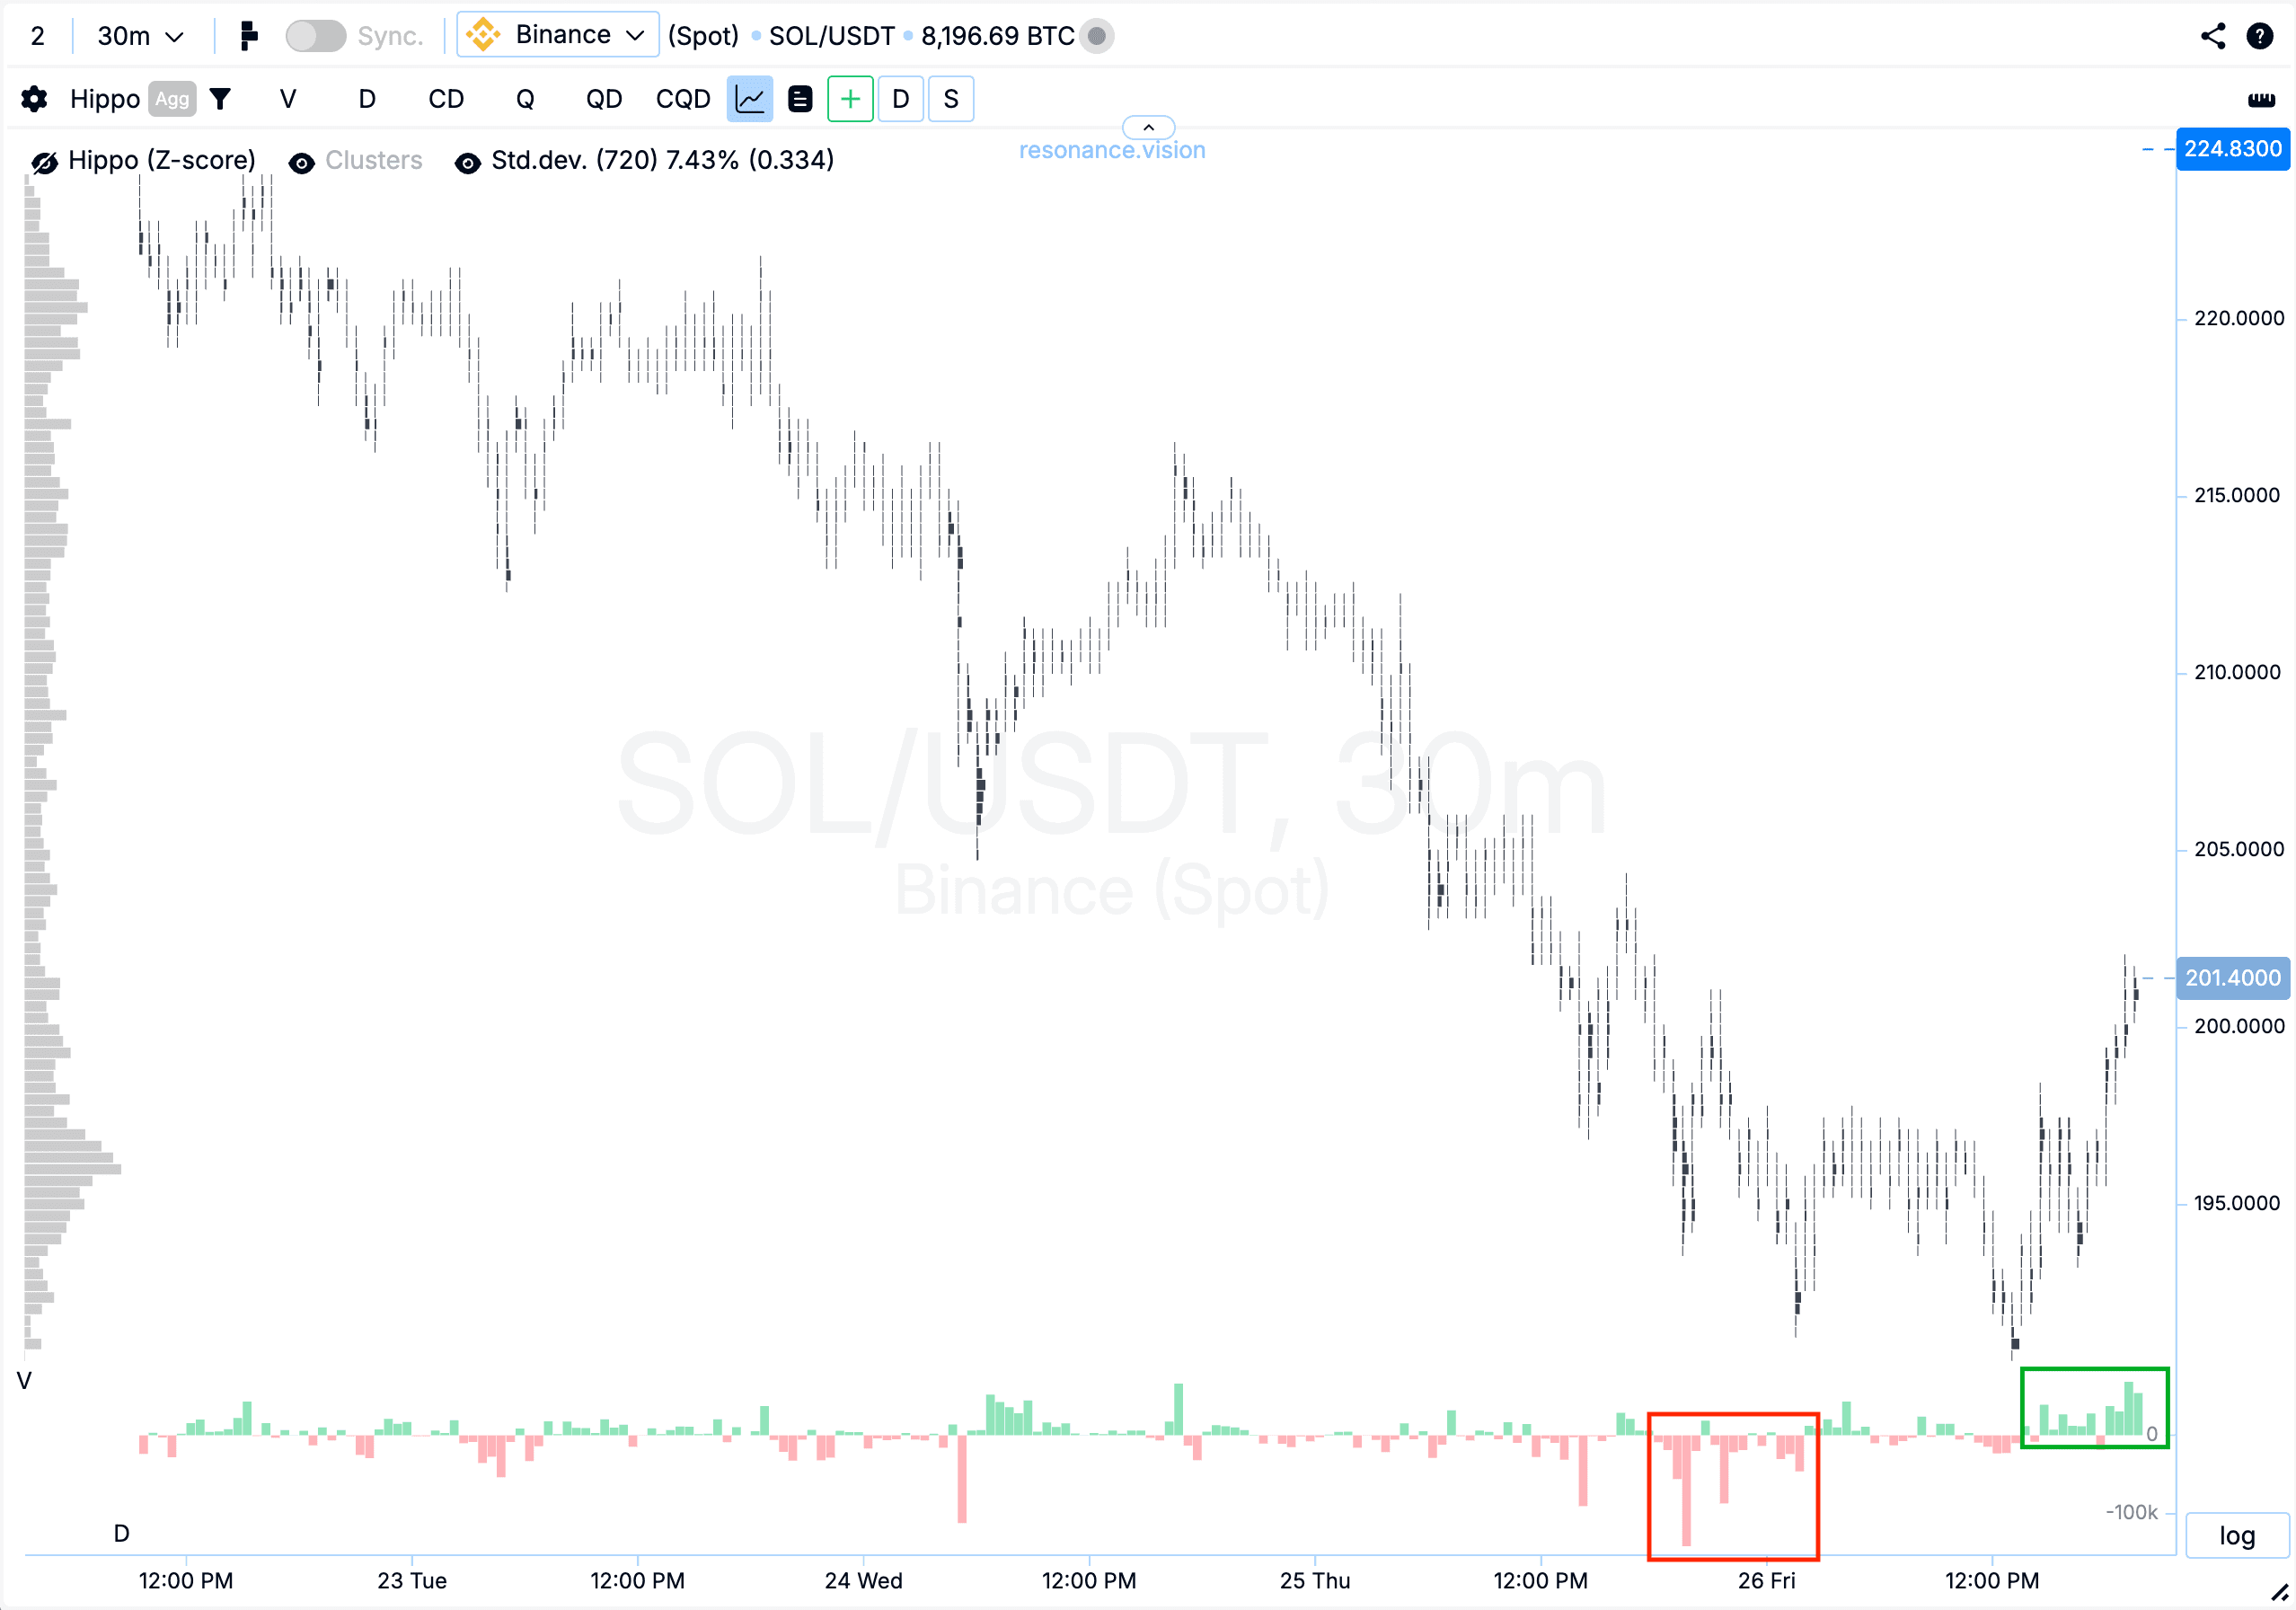
Кластерный график: после значительных рыночных продаж (красный прямоугольник) цена вошла в небольшую проторговку. Затем появились объёмные покупки (зелёный прямоугольник), которые начали выталкивать цену вверх. Это указывает на эффективность покупателей и сигнализирует о том, что инициатива перешла на их сторону.
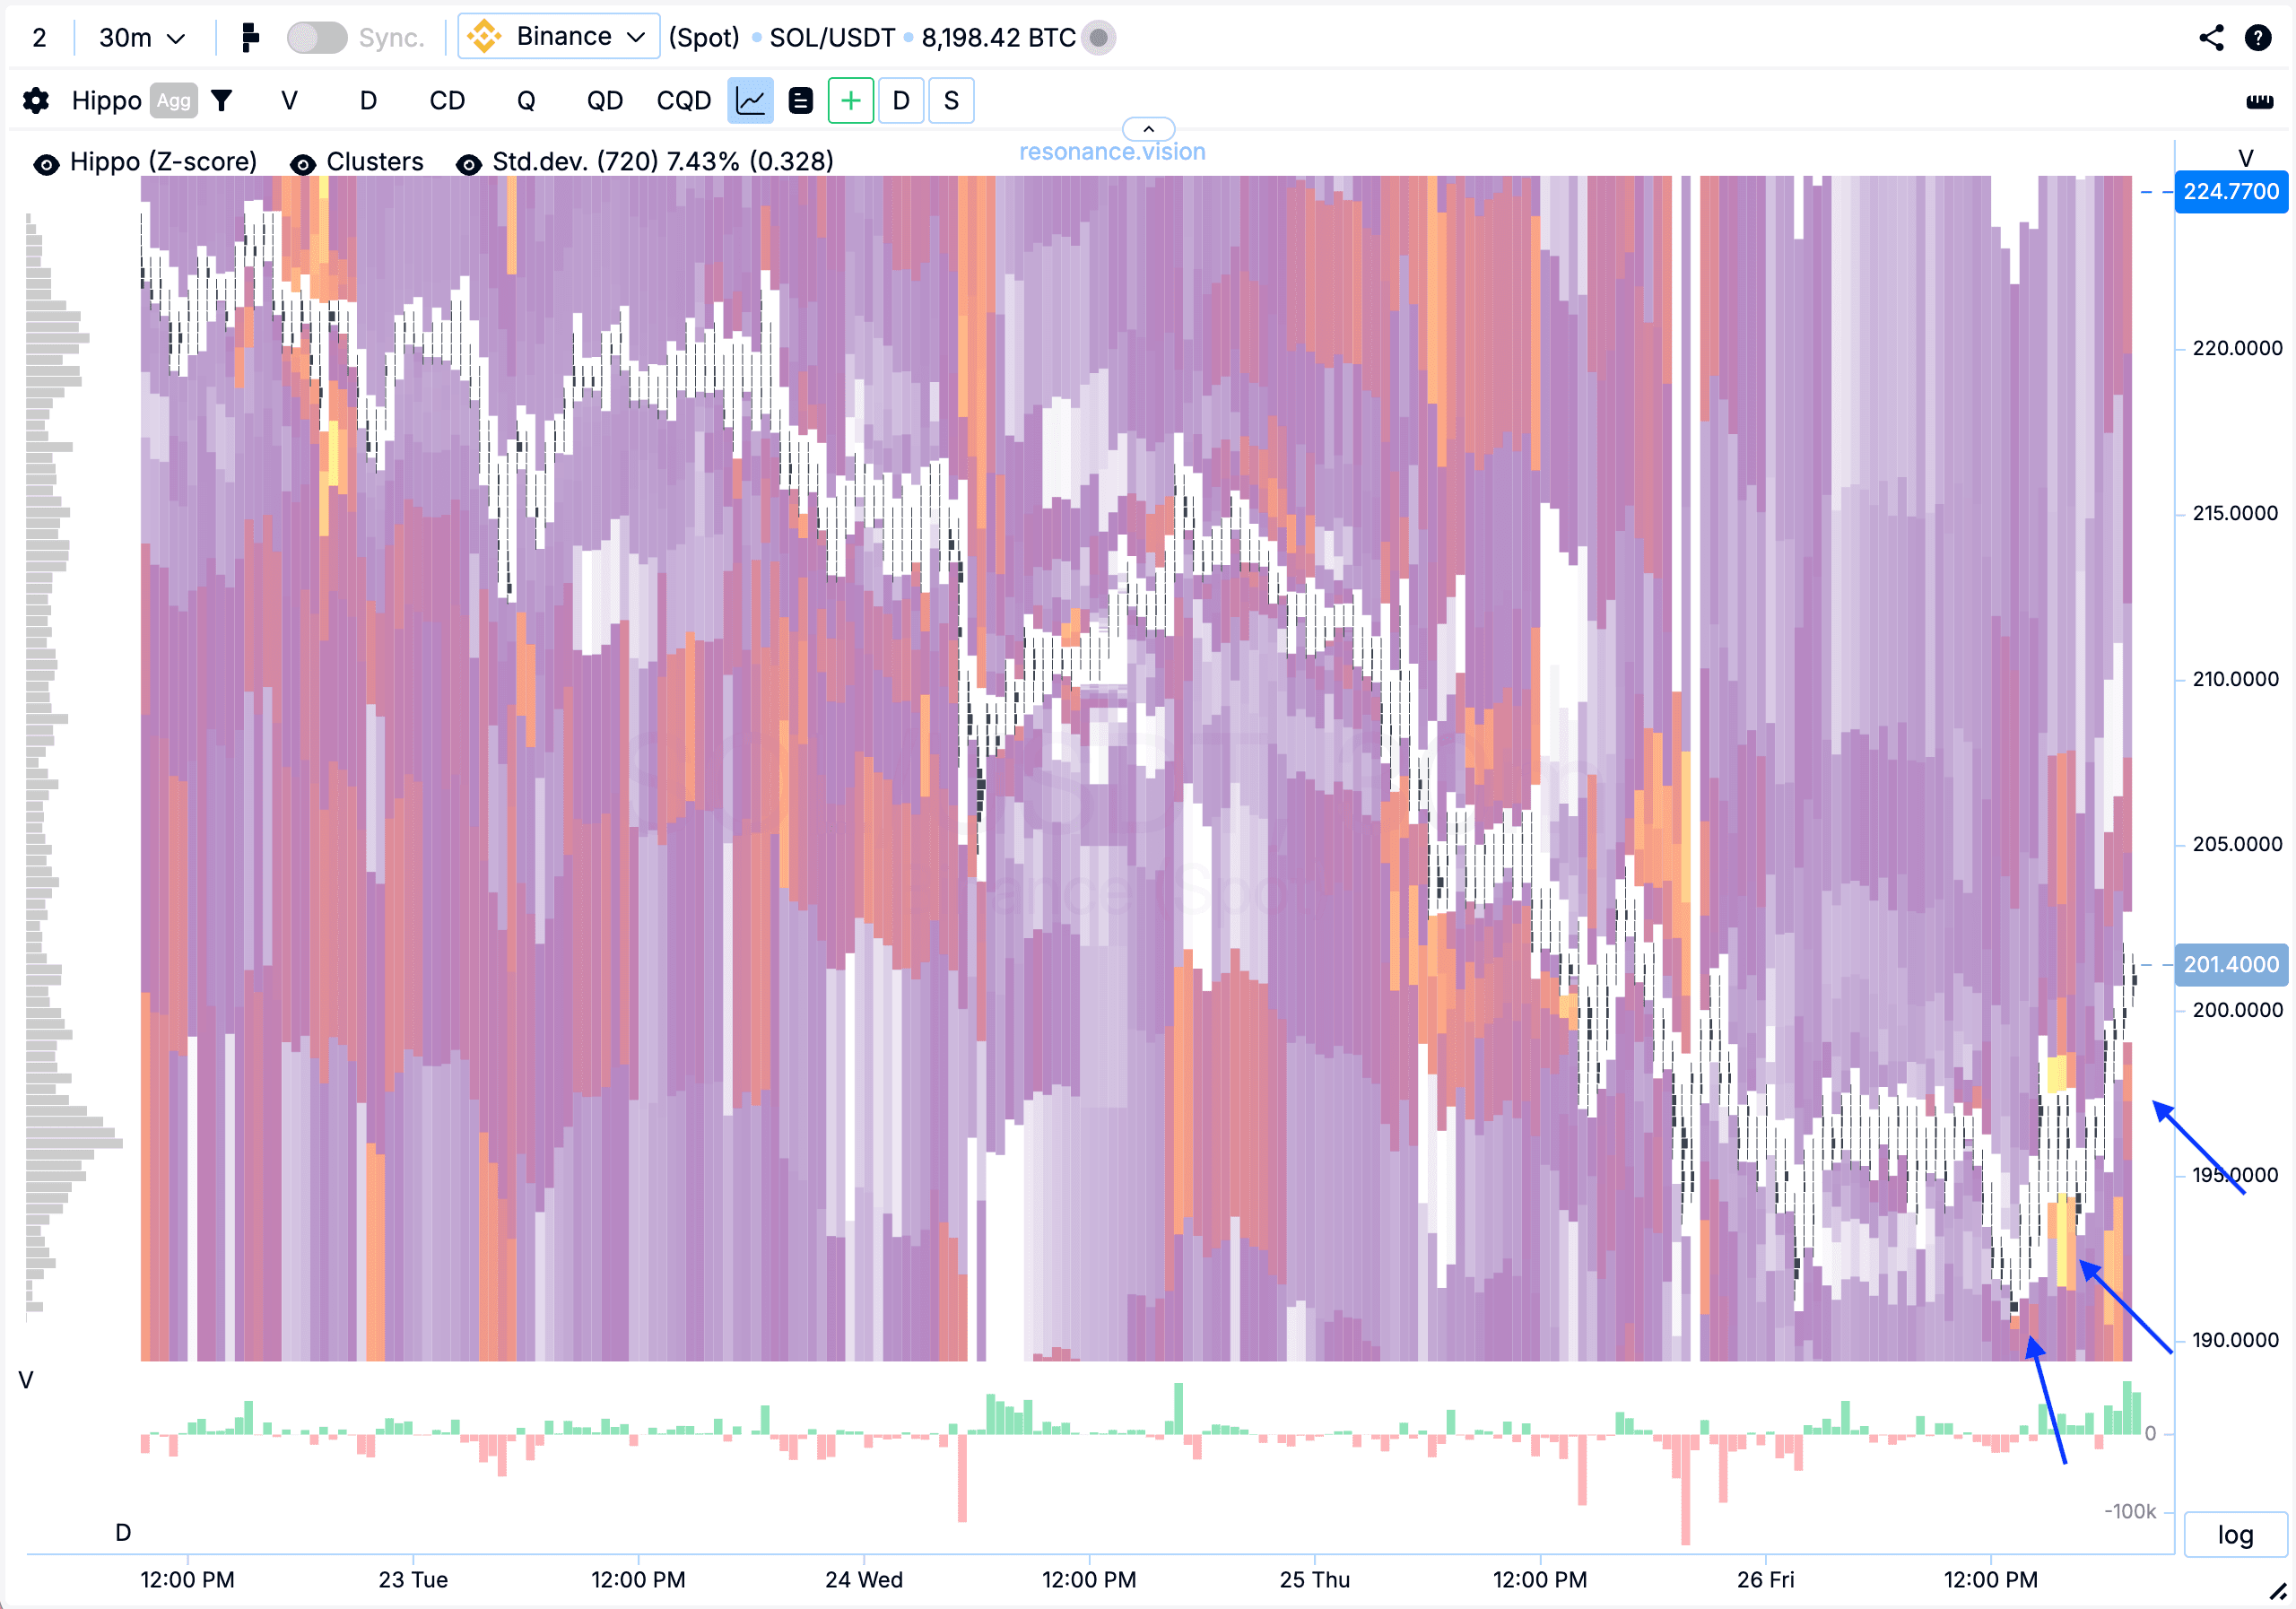
Тепловая карта (Z-Score): заметно постепенное смещение лимитных заявок на покупку выше — на карте они выделяются как аномальные скопления (синие стрелки). Такая динамика указывает на признаки локального дефицита и готовность участников выкупать весь маркет объем на продажу.
В Дешборде
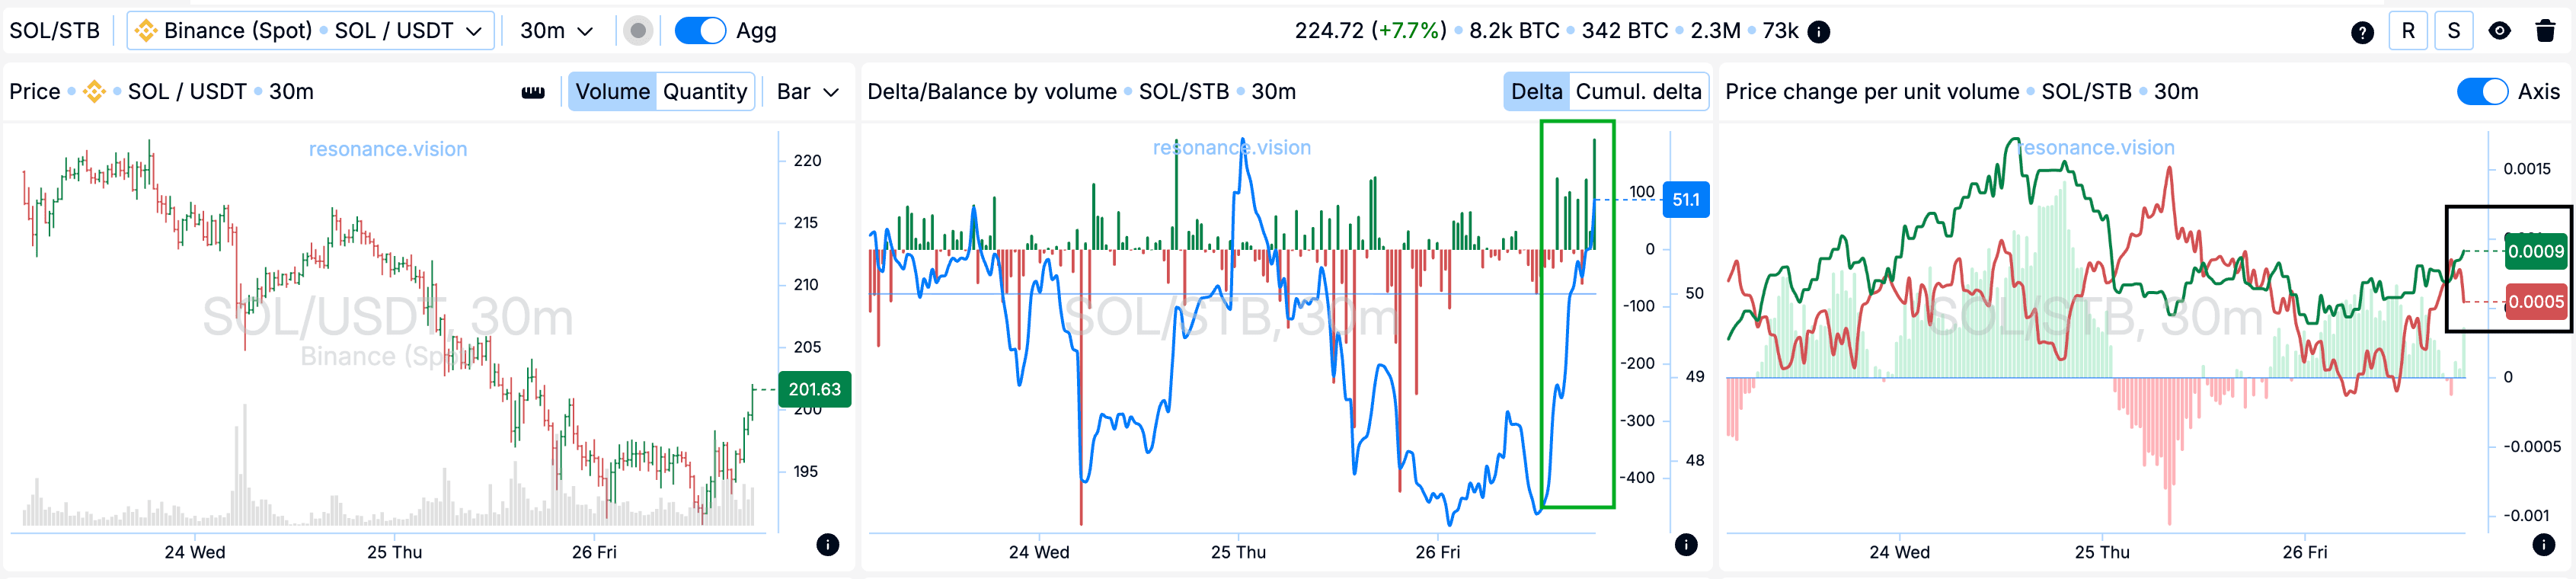
Дельта/Баланс по объёму: по рыночным ордерам заметно преобладание маркет-покупок — это хорошо видно на гистограмме дельты. Баланс также продолжает смещаться в сторону покупателей (зелёный прямоугольник), что подтверждает их активность.
Изменение цены на единицу объёма: Эффективность воздействия рыночных ордеров на цену также начали смещаться в пользу покупателей (чёрный прямоугольник).
Причины выхода
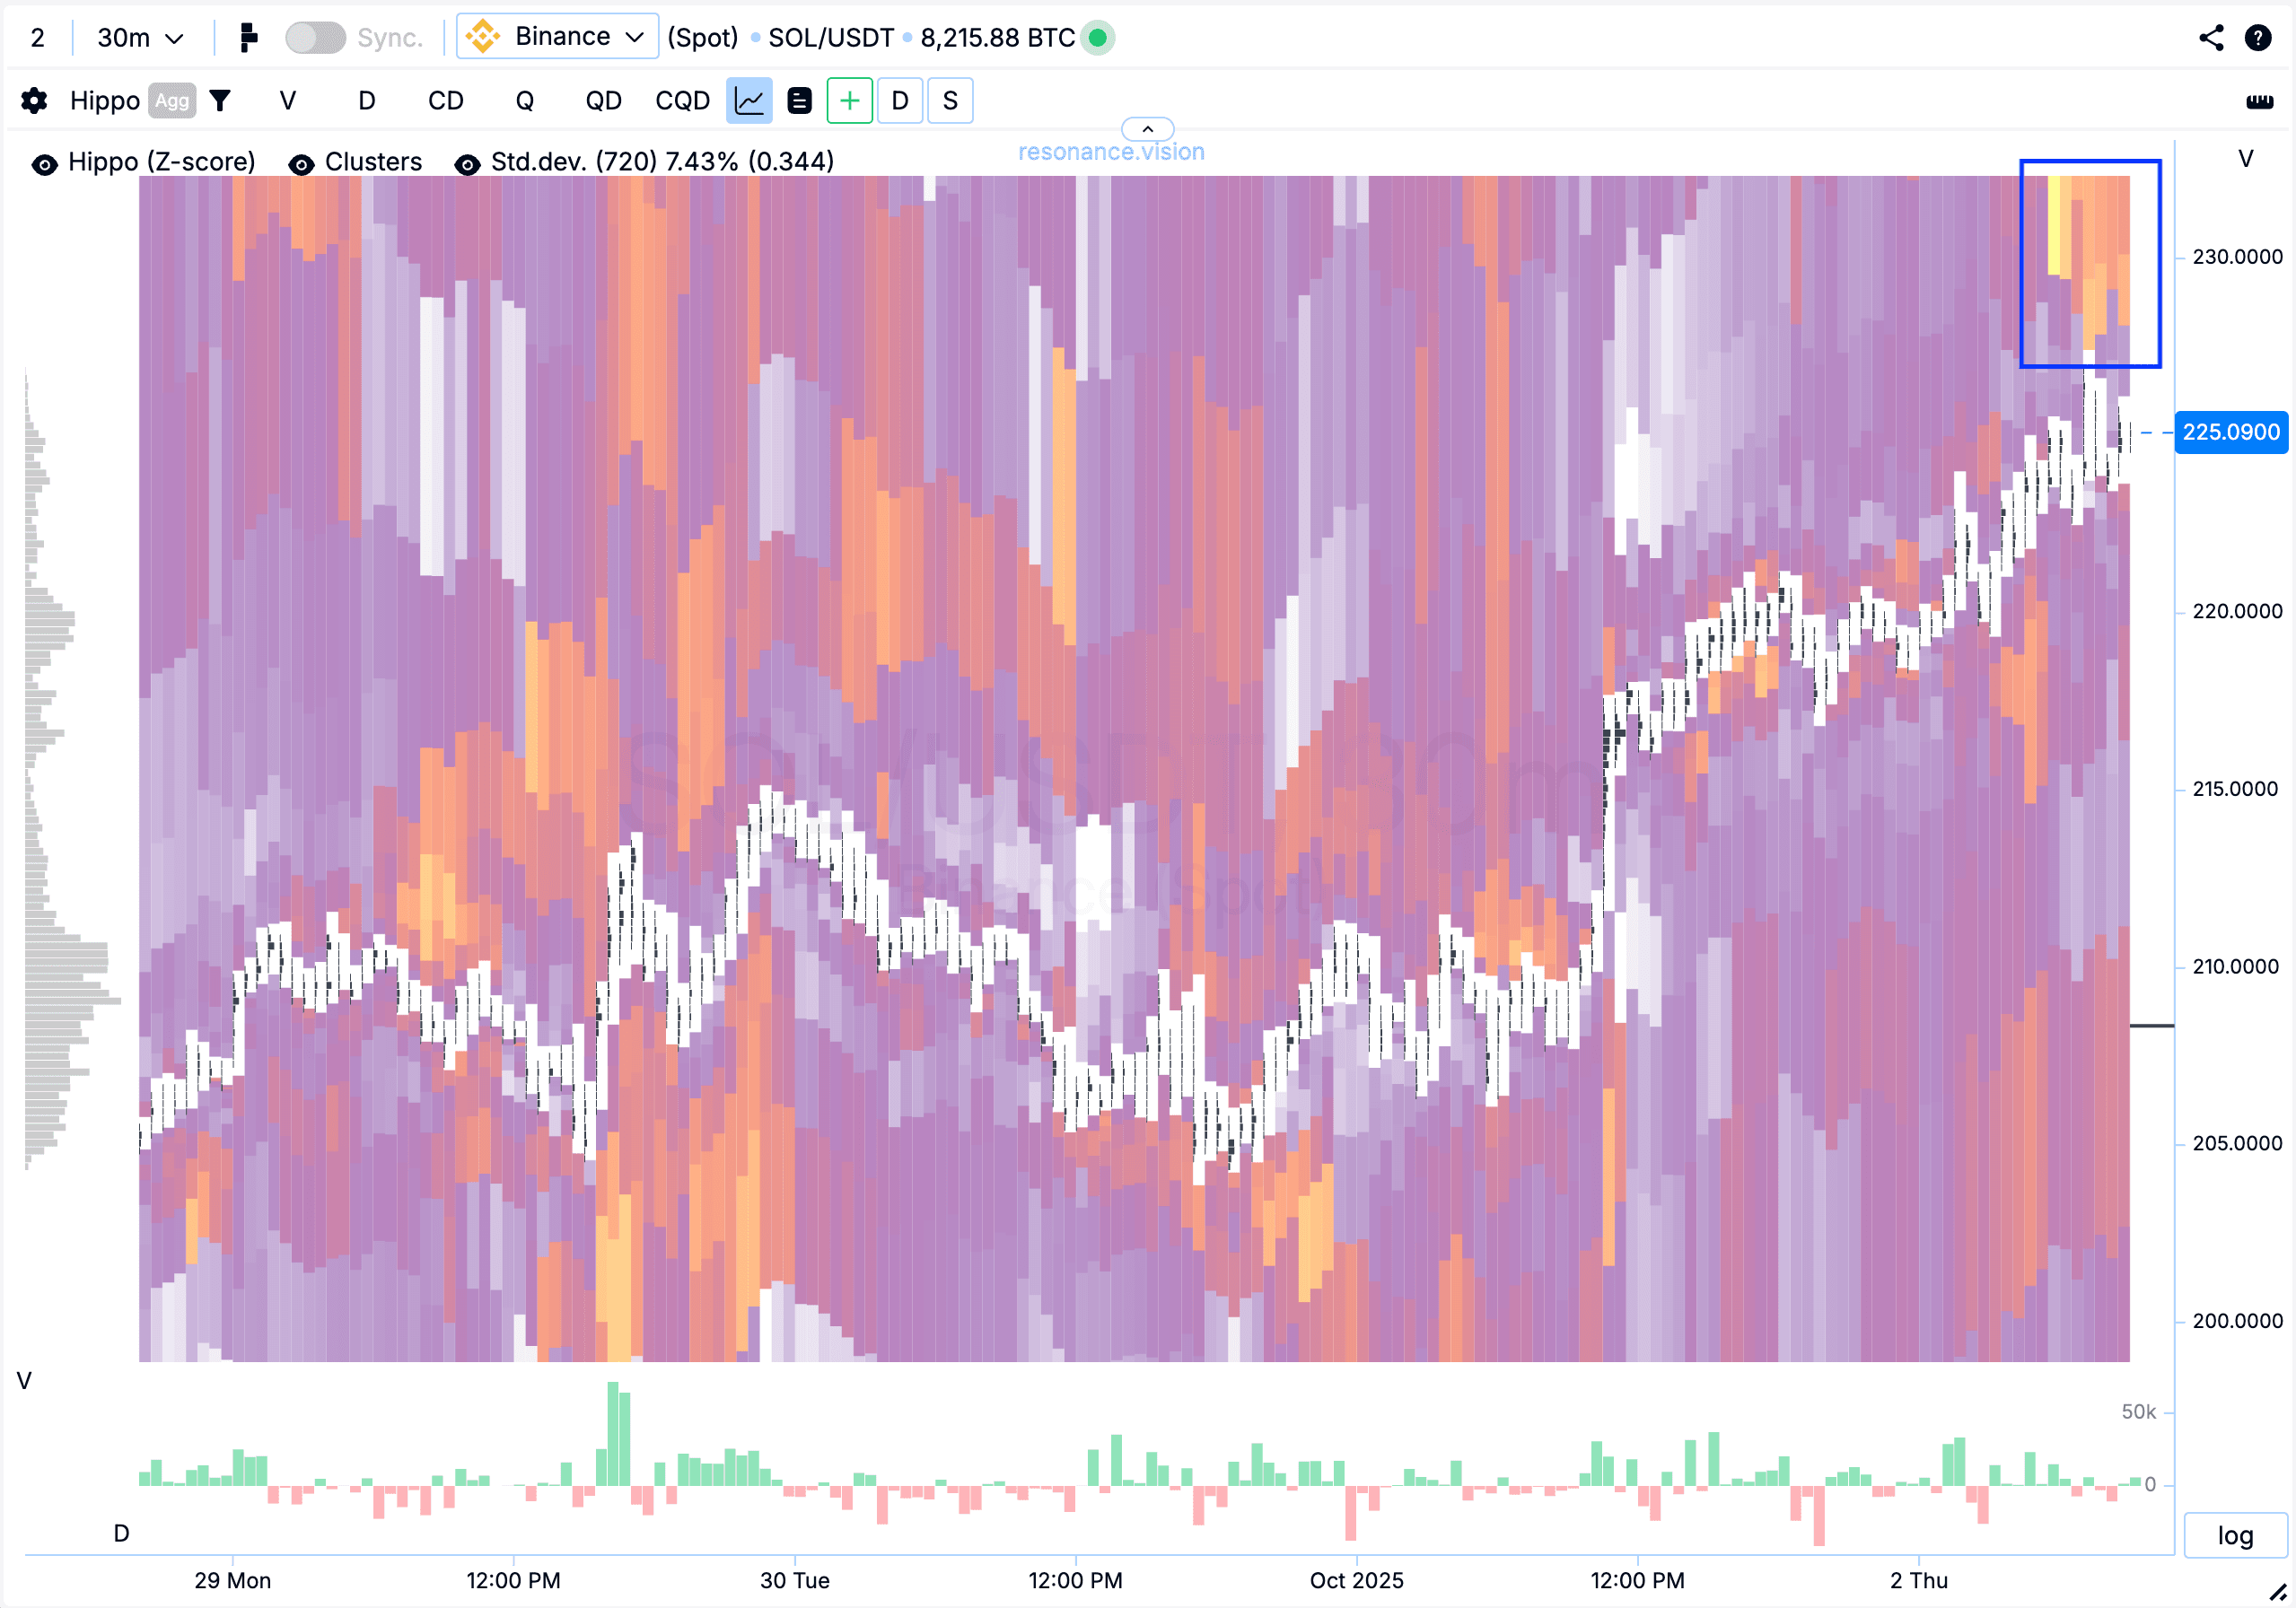
Тепловая карта (Z-Score): сверху появились аномальные лимитные плотности на продажу (синий прямоугольник), в которые частично приняли маркет-покупки. В такой ситуации решение не жадничать выглядит рациональным: ярко выраженные плотности удержали цену и могут стать сигналом к последующему возможному снижению.
Управление позицией
Эта сделка принесла хороший результат. В процессе удержания были сделаны дополнительные доборы, что позволило усилить общую позицию и более эффективно реализовать торговую идею.
Итог
В результате удалось зафиксировать прибыль в размере +132,27%.
Заключение
Эта сделка демонстрирует, как последовательный анализ кластерного графика, тепловой карты и агрегированных данных Дешборда позволяет находить точки с высоким потенциалом. После значительных продаж появление объёмных покупок и активные лимитные заявки на покупку указывали на интерес со стороны покупателей и формирование локального дефицита. Это стало основанием для построения гипотезы в лонг.
На выходе ключевым фактором стали аномальные лимитные плотности сверху, которые частично приняли маркет-покупки. Такая динамика указывает на снижение эффективности покупателей, поэтому фиксация результата выглядела рациональным решением.
Этот пример подчёркивает ценность комплексного анализа: совмещение кластерного графика, дельты, Z-Score и управления позицией позволяет вовремя оценивать баланс сил и эффективно реализовывать торговые идеи.
Следи за новыми статьями в нашем телеграм канале.
Не нужно выдумывать сложных схем и искать “грааль”. Используй инструменты платформы Resonance.
Регистрируйся по ссылке — получай бонус и начинай зарабатывать:
OKX | BingX | KuCoin.
Промокод TOPBLOG дает тебе 10% скидки на любой тарифный план Resonance.
Рекомендуемые статьи


