STO +46.7% (Directional Strategy Resonance)

This analysis demonstrates how cluster analysis and aggregated data can be used to identify weakening selling pressure and the moment when buyers take the initiative. Repeated selling without breaking the low and rising cumulative delta formed the basis for entering a long position, while the subsequent pullback after a strong rally signaled profit-taking.
Table of contents

Coin: STO/USDT
Risk: Medium
Understanding level: Beginner
Reasons for Entry
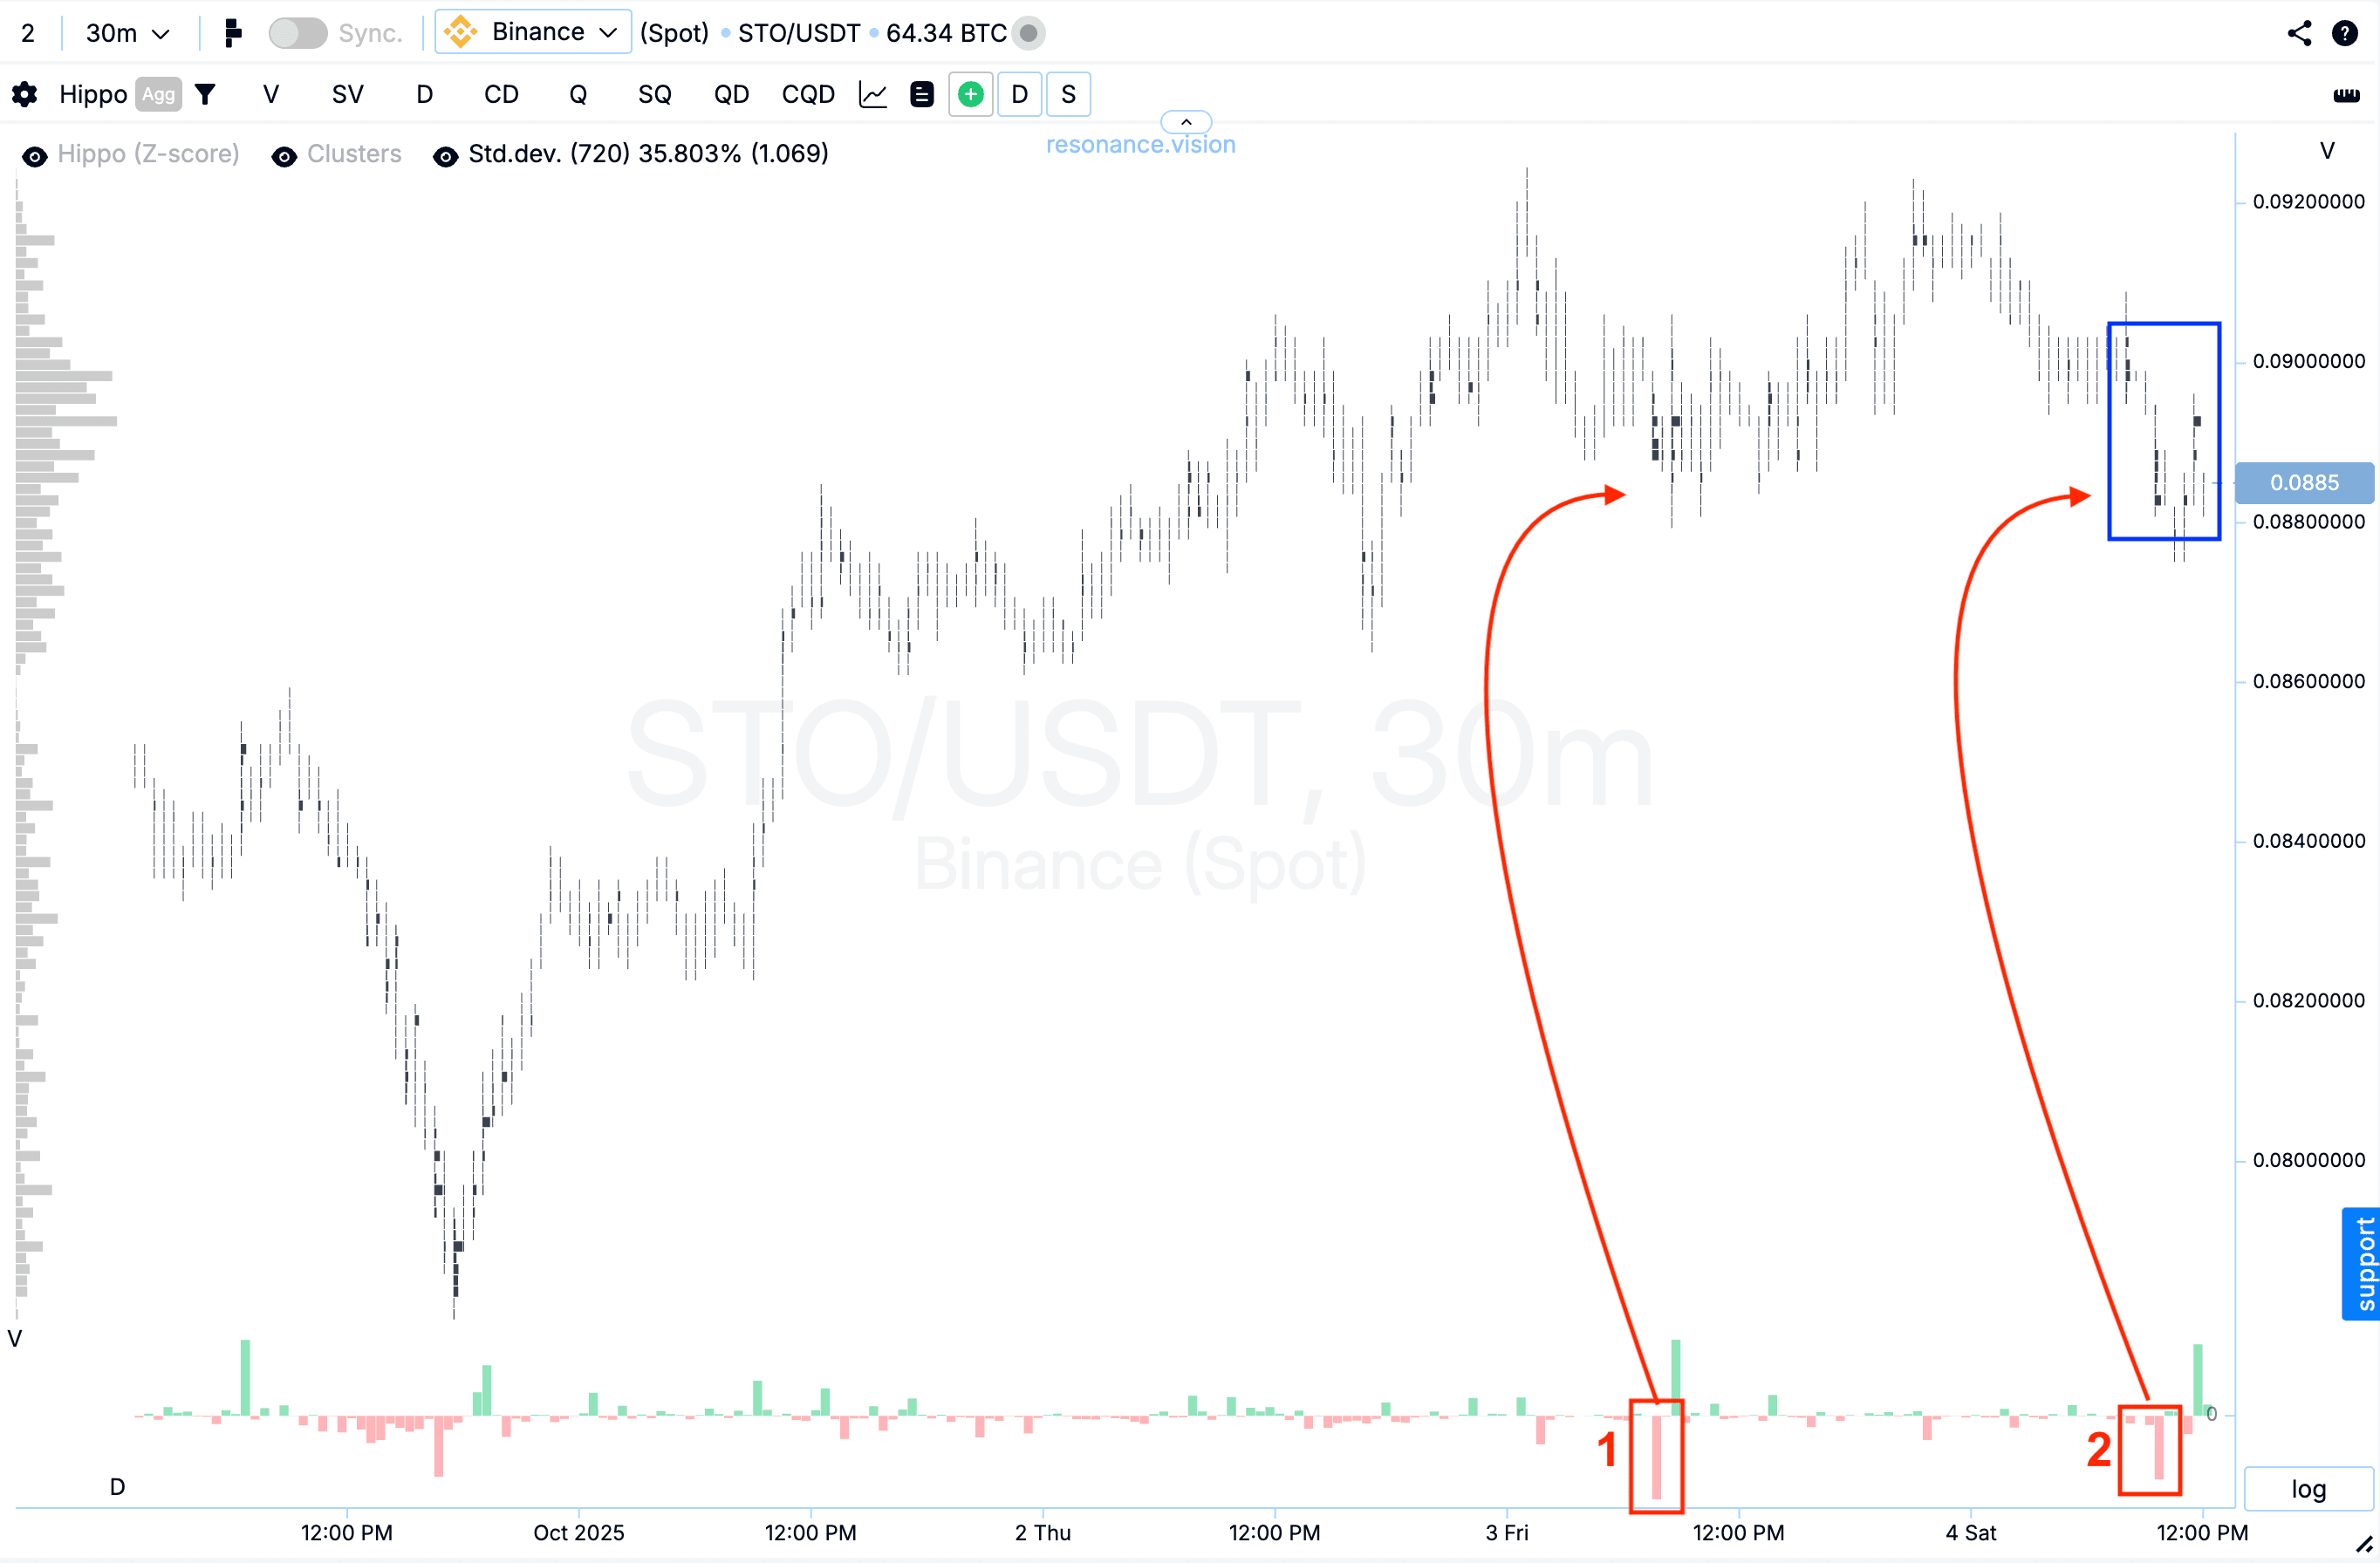
Cluster Chart: Volume clusters started to form (blue rectangle). The first sell volumes (red rectangle #1) didn’t lead to a new local low, which already indicated a weakening of selling pressure. The repeated selling (red rectangle #2) also failed to push the price lower. This behavior suggests a local supply shortage and the presence of buying interest.
In the Dashboard
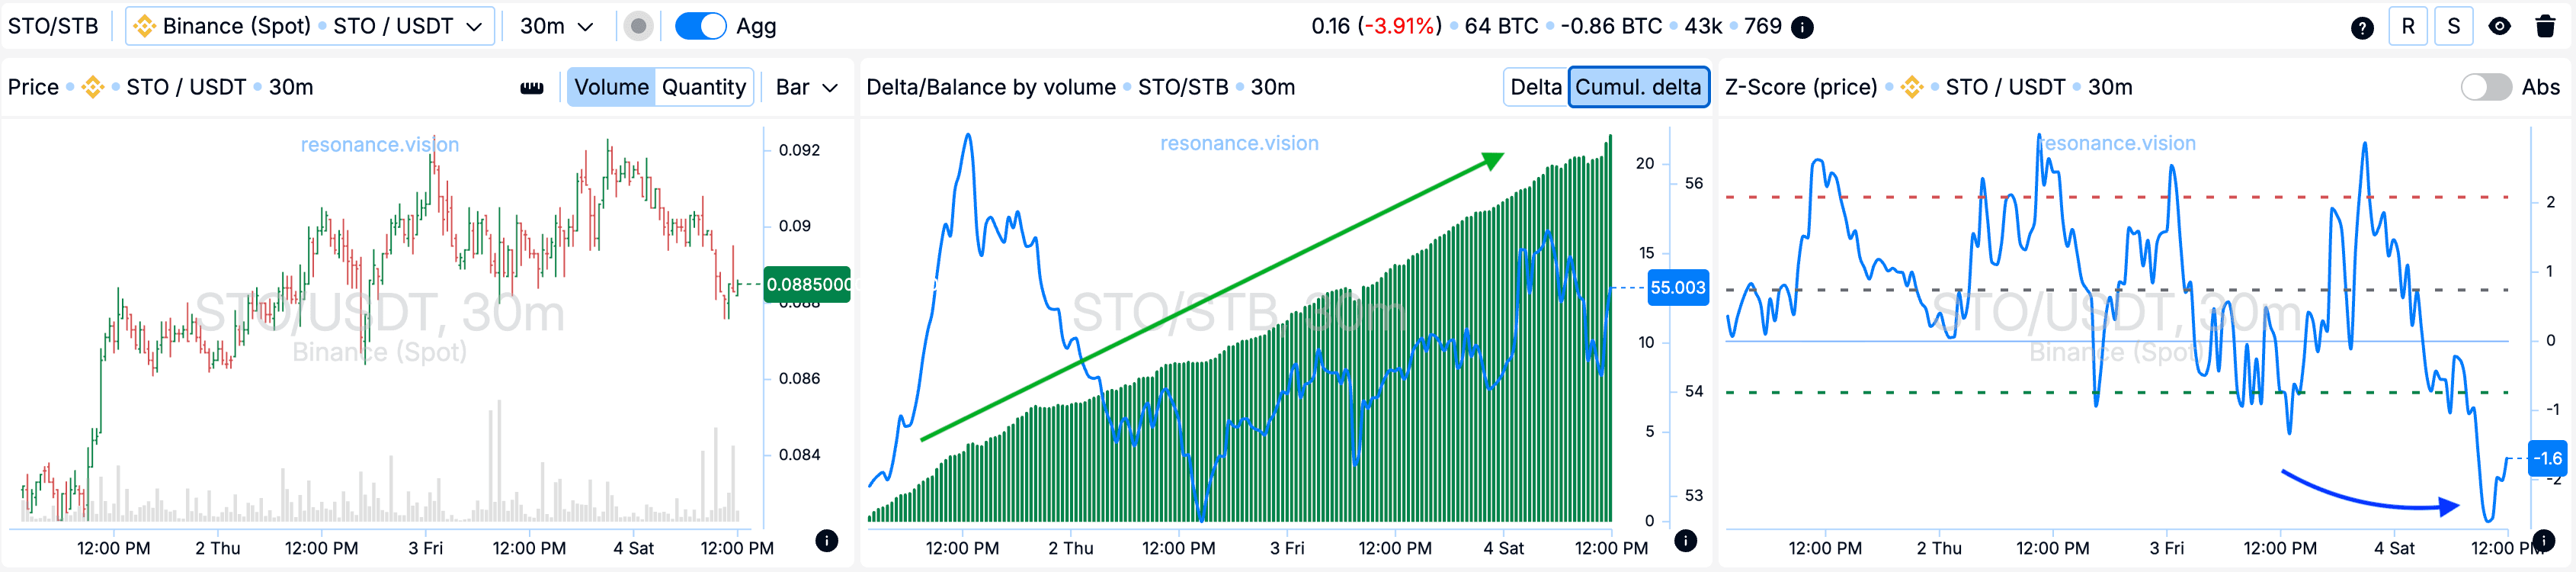
Delta/Volume Balance: Aggregated data shows an increase in market buys across all pairs and exchanges — this is clearly reflected in the rising cumulative delta histogram (green arrow).
Z-Score (Price): Additionally, the price deviated downward by more than two standard deviations and moved beyond the lower percentile zone, which is a rare event for this asset (blue arrow).
Reasons for Exit
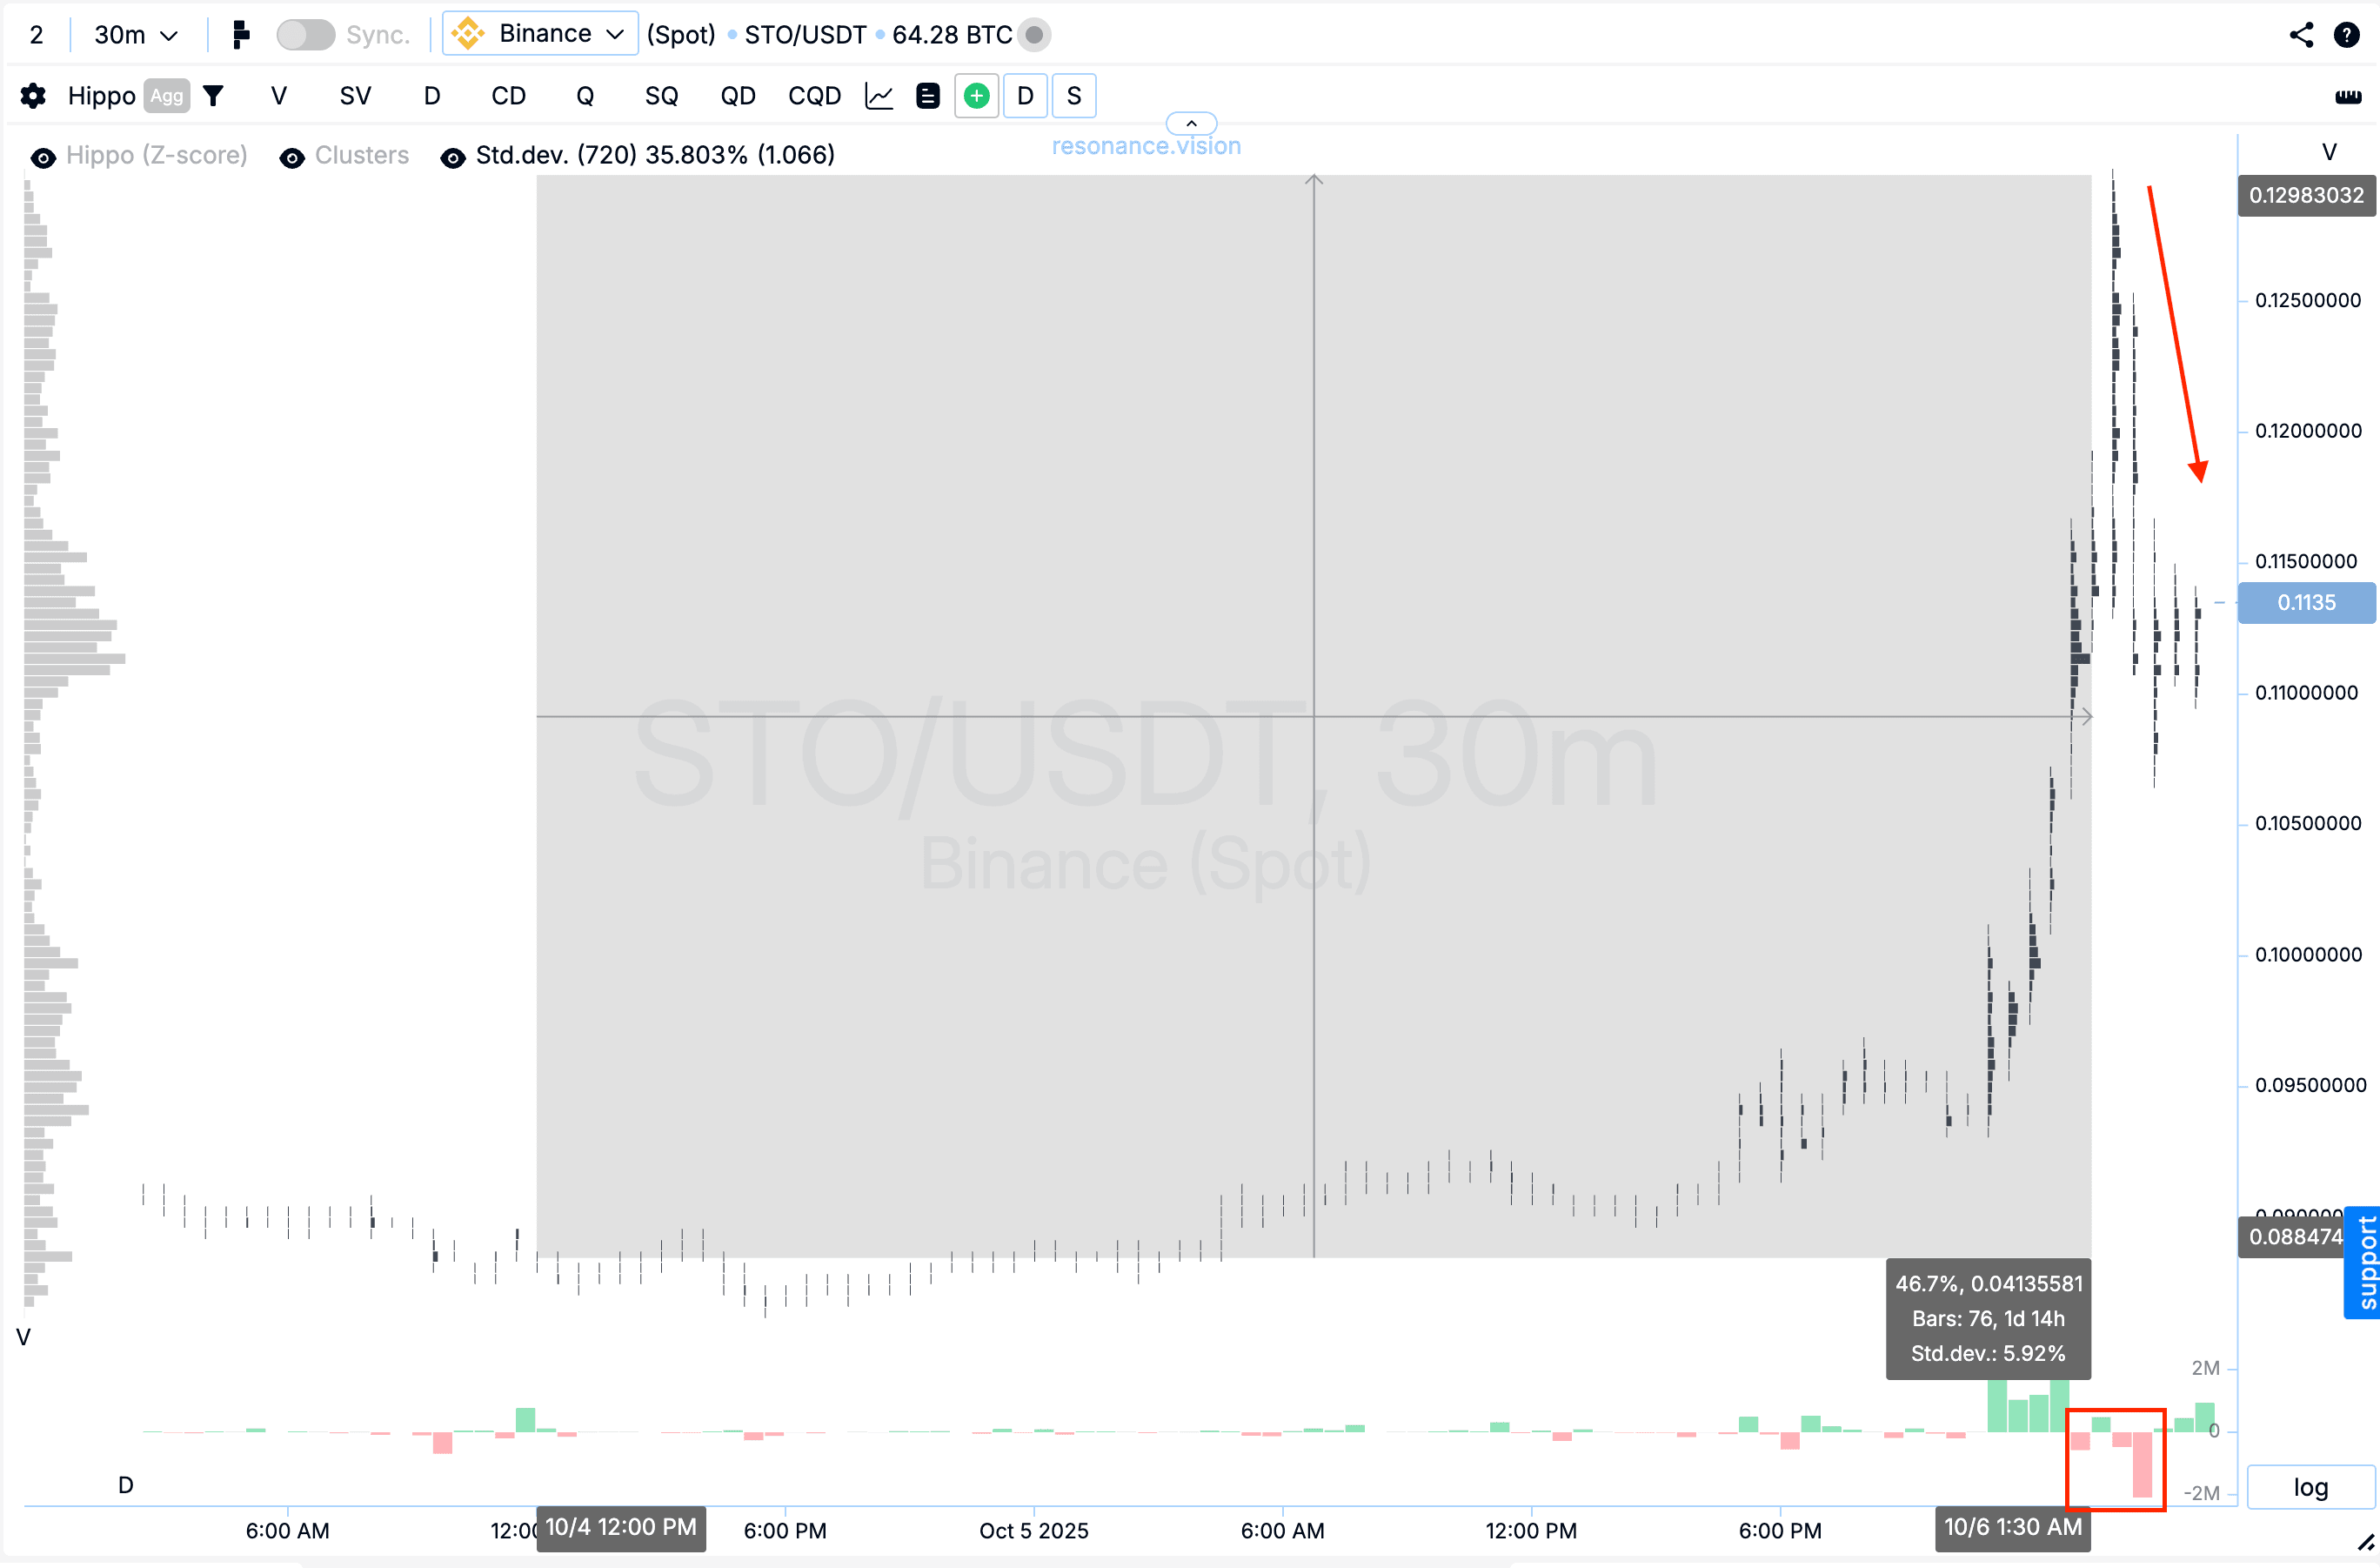
Cluster Chart: From the entry point, the price increased by almost 50%, which is already a strong move. However, a noticeable pullback followed, accompanied by significant selling volumes (rectangle and arrow). Under such conditions, holding the position further carried increased risk, making profit-taking the most rational decision.
Conclusion
This trade demonstrates how combining cluster analysis with Dashboard data helps identify moments when sellers lose initiative and buyers start taking control. Repeated selling without new lows and a rising cumulative delta indicated a local shortage and growing buying interest — which became the basis for opening a long position.
On the exit side, the key signal was the nearly 50% price increase followed by heavy selling on the pullback, indicating potential buyer exhaustion and increased risk of further holding.
This example highlights the importance of analyzing price reactions to volume and the ability to secure profits in time before the market turns.
Follow new insights in our telegram channel.
No need to invent complex schemes and look for the "grail". Use the Resonance platform tools.
Register via the link — get a bonus and start earning:
OKX | BingX | KuCoin.
Promo code TOPBLOG gives you a 10% discount on any Resonance tariff plan.
Recommended articles


