STRK +208,70% (Напрямкова стратегія Резонанс)

Цей аналіз покаже, як навіть новачок може отримувати прибуток з низьким ризиком.
Докладно розглянемо, як:
Слабка реакція ціни на продаж сигналізувала про дефіцит.
Лімітна підтримка та низька волатильність створили ідеальну точку входу.
Своєчасна фіксація прибутку врятувала від розвороту.
Дізнайся, як аналіз об’ємів допомагає системно отримувати прибуток!
Зміст

Монета: STRK/USDT
Ризик: низький
Рівень розуміння: новачок
Причини входу
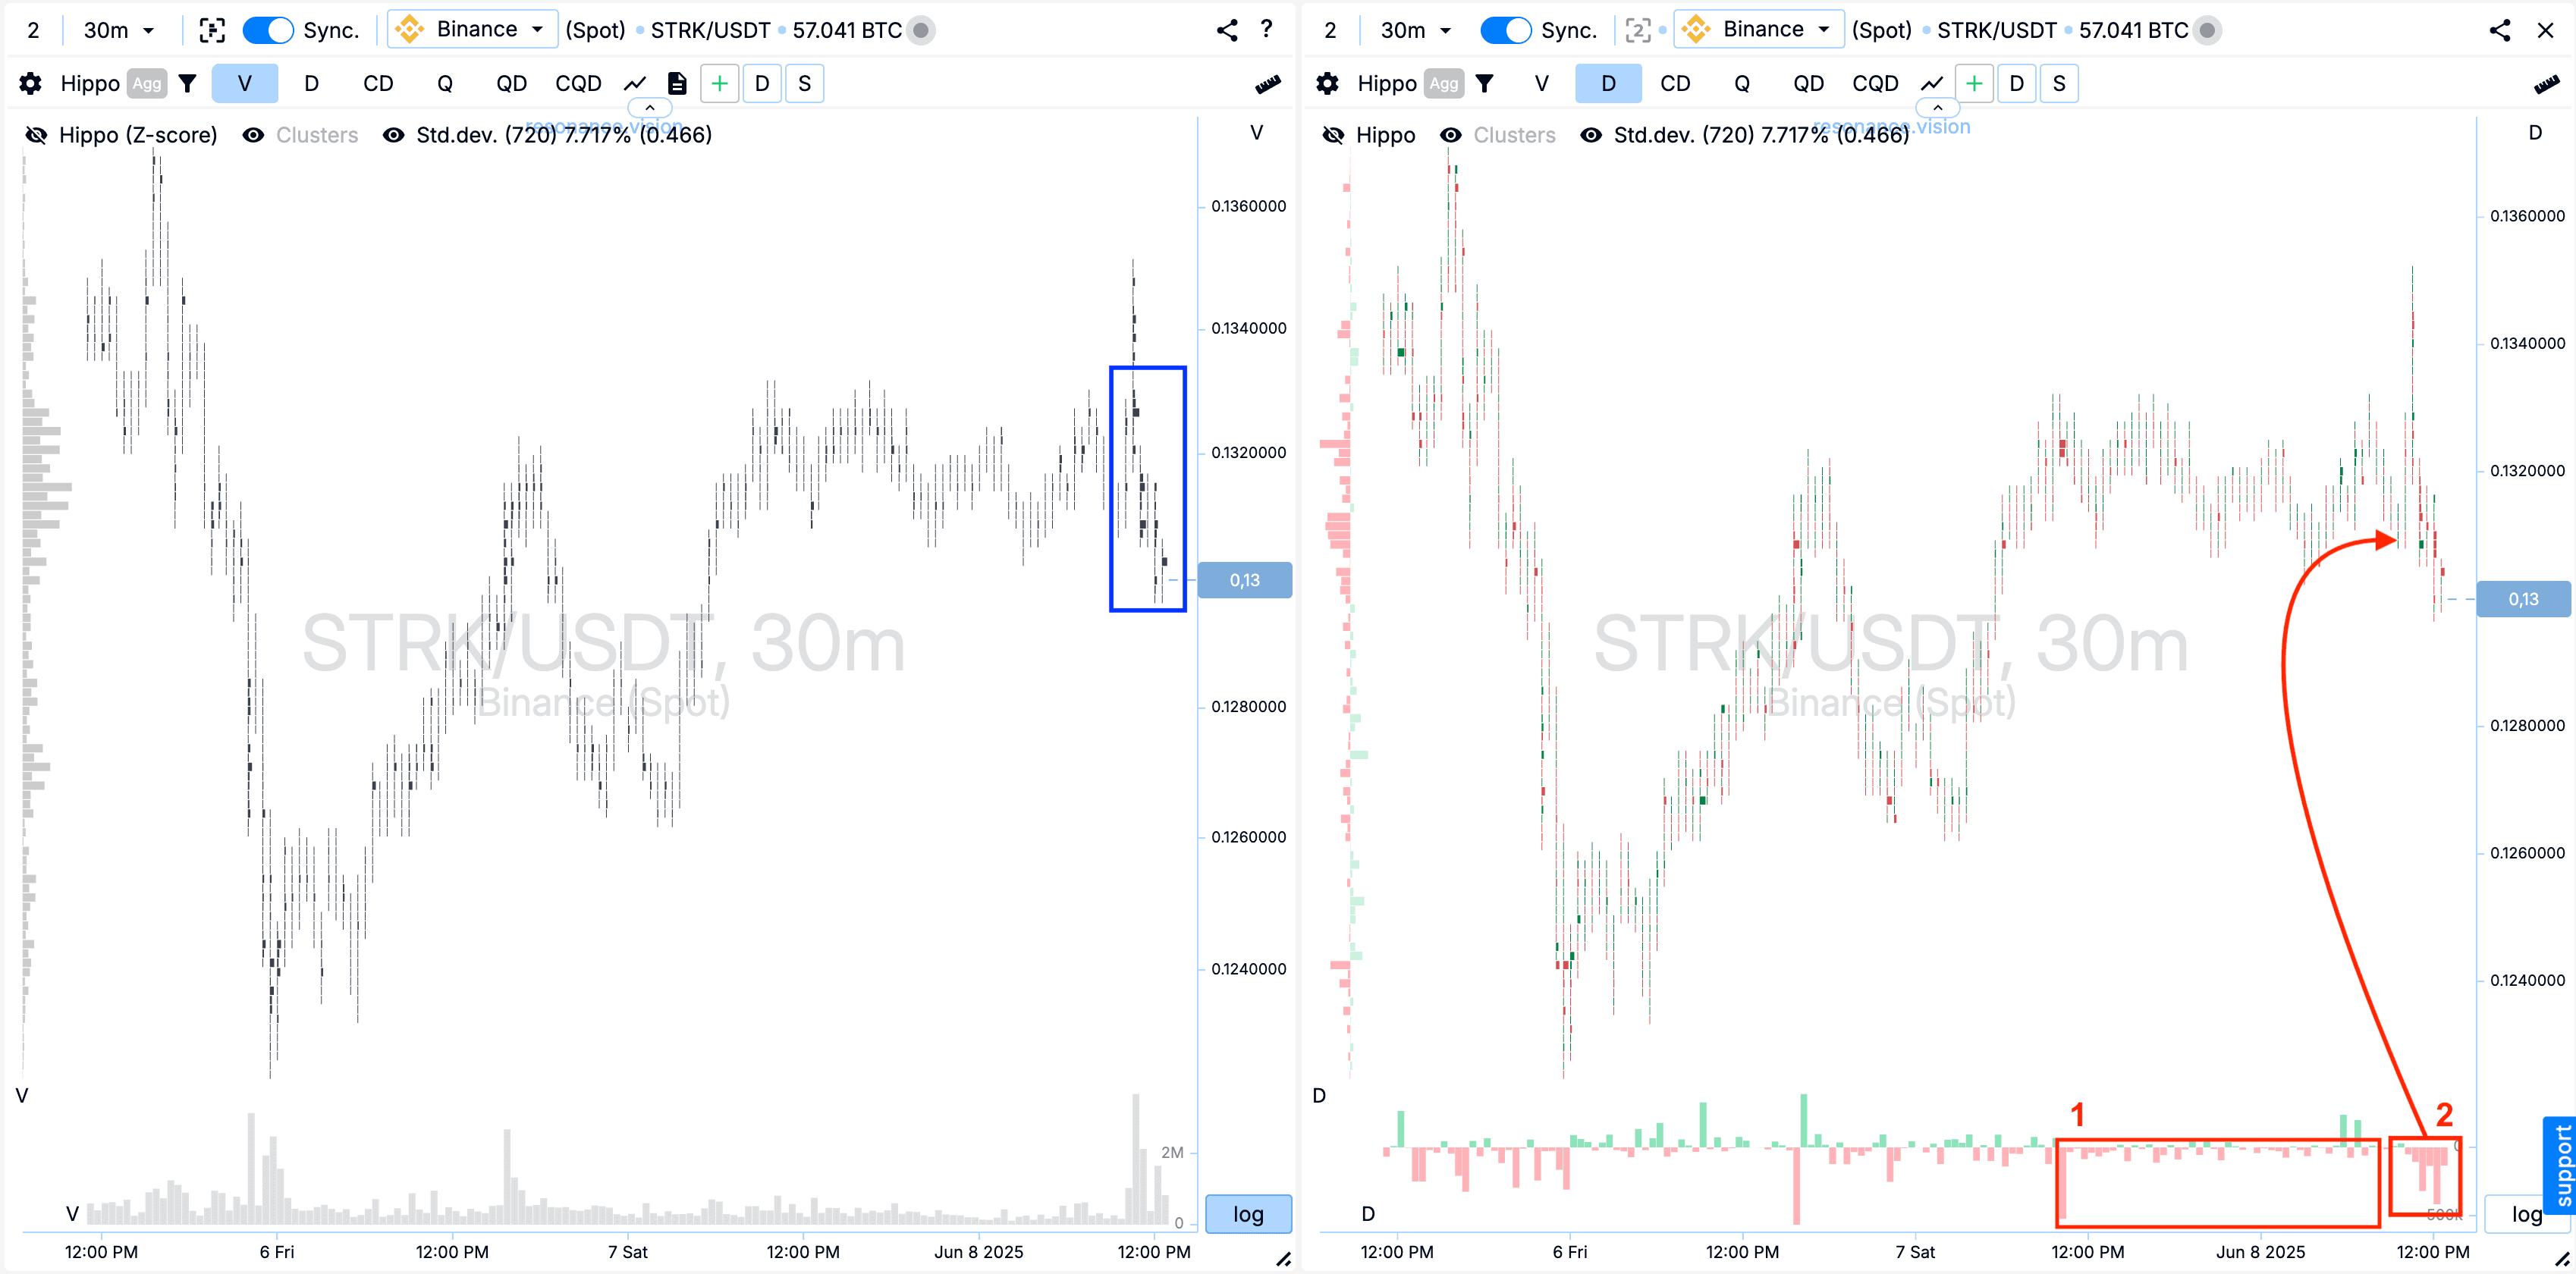
Кластерний графік: У ціновому діапазоні відзначив сформовані кластери за об’ємом (синій прямокутник).
Оцінюючи поведінку учасників, зазначив, що, незважаючи на тривалу переважання продажів (прямокутник №1), ціна не знижувалася. Навіть зі збільшенням об’єму продажу (прямокутник №2), реакція ціни залишалася мінімальною. Це свідчить про можливе наявність локального дефіциту.
У Дешборді
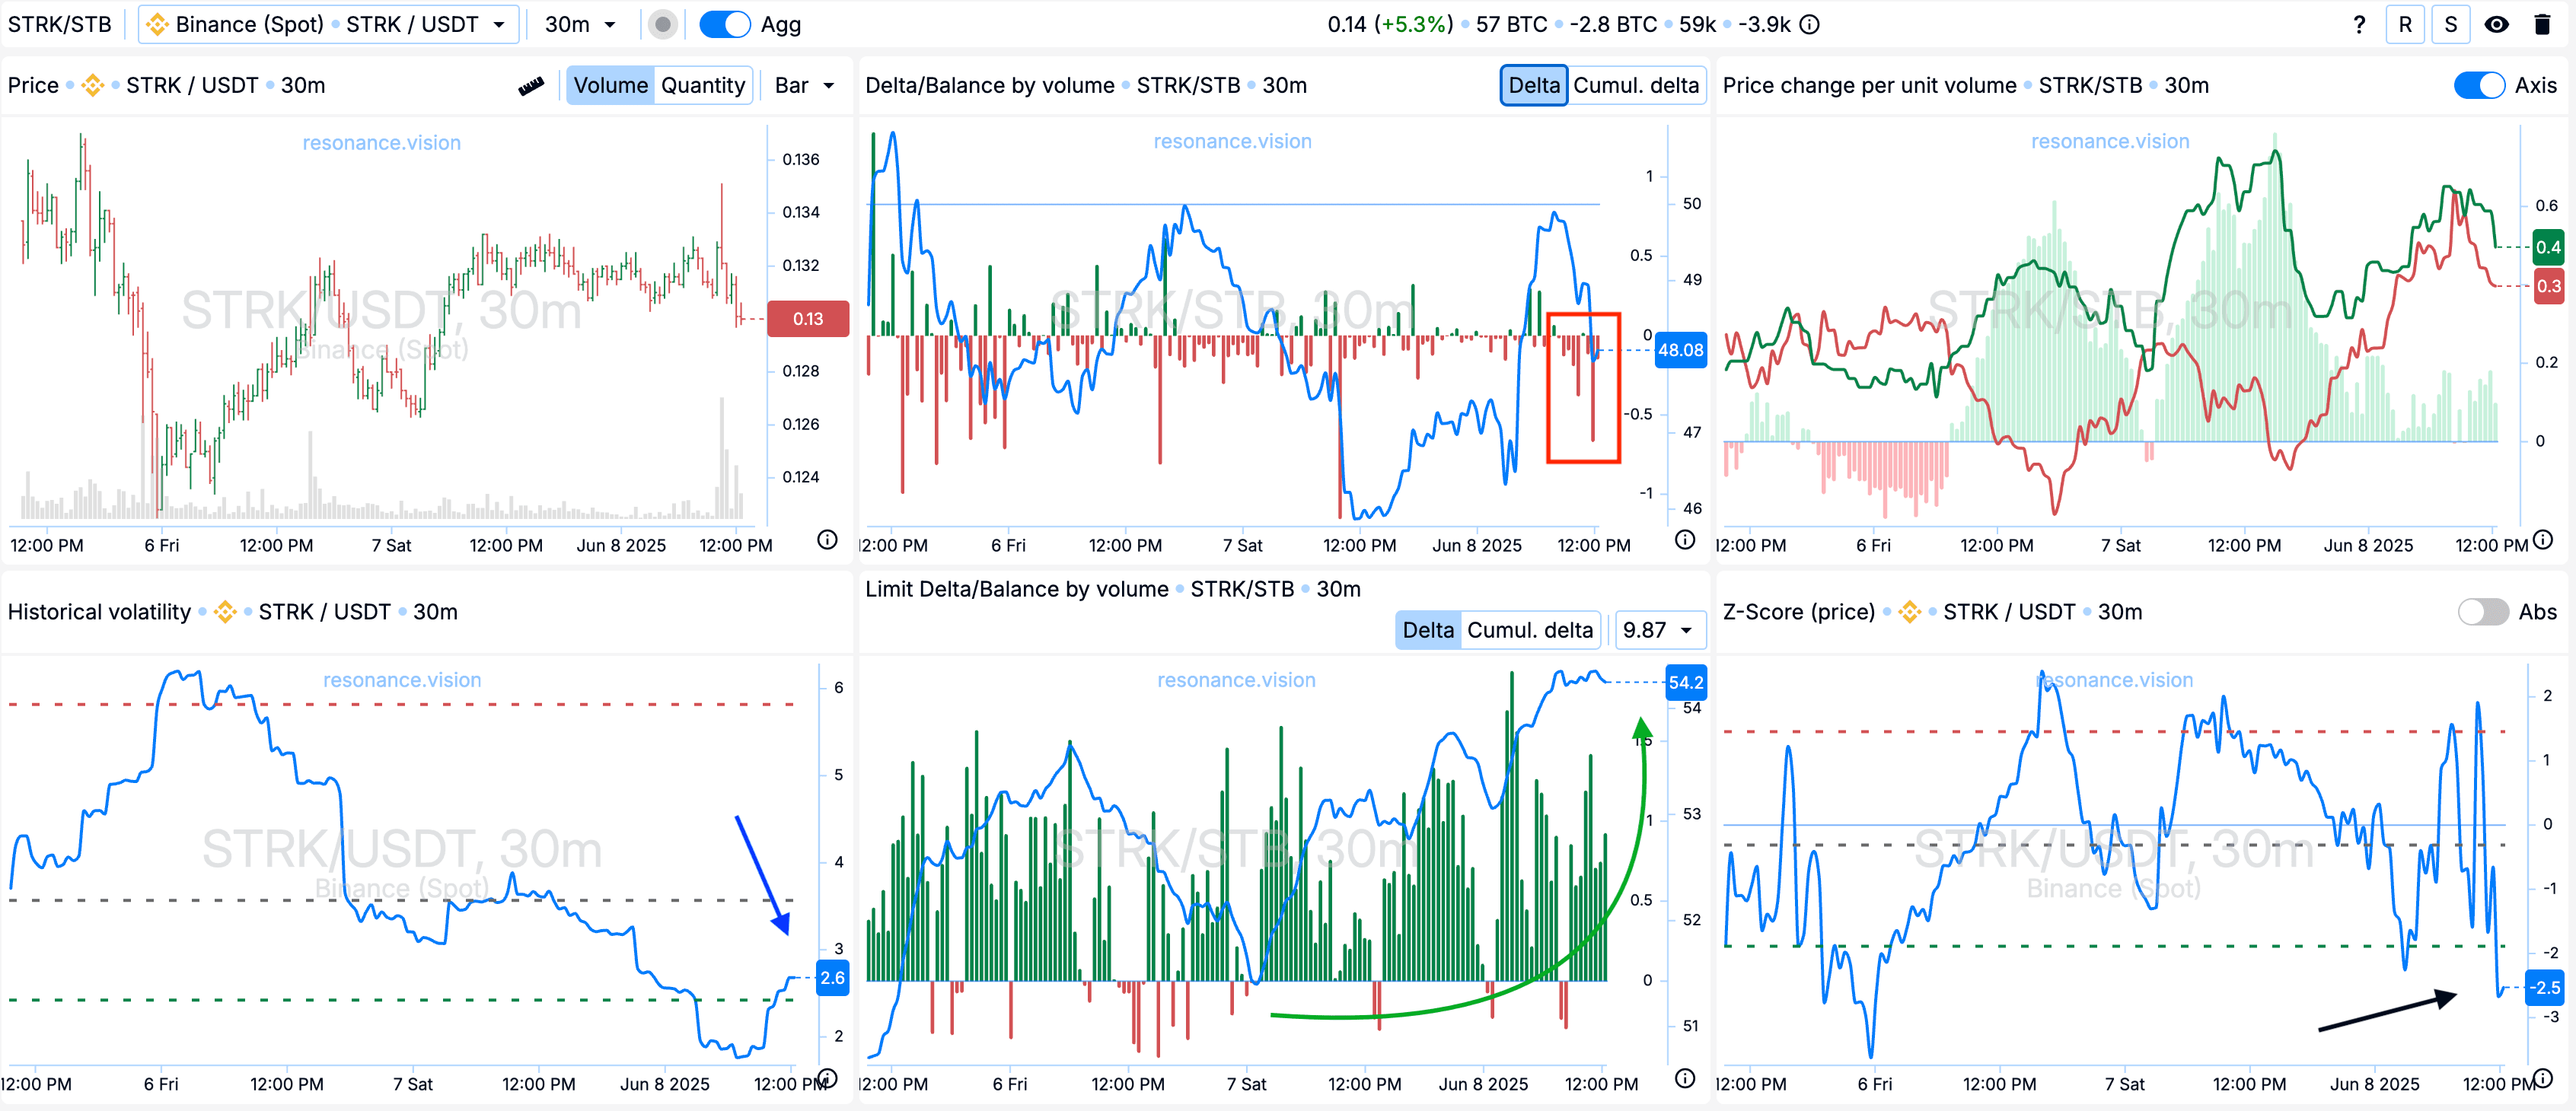
Дельта/Баланс за об’ємом та лімітна дельта: Згідно з агрегованими даними, переважають ринкові продажі (червоний прямокутник). При цьому за лімітними заявками спостерігається активна підстановка ордерів на покупку - це відбивається на гістограмах дельти (зелена стрілка). Така ситуація вказує на наявність лімітної підтримки, яка готова прийняти вхідний ринковий об’єм продажів.
Історична волатильність: На момент входу в позицію волатильність знаходилася на досить низькому значенні (синя стрілка), що часто передує значущому руху ціни.
Z-Score (ціна): Також зазначено аномальне відхилення ціни вниз — більш ніж на 2,5 стандартних відхилення (чорна стрілка), що може свідчити про потенційну точку розвороту або крайнє значення.
Причини виходу
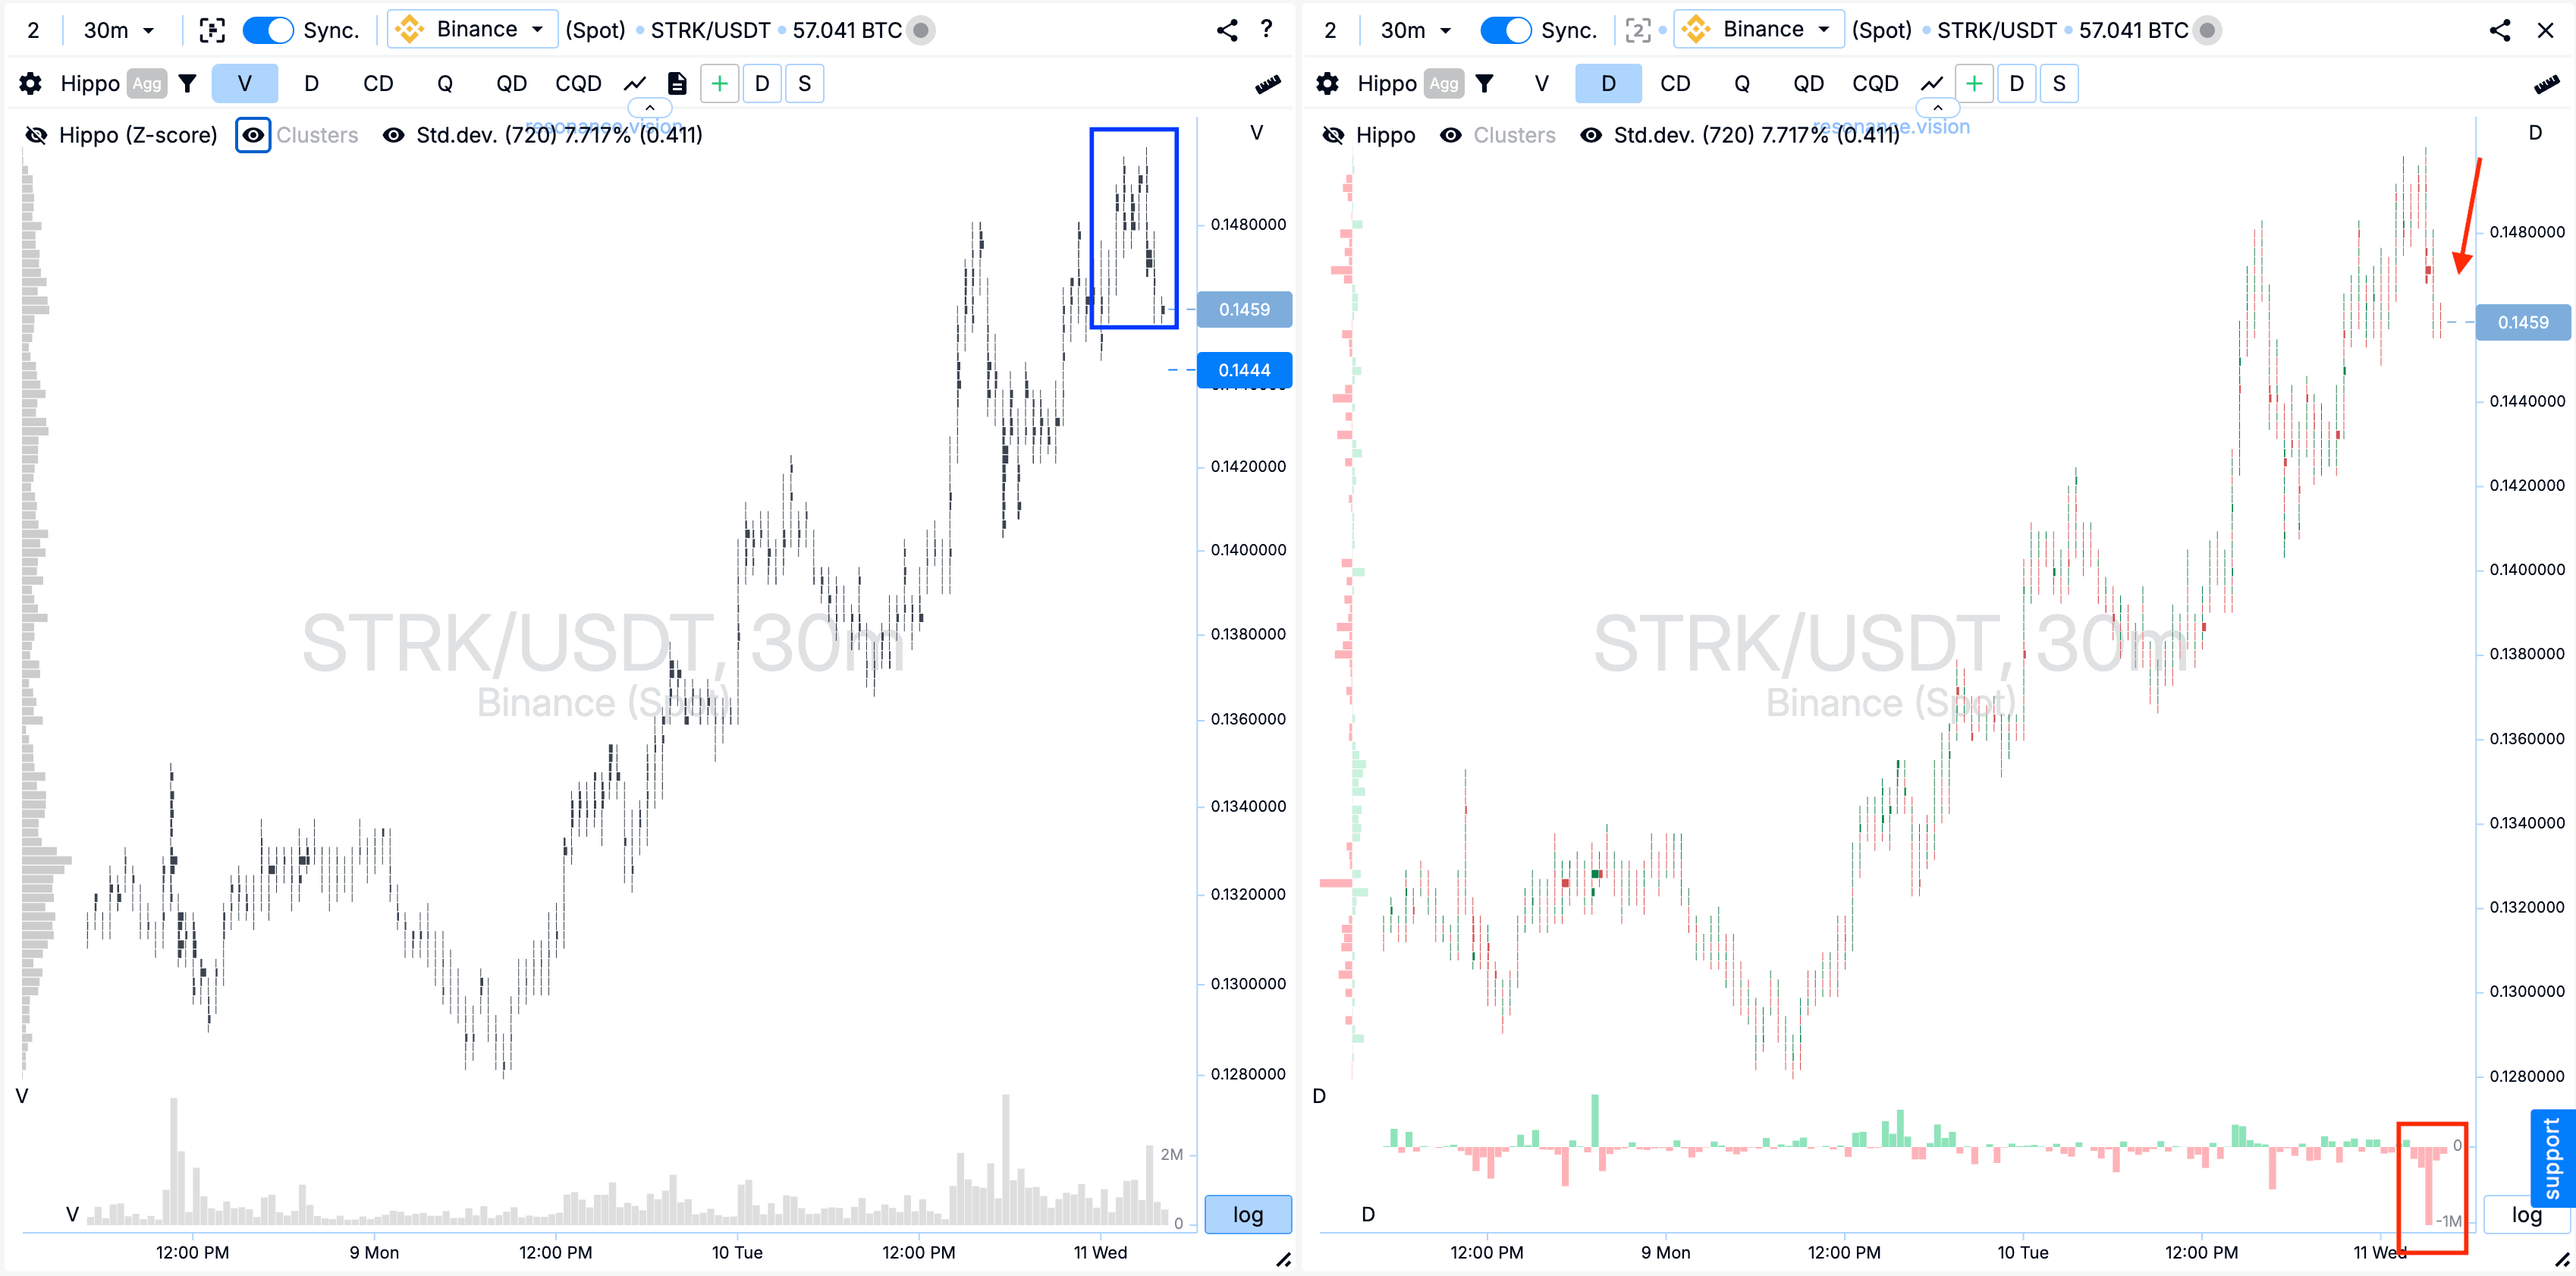
Кластерний графік: У сформованих кластерах за об’ємом (синій прямокутник) спостерігається значне збільшення об’ємів продажу, що призвело до зниження ціни. Це підтверджується гістограмою дельти, де виразно виділяються продажі (червоний прямокутник зі стрілкою).
У Дешборді
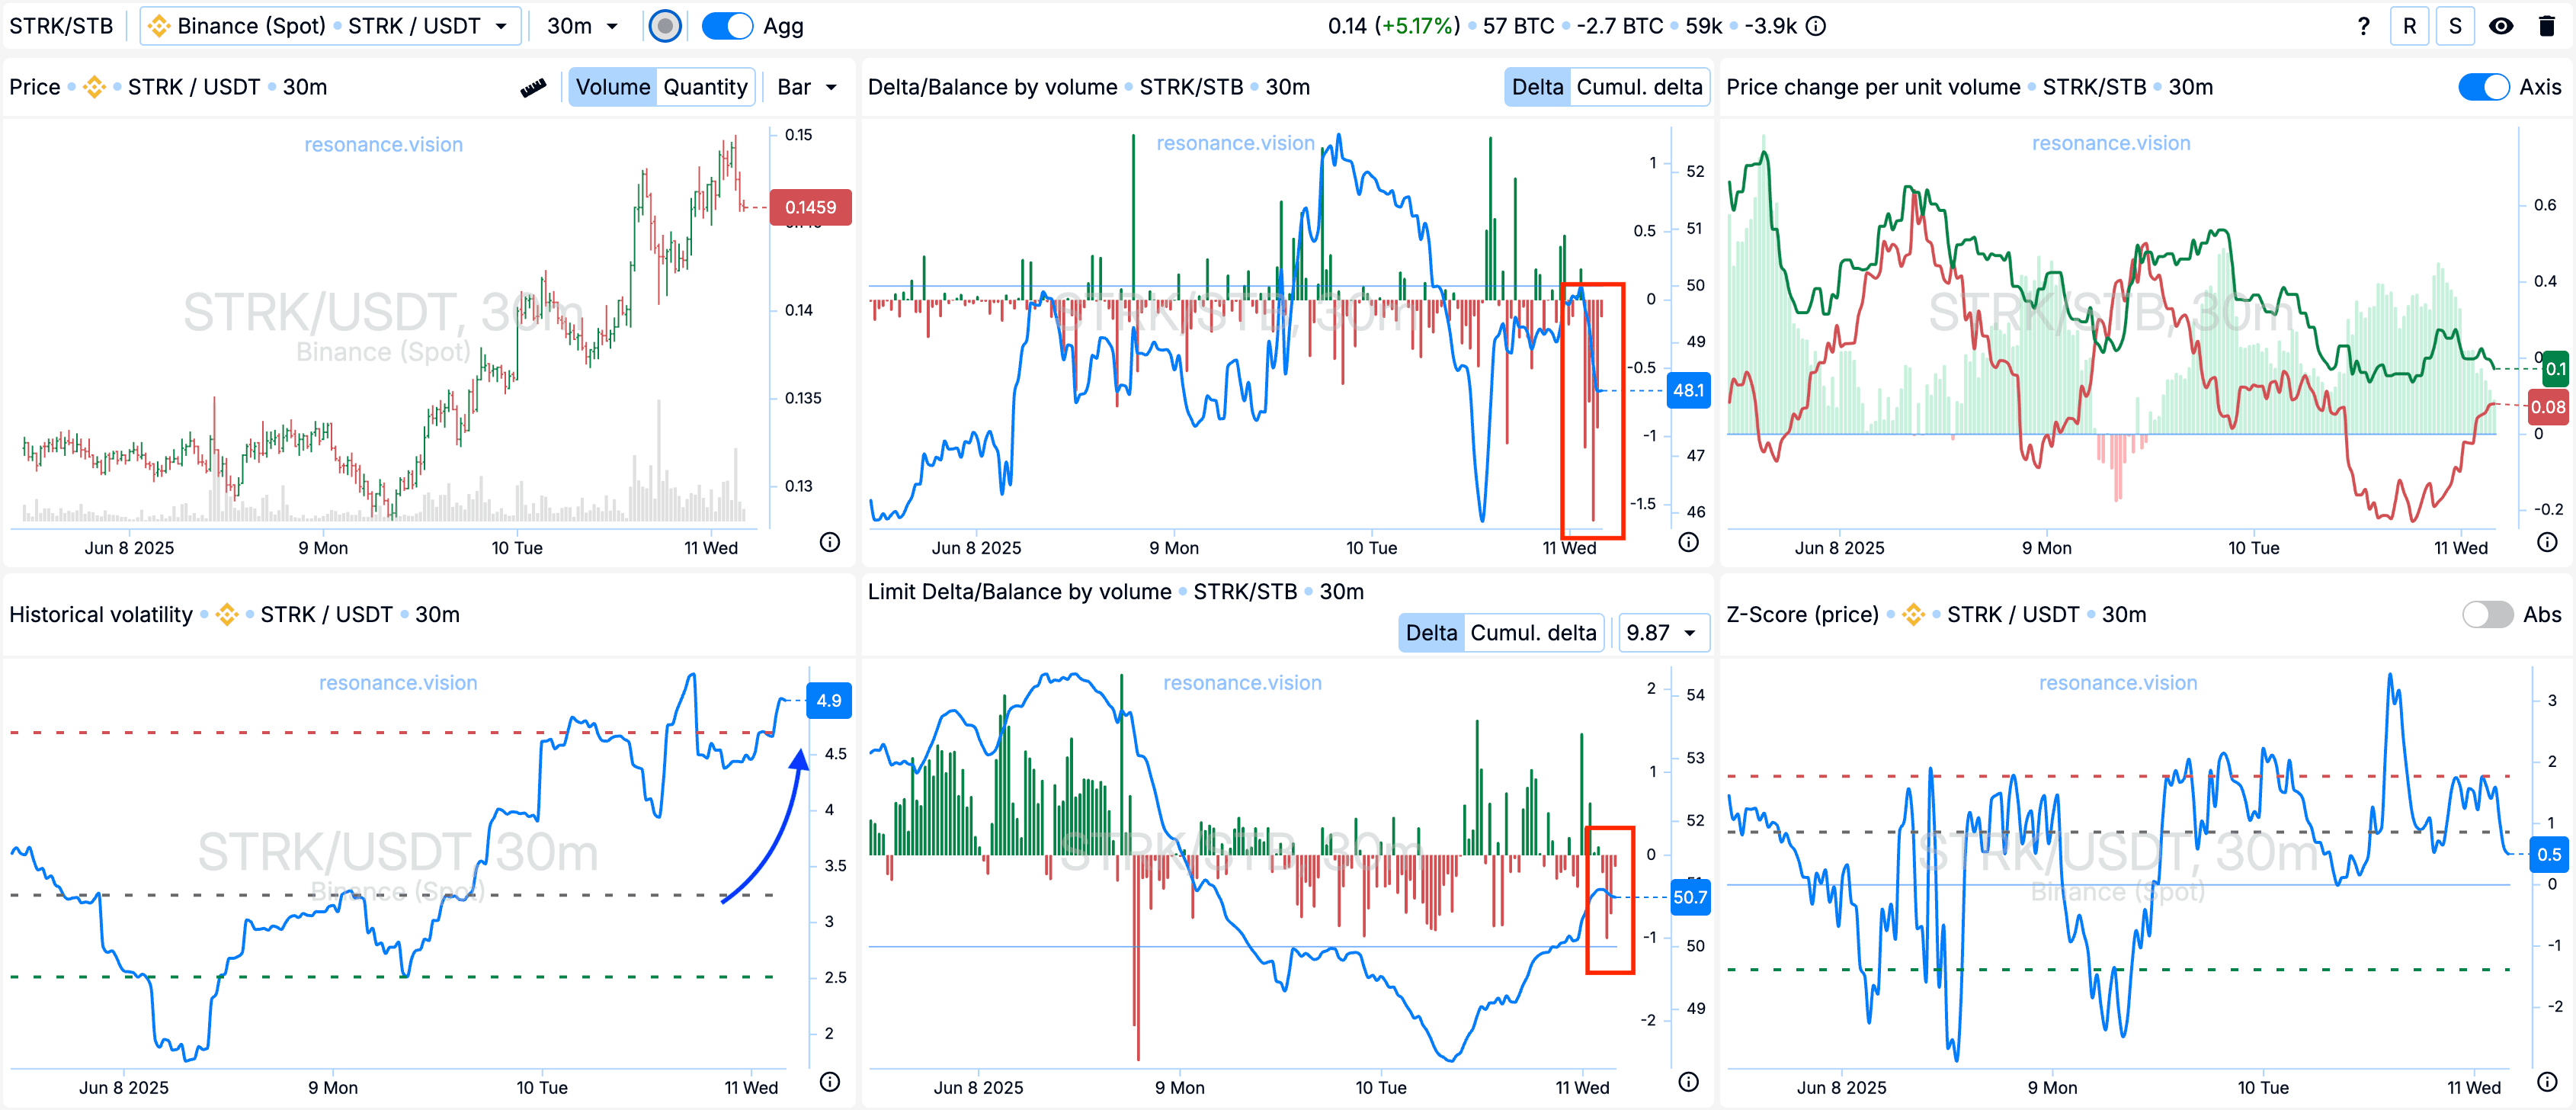
Дельта/Баланс за об’ємом та лімітна дельта: Як за ринковими ордерами, так і за лімітними заявками переважають продажі — це видно по дельті та виділено червоними прямокутниками.
Історична волатильність: Показник волатильності значно зріс і знаходиться у локально аномальних значень по персентилю (синя стрілка).
Підсумок
Вдалося зафіксувати прибуток у розмірі 208,70%.

Висновок
Наочний приклад того, як слабка реакція ціни на домінуючі ринкові продажі може сигналізувати про дефіцит, що формується. Підтримка з боку лімітних заявок та низька волатильність у момент входу створили умови для обґрунтованої точки входу в лонг. А своєчасна фіксація об’ємів та відстеження активності продавців дозволили вийти з позиції до початку розвороту.
Такий підхід, заснований на глибокому аналізі об’єму та ринкової поведінки, дає трейдеру впевненість у своїх діях та допомагає системно фіксувати прибуток.
Стеж за новими статтями у нашому телеграм каналі.
Не треба вигадувати складних схем та шукати “грааль”. Використовуйте інструменти платформи Resonance.
Реєструйся за посиланням - отримуй бонус і починай заробляти:
OKX | BingX | KuCoin.
Промокод TOPBLOG дає тобі 10% знижки на будь-який тарифний план Resonance.
Рекомендовані статті


