STRK +73.9% (Направленная стратегия Резонанс)

Обзор сделки по STRK с акцентом на поведение объёмов: где проявился локальный дефицит, как лимитные покупки сформировали поддержку и почему последующее ослабление эффективности покупателя стало сигналом к закрытию позиции. Чистая логика спроса и предложения - без лишнего шума.
Содержание

Монета: STRK/USDT
Риск: средний
Уровень понимания: новичок
Причины входа
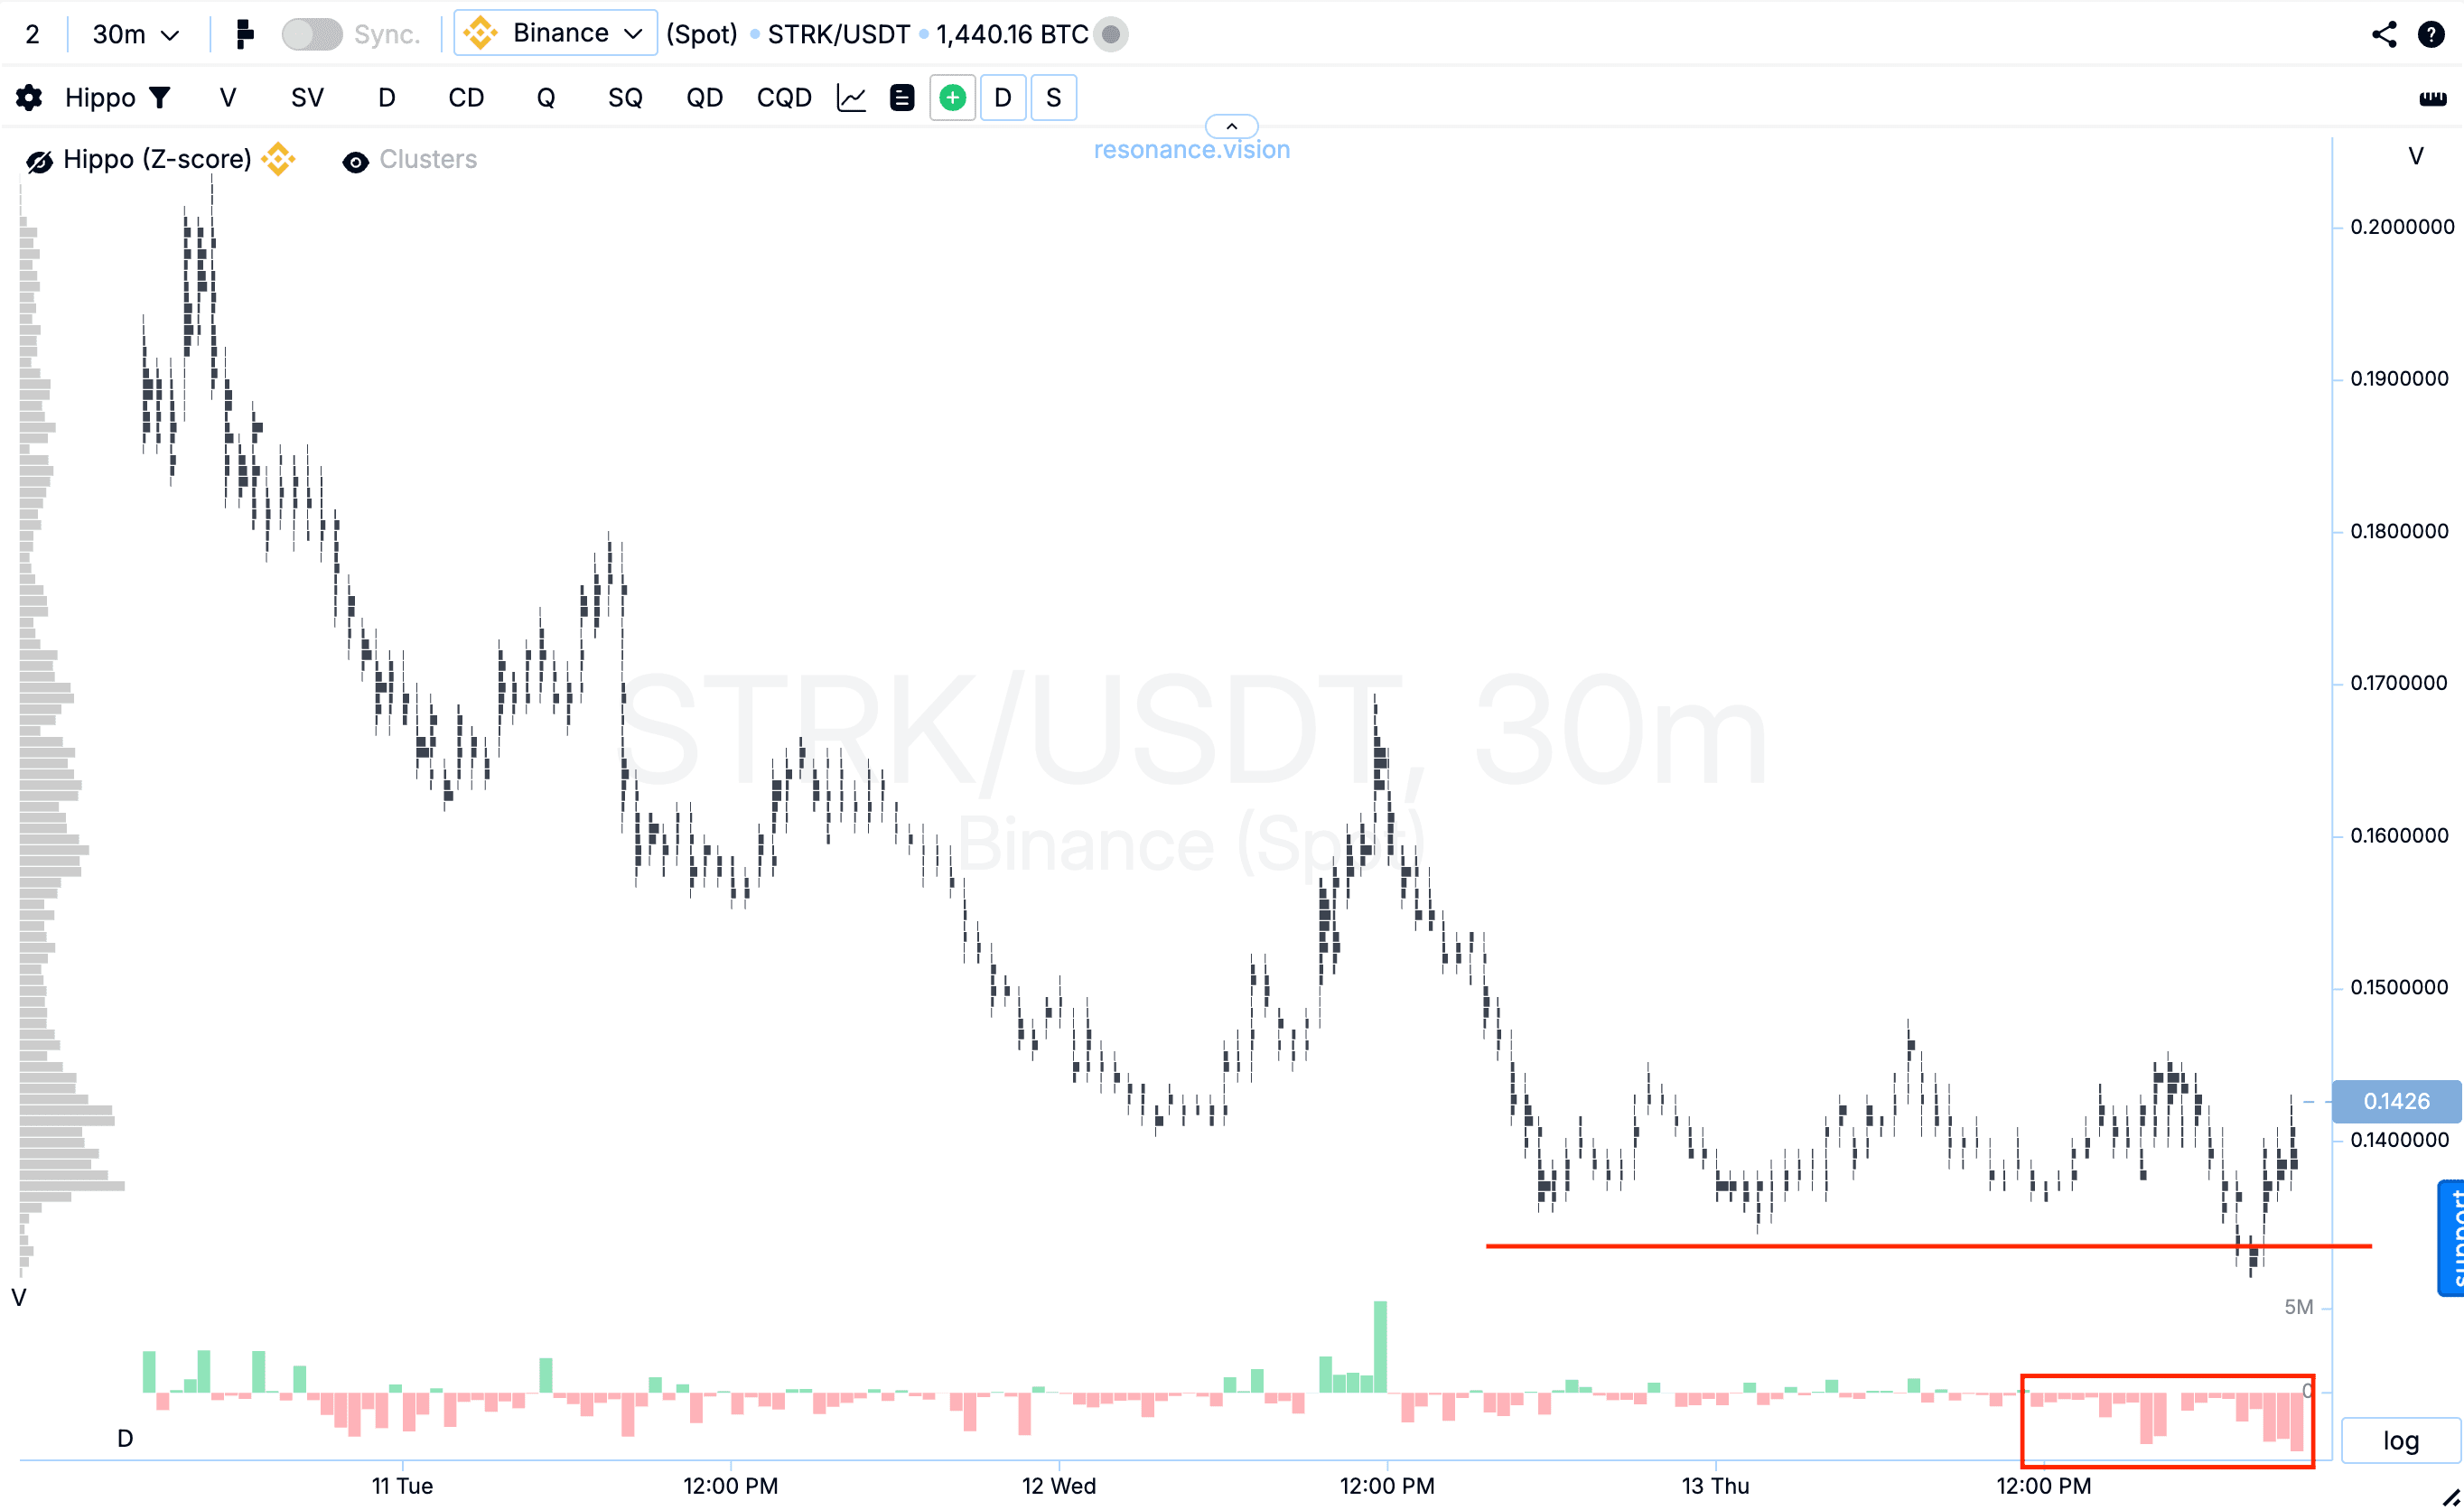
Кластерный график: на снижении начали расти объёмы продаж (красный прямоугольник), но их влияние уже ослабло - цене не удалось заметно обновить локальный минимум (красная линия). Такая реакция указывает на формирование локального дефицита и снижение силы продавцов.
В Дешборде
Дельта / Баланс по объёму и лимитная дельта: агрегированные данные по всем парам и биржам подтверждают картину, которую видно на кластерном графике. В этот период рынок был под давлением маркет-продаж - это хорошо видно по гистограмме кумулятивной дельты (красная стрелка). Однако по лимитным заявкам одновременно наблюдается заметный рост объёмов заявок на покупку (зелёная стрелка). Такая динамика показывает, что участники рынка активно лимитно принимают весь входящий объем продаж, формируя локальную поддержку и не позволяя цене снижаться дальше.

Причины выхода
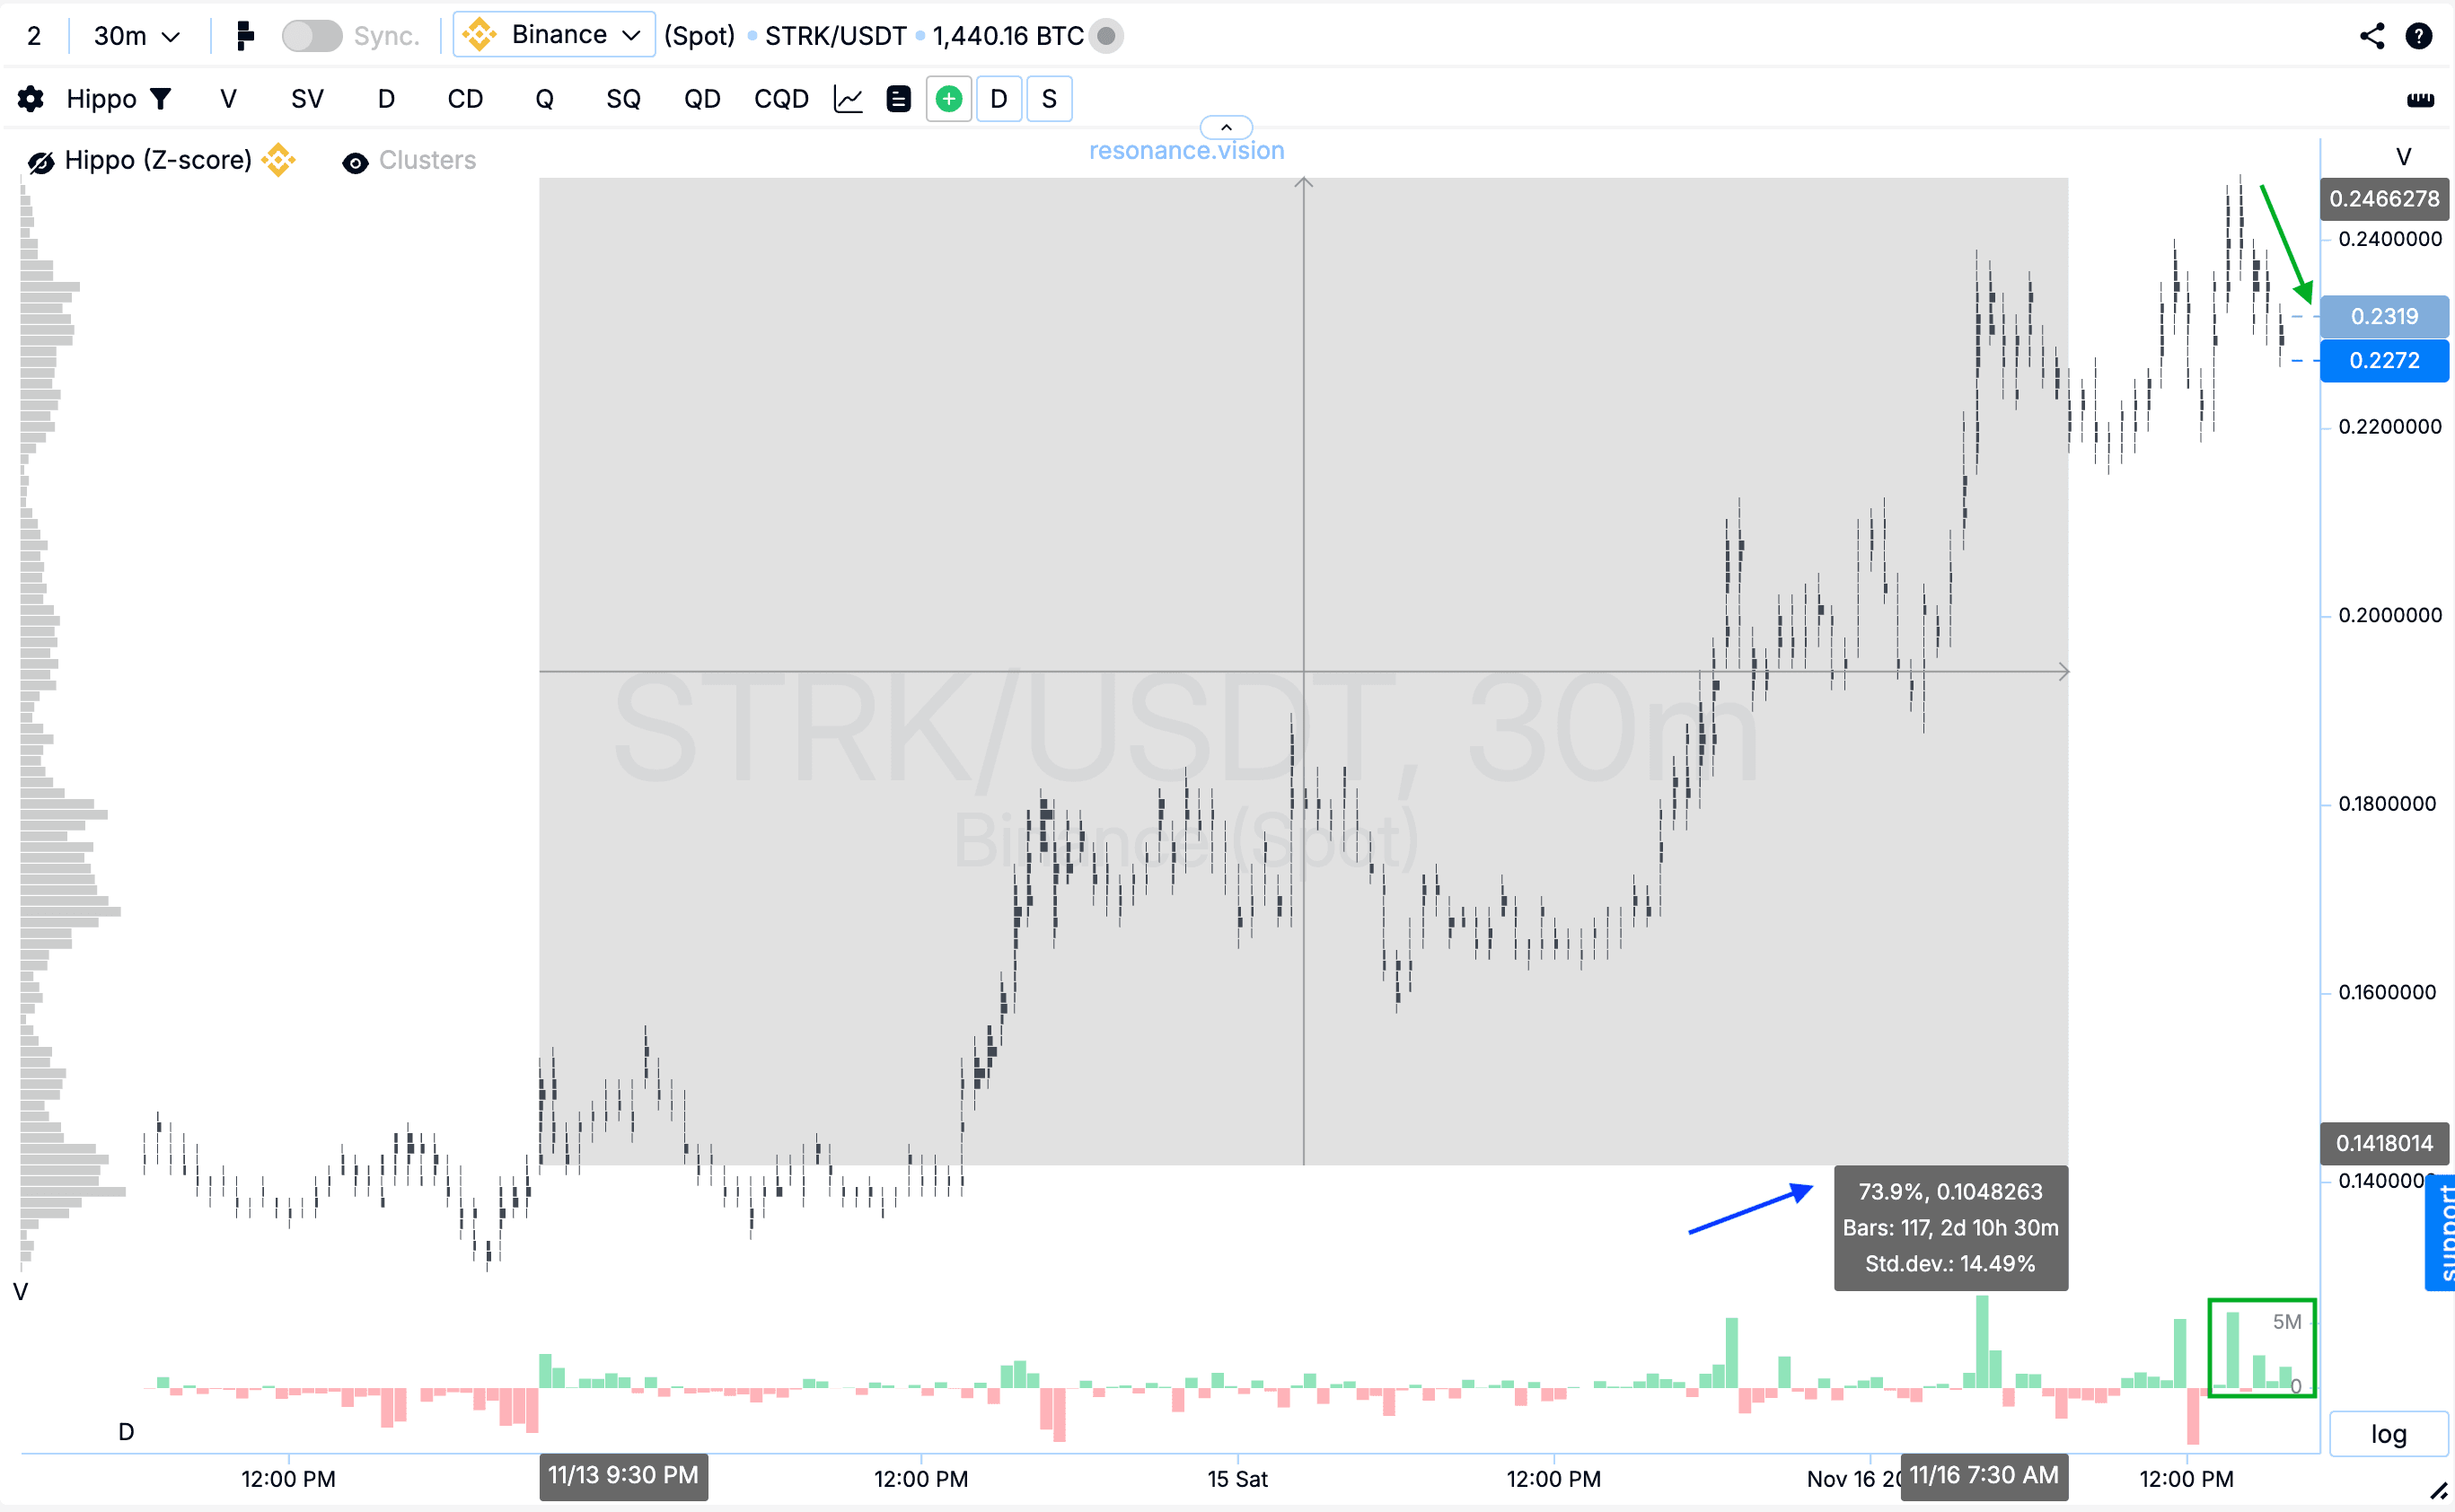
Кластерный график: от точки входа цена прошла 73,9%. Однако последующие объёмы на покупку перестали оказывать заметное влияние на цену - их эффективность снижалась, также объёмы начали сокращаться, а цена начала плавно откатывать вниз (зелёный прямоугольник и стрелка). Такая динамика указывает на формирование локального профицита, когда покупатели уже не способны продавливать цену выше. В подобных условиях закрытие позиции является наиболее взвешенным и рациональным решением.
Заключение
Ситуация по STRK развивалась достаточно интересно: мы увидели ослабление продавцов - объёмы на снижении росли, но локальный минимум существенно не был обновлён. Это дало основание предположить о формирование дефицита, что и подтвердили данные в Дешборде: продавцы давили маркетом, но участники лимитными заявками на покупупку полностью принимали объём и удерживали цену.
Однако дальше объёмы покупок сокращались, их влияние на цену ослабло, а сама цена перешла в плавный откат. Это признак локального профицита и потери эффективности покупателя.
В таких условиях продолжать держать позицию было бы неоправданно рискованно.
Следи за новыми статьями в нашем телеграм канале.
Не нужно выдумывать сложных схем и искать “грааль”. Используй инструменты платформы Resonance.
Регистрируйся по ссылке — получай бонус и начинай зарабатывать:
OKX | BingX | KuCoin.
Промокод TOPBLOG дает тебе 10% скидки на любой тарифный план Resonance.
Рекомендуемые статьи


