SUN +10.2% (Directional Strategy Resonance)

Local shortages with dominant market selling and active limit volume absorption.
Analysis of price reaction to volume, confirmation via delta, and movement registration when buyers’ effectiveness declines.
Table of contents

Asset: SUN/USDT
Risk: medium
Level of understanding: beginner
Entry reasons
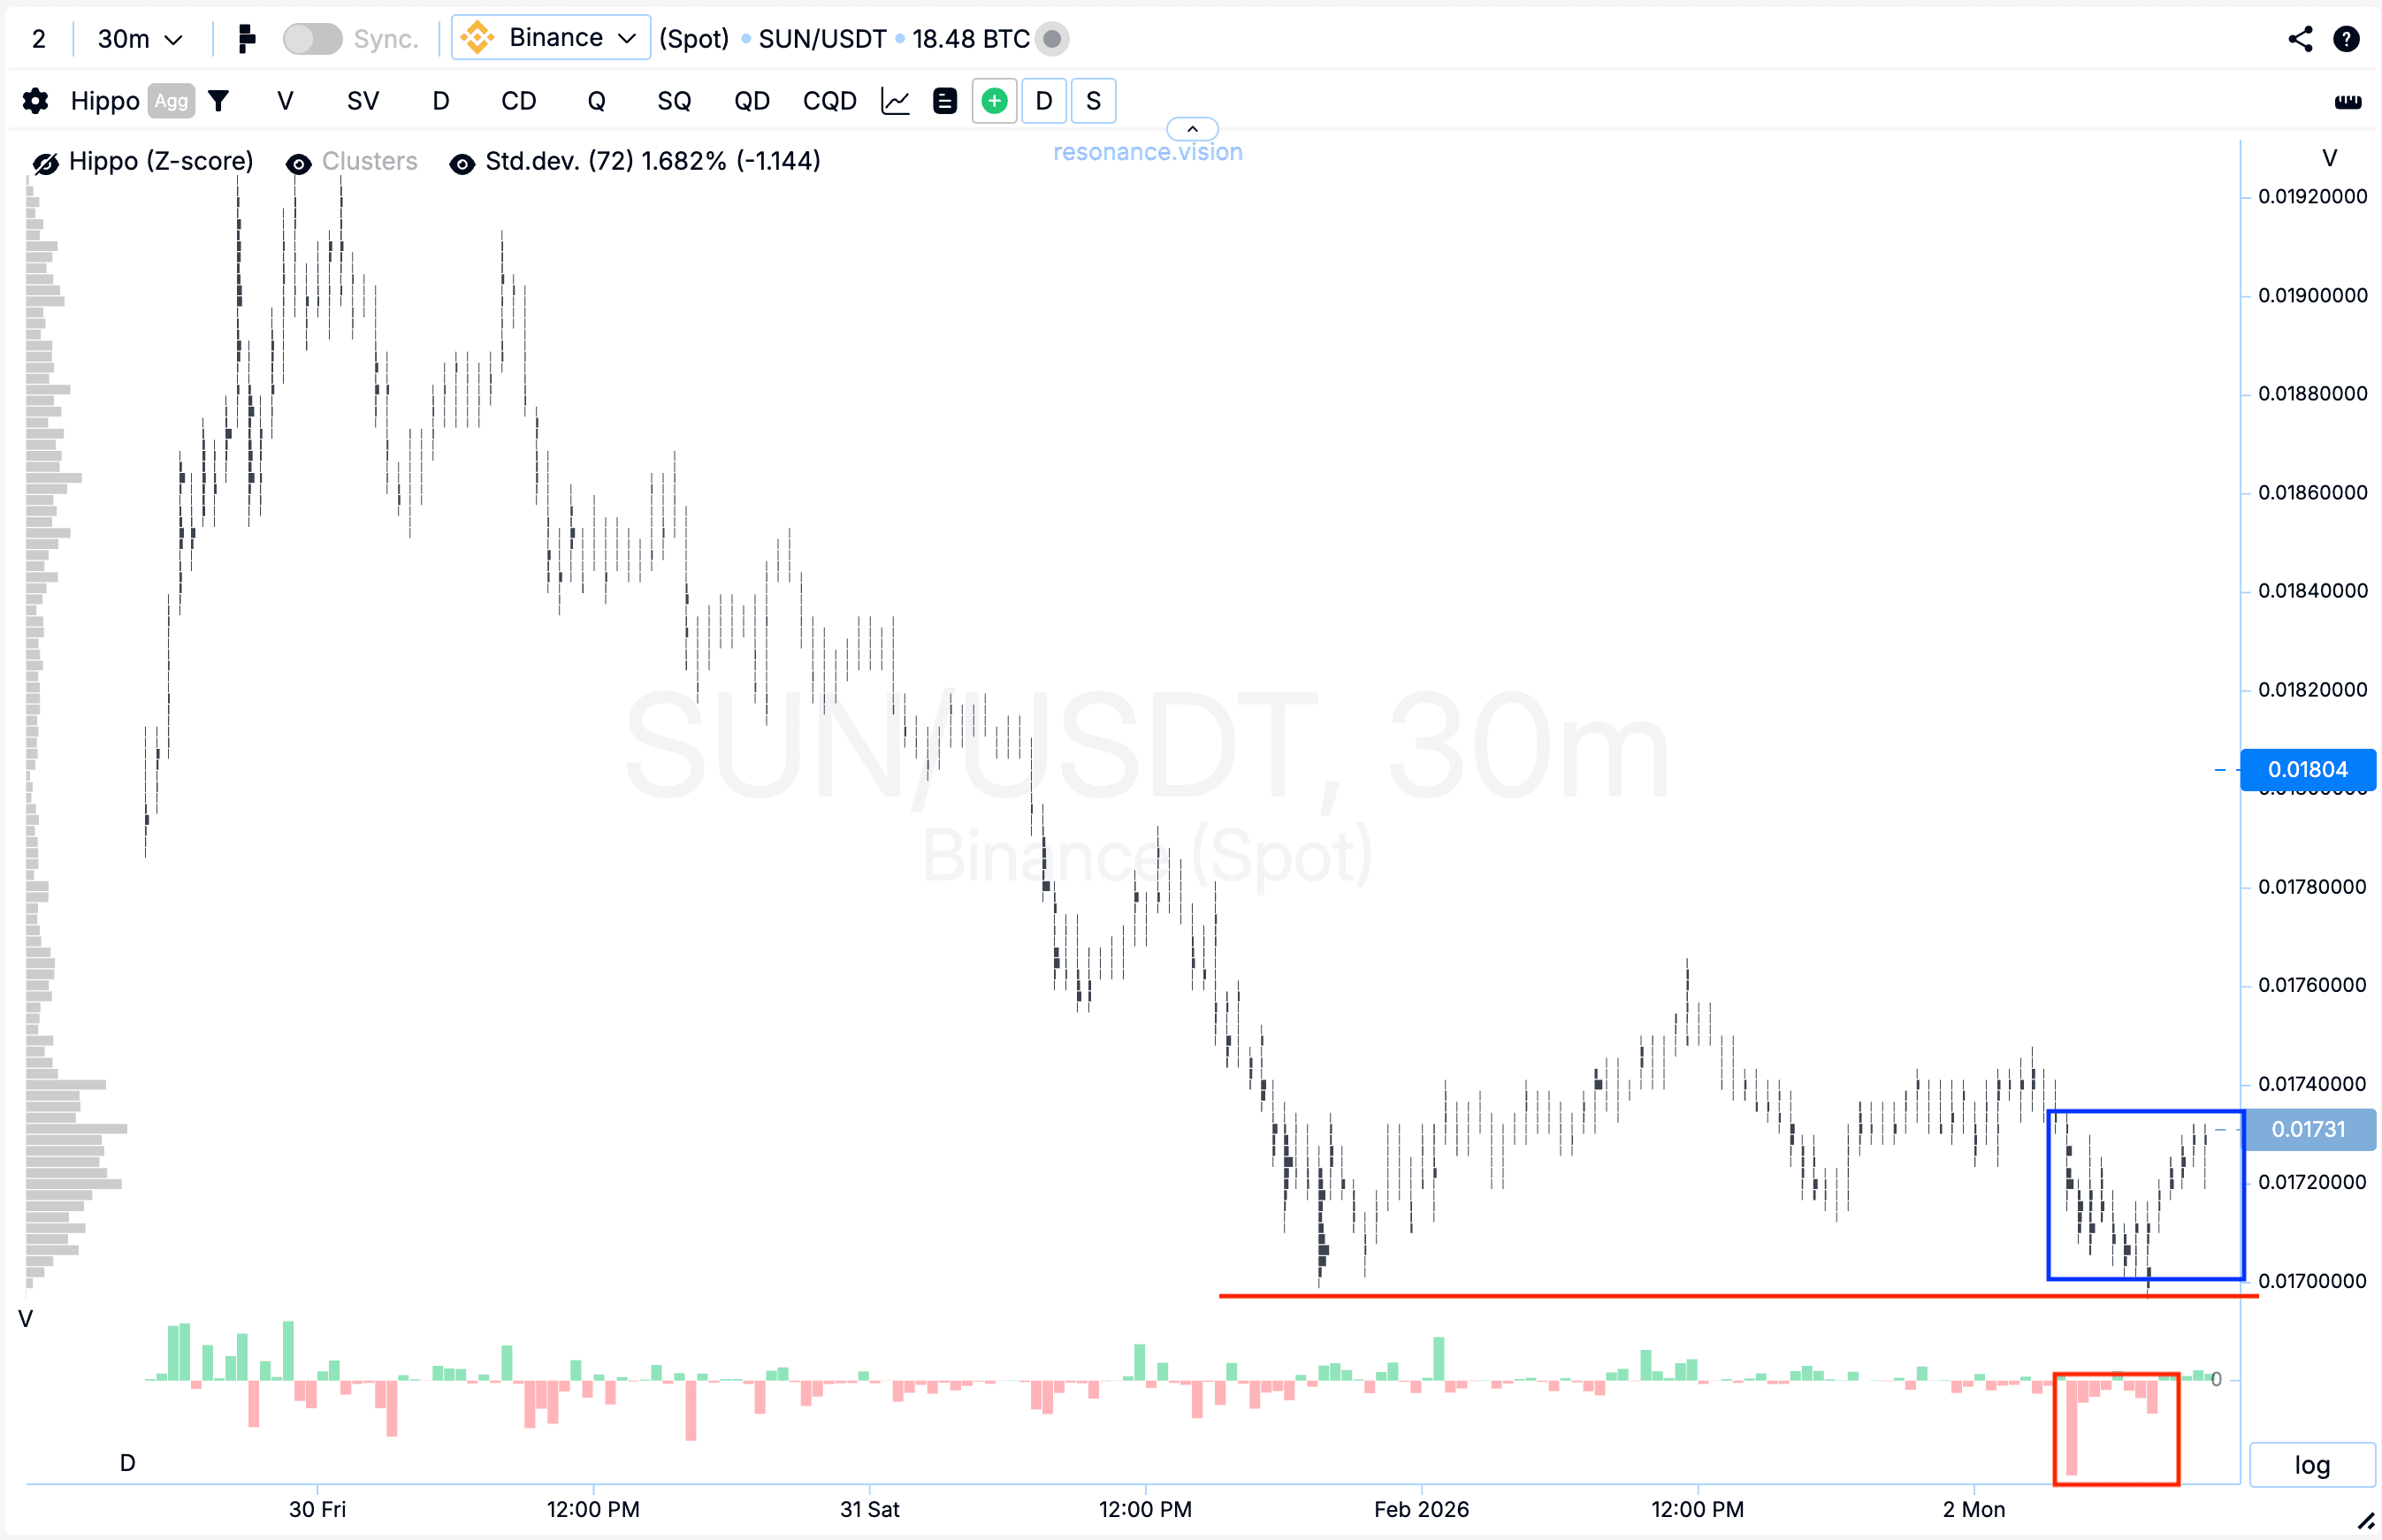
Cluster chart: within a local sideways consolidation, during a repeated attempt to move lower, large volume clusters began to form (blue rectangle). Inside these clusters, a pronounced dominance of market sell orders was observed, more significant than across the entire previously visible range (red rectangle).
However, despite the increasing pressure from sellers, the price stopped reacting with further decline and failed to update the local minimum (red line). Such market behavior indicates the presence of signs of a local deficit and a noticeable weakening in the effectiveness of sellers.
In the Dashboard
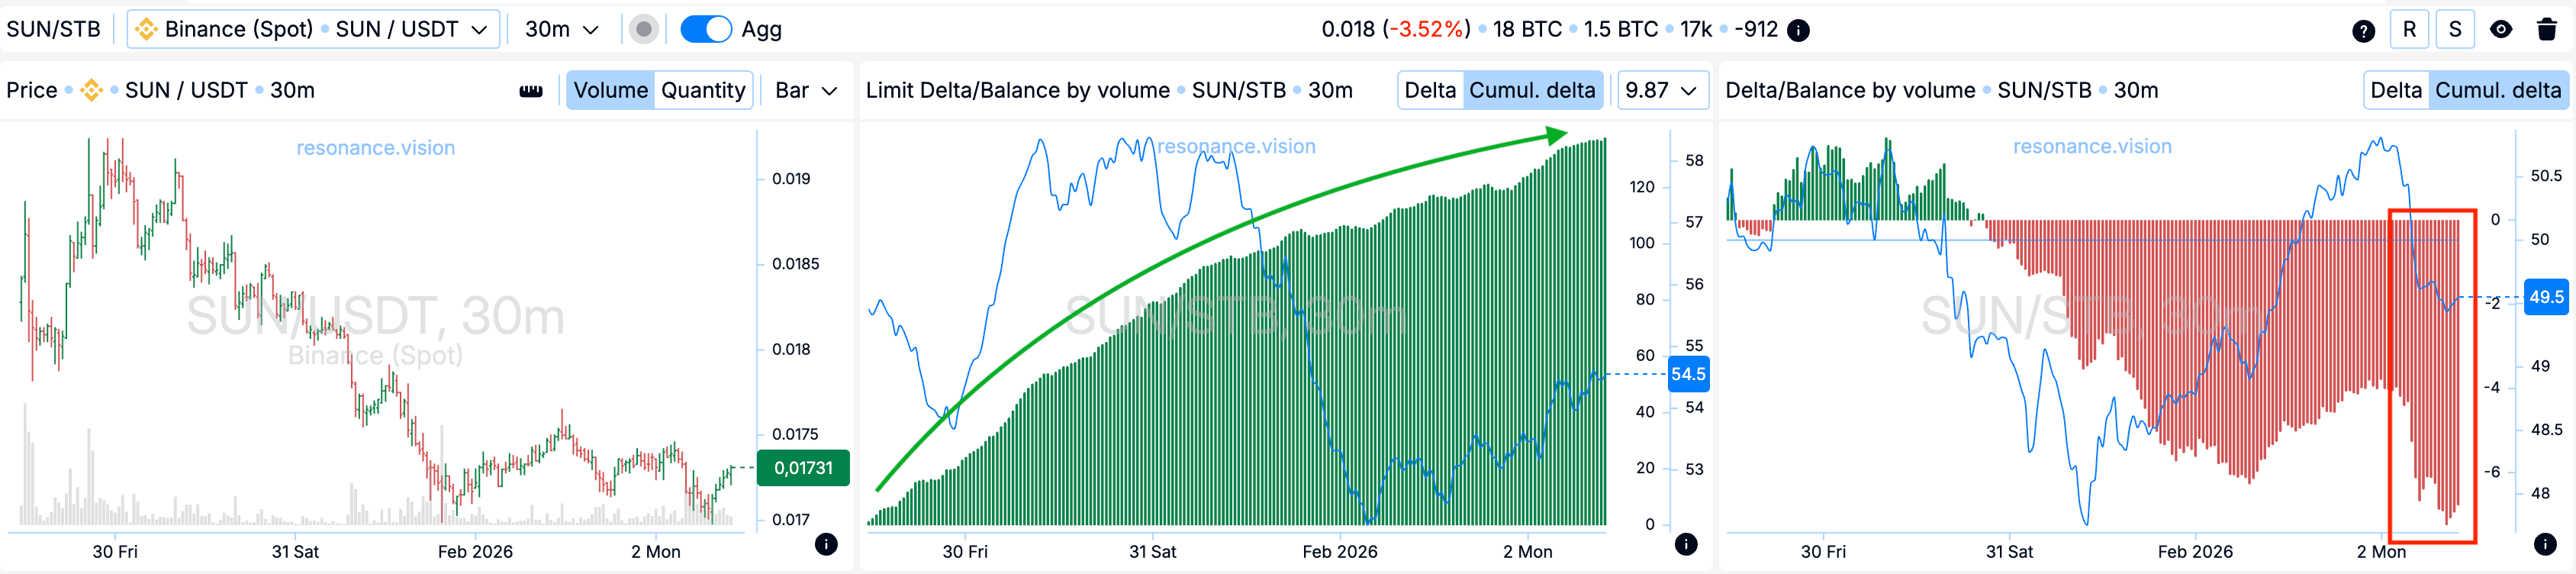
Delta / Volume balance and limit delta: aggregated data across all pairs and exchanges fully confirms the picture observed on the cluster chart. During the formation of volume clusters, the market was under strong cumulative pressure from market sell orders, which is clearly visible on the cumulative delta histogram (red rectangle).
At the same time, a cumulative increase in limit buy orders is recorded in limit orders (green arrow). This combination indicates active absorption of the entire incoming market sell volume by limit participants, forming local support and further confirming the weakening pressure from sellers.
Exit reasons
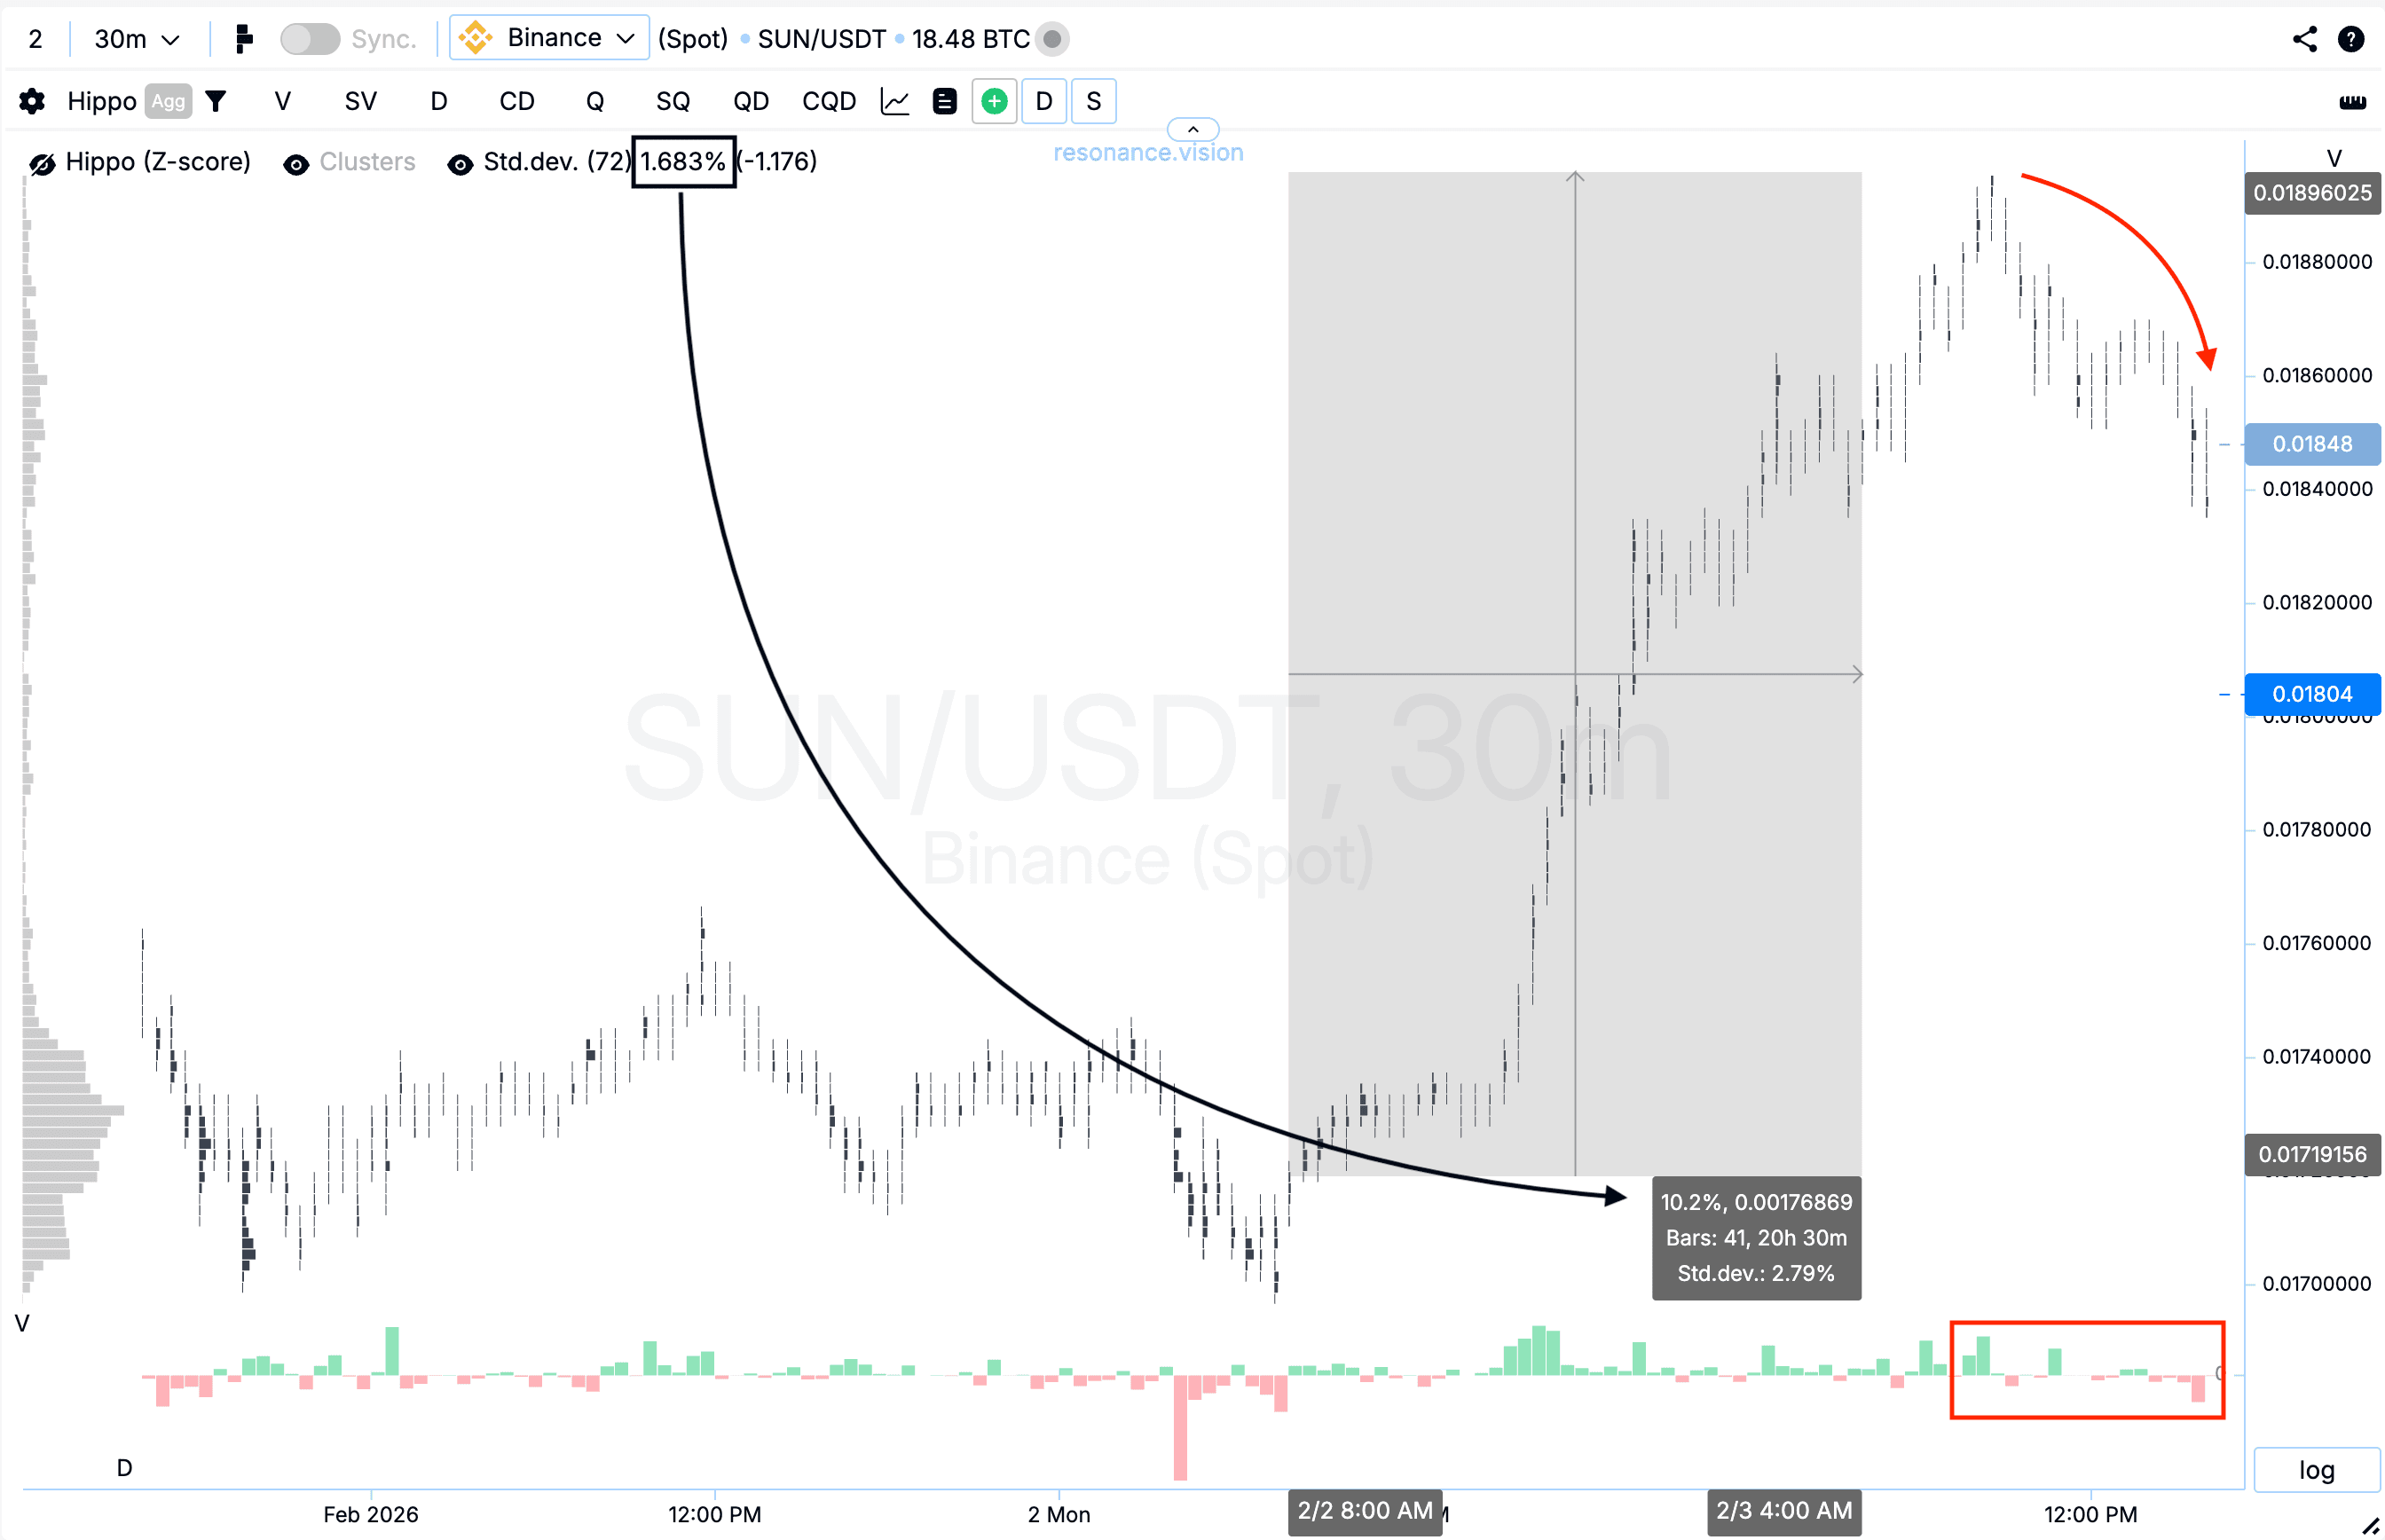
Cluster chart: from the entry point, the price increased by more than 10%, which qualifies as a significant price movement. Over a period of 72 bars of this timeframe, one standard price movement equals 1.683%, while the current movement exceeded 6 standard deviations (black rectangle and arrow).
After that, buying activity began to gradually give way to sellers, which was expressed through a sequential pullback and a shift in activity toward market sell orders (rectangle and arrow). Such dynamics indicate a decrease in buyer effectiveness and a possible transition of initiative to market sellers, making further position holding less justified from a risk perspective.
Conclusion
By assessing the impact of volume on price, as well as limit liquidity and the degree of statistical deviation, it is possible to identify truly interesting situations within day trading. The key factor here is not the volume itself, but the price reaction to it — it is this reaction that allows for an objective assessment of the effectiveness of market participants and timely trading decisions.
Follow new insights in our telegram channel.
No need to invent complex schemes and look for the "grail". Use the Resonance platform tools.
Register via the link — get a bonus and start earning:
OKX | BingX | KuCoin.
Promo code TOPBLOG gives you a 10% discount on any Resonance tariff plan.
Recommended articles


