T +33% (Направленная стратегия Резонанс)

В этом разборе мы подробно рассмотрим, как на фоне преобладания рыночных продаж сформировался локальный дефицит, что дало основание для открытия позиции. Покажем, как читать кластера и дельту, где искать признаки неэффективности участников и на каком этапе стоит фиксировать прибыль. Подчеркнём ключевые сигналы на вход и выход, включая важность оценки стандартных движений и поведения цены при объёмных ордерах.
Содержание

Монета: T/USDT
Риск: средний
Уровень понимания: новичок
Причины входа
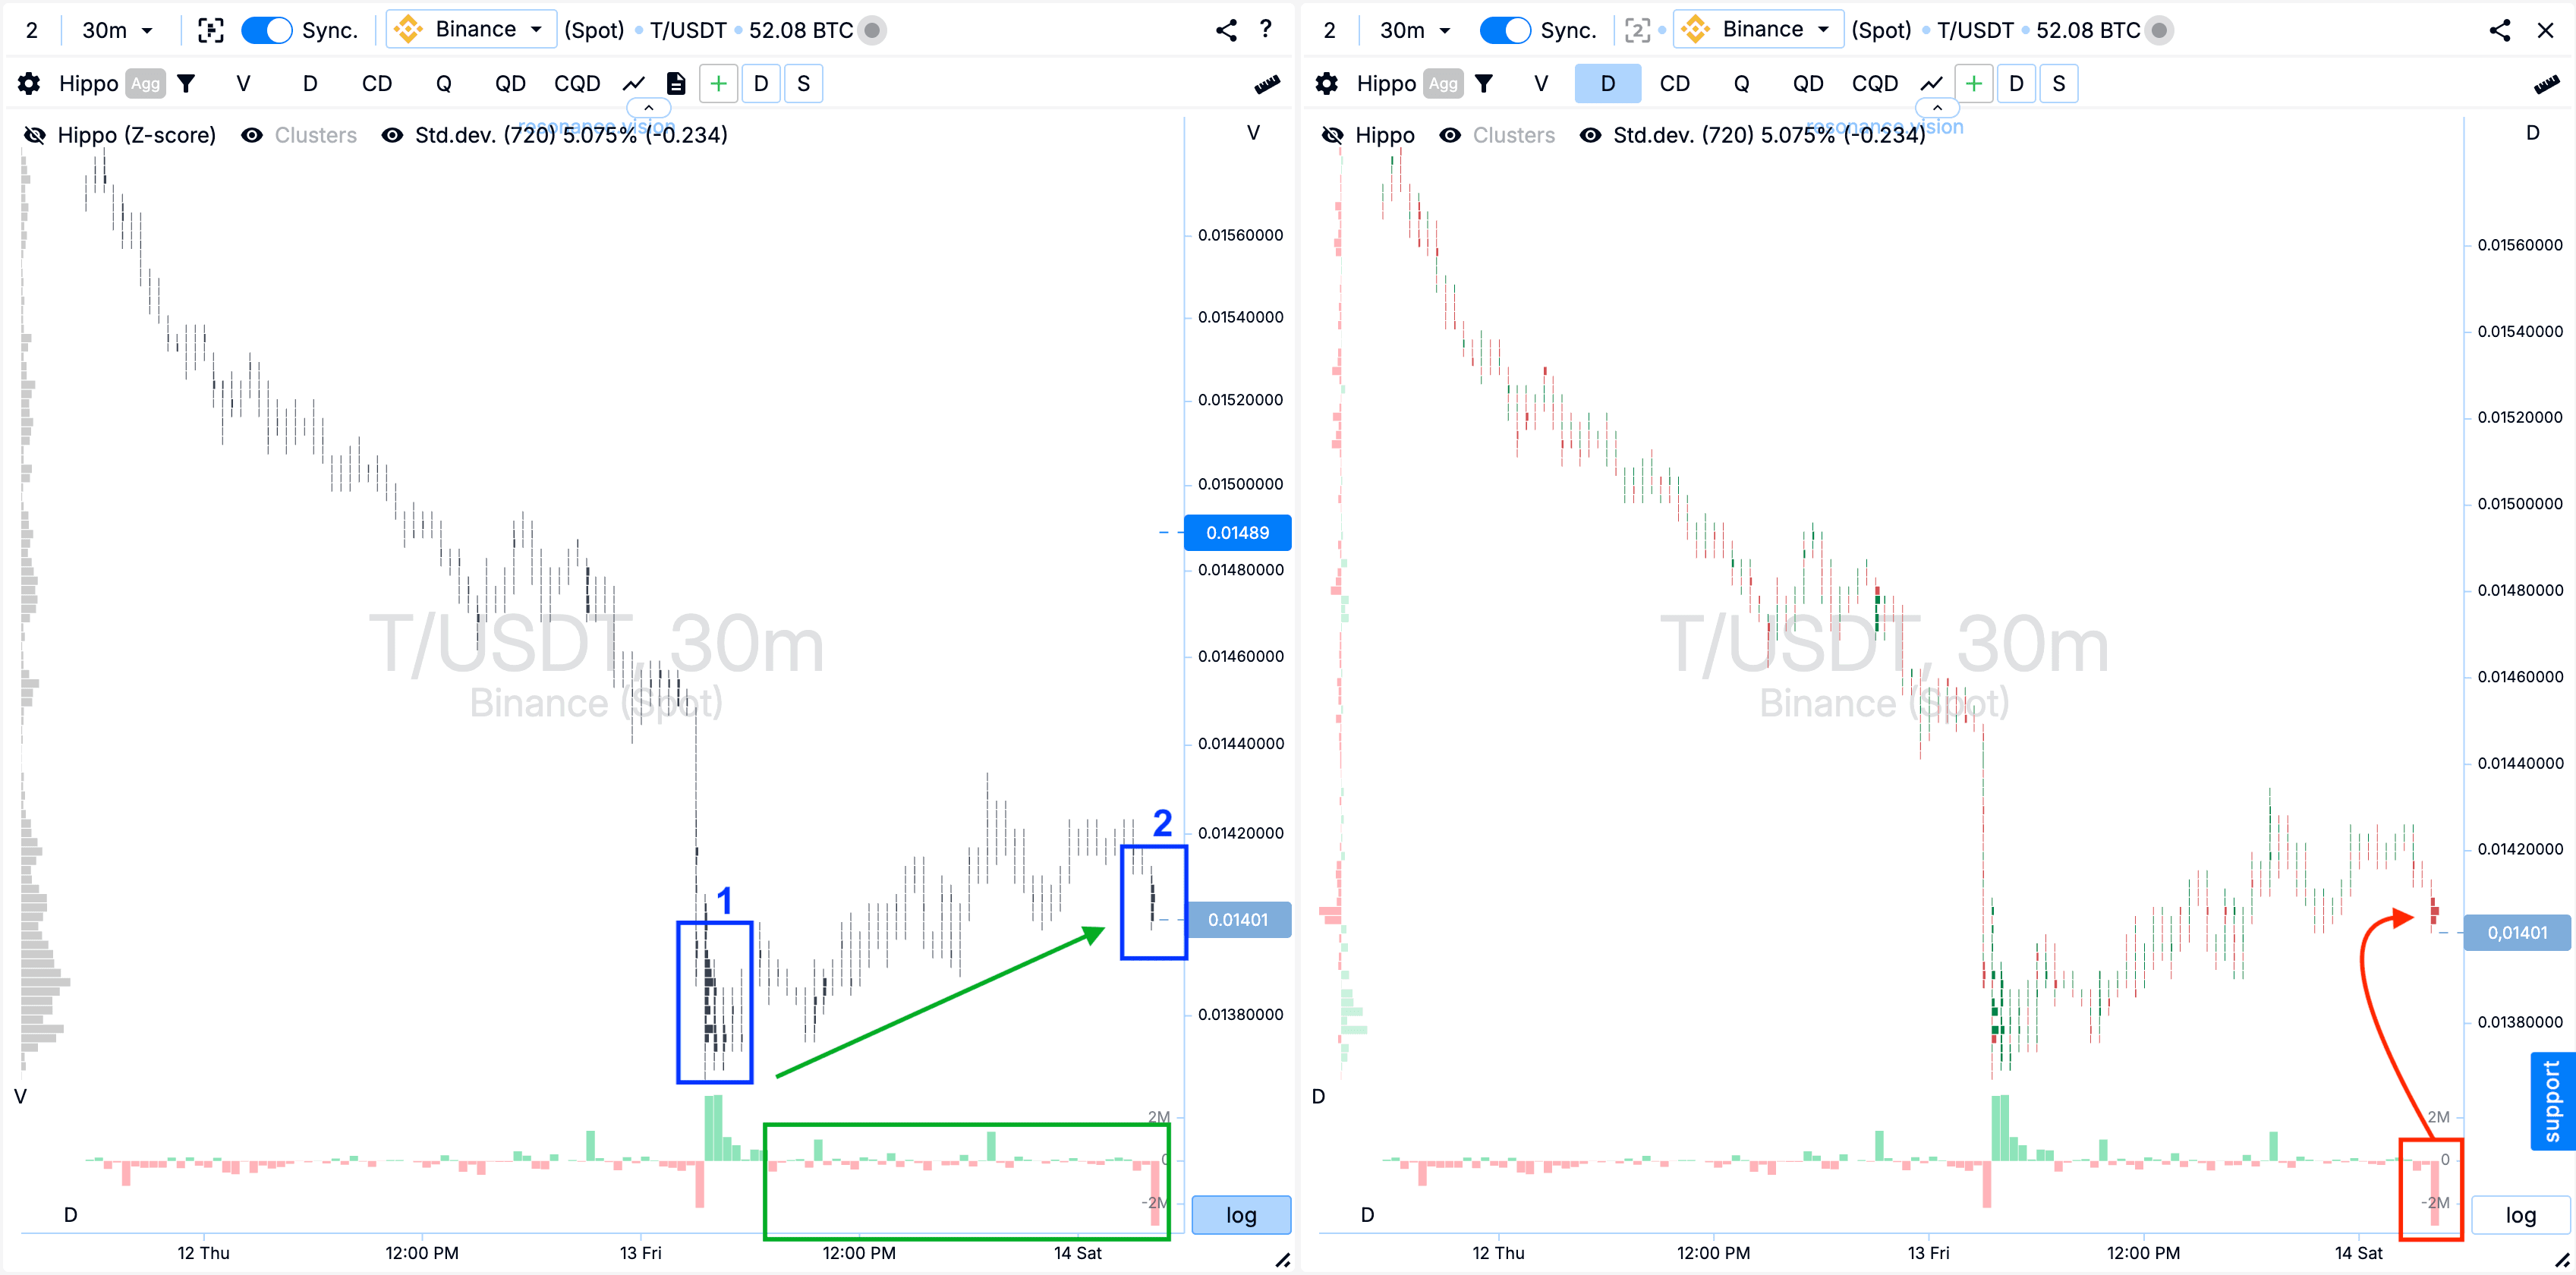
Кластерный график: В прямоугольнике №1 — после импульсного снижения сформировались кластера по объёму, где продажи постепенно сменились на объёмные покупки. При этом, несмотря на то, что бары дельты чаще отрицательные, цена постепенно растет (зеленый прямоугольник и стрелка), что говорит о неэффективности продавцов.
В ценовом диапазоне прямоугольника №2 — повторно появились кластера по объёму, и здесь наблюдается преобладание рыночных продаж (красный прямоугольник со стрелкой), которые, однако, не привели к заметному снижению цены.
В Дешборде
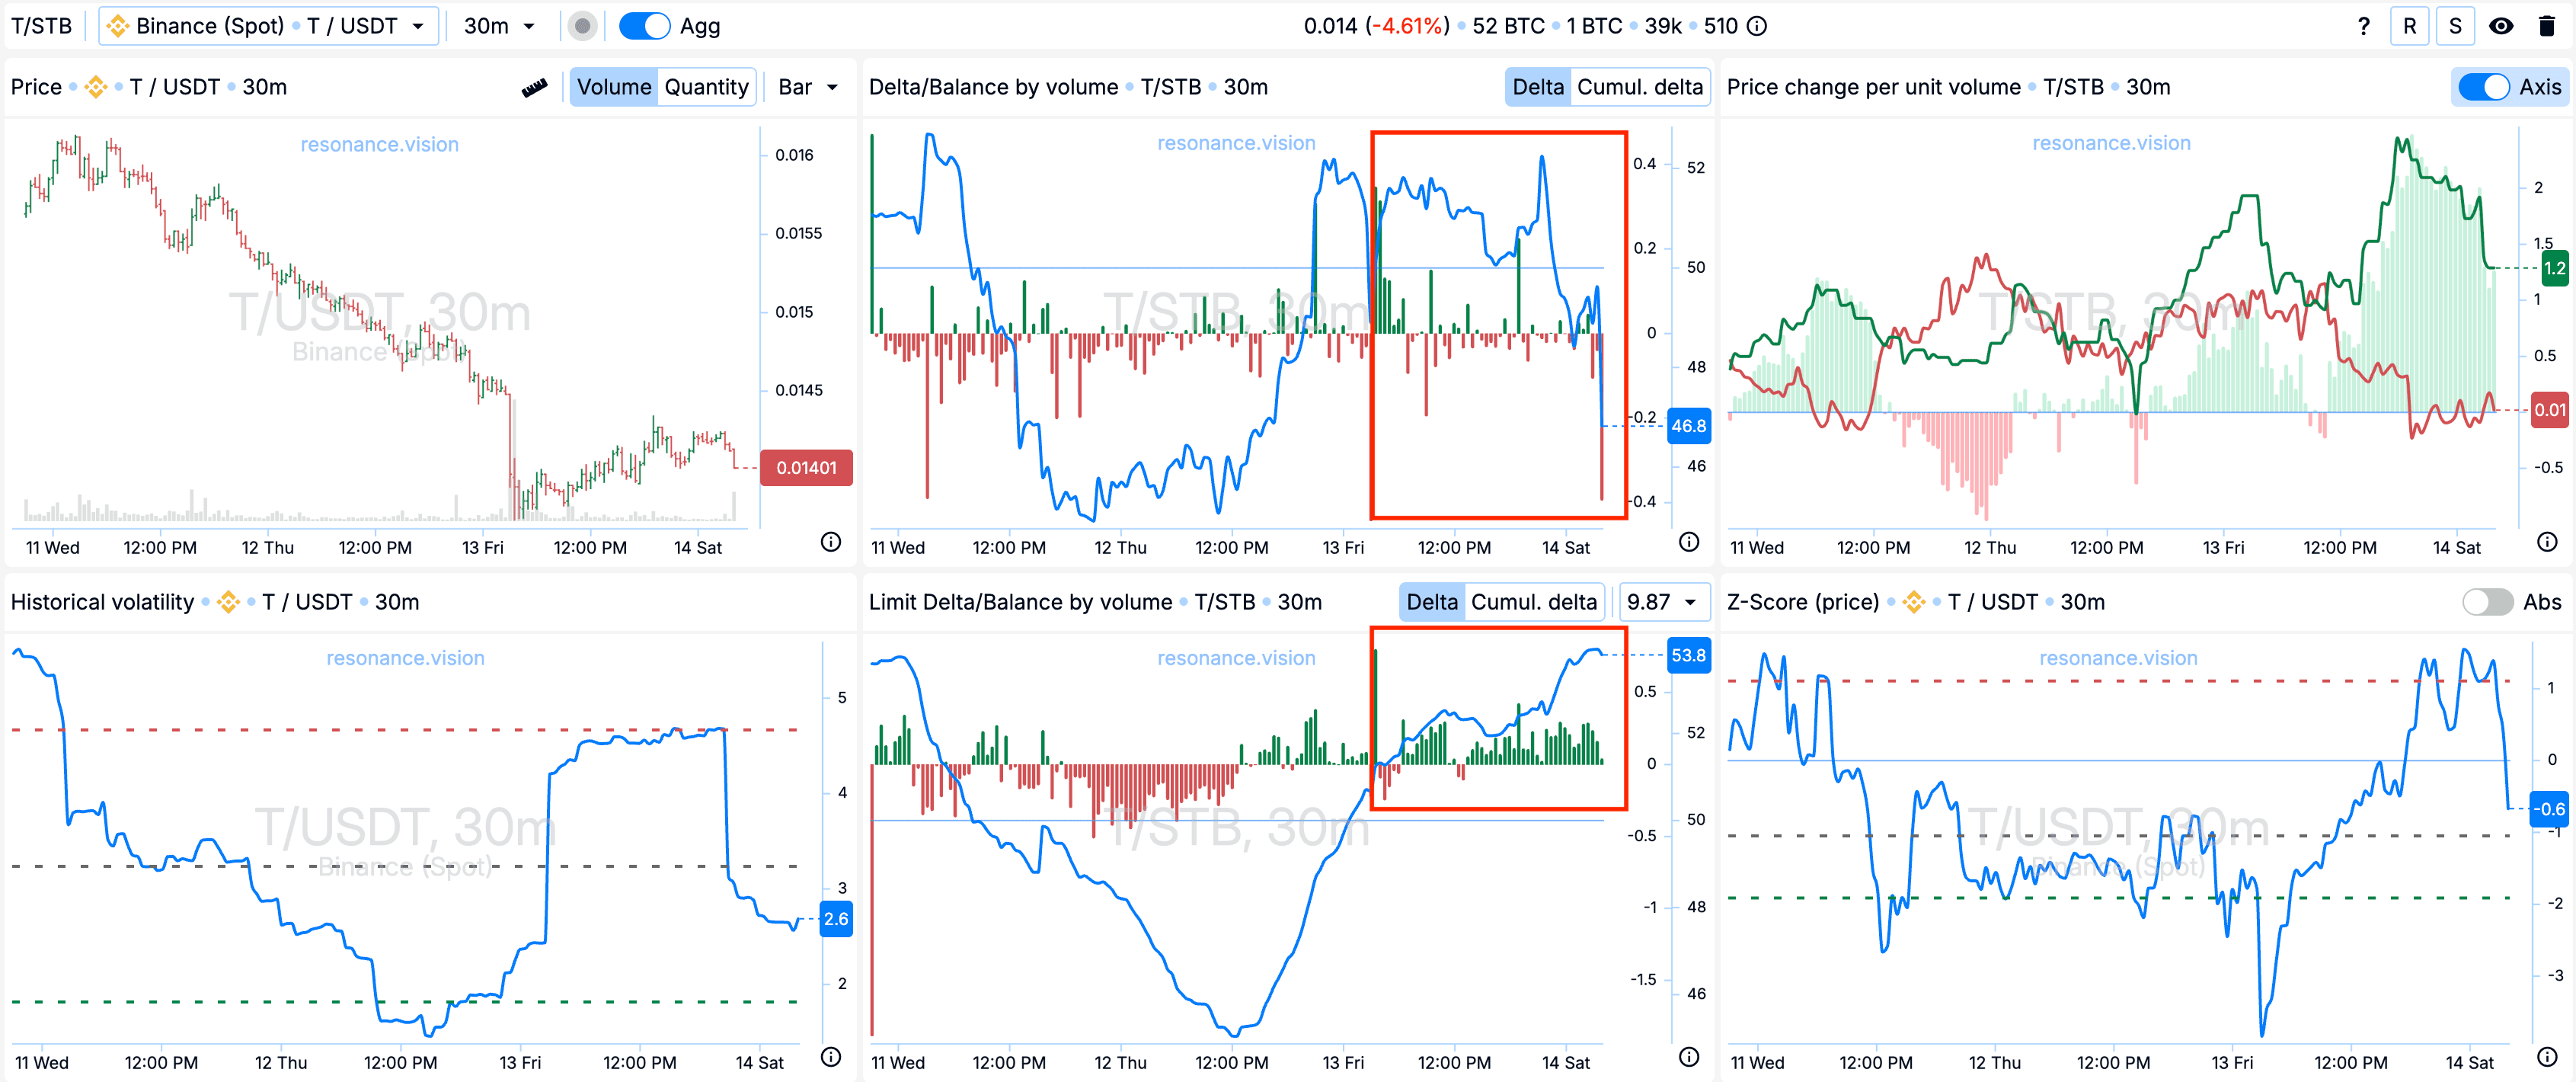
Дельта/Баланс по объему и лимитная дельта: Согласно агрегированным данным, с момента импульсного снижения баланс по рыночным ордерам продолжает смещаться вниз, что указывает на преобладание продаж. Однако по лимитным заявкам наблюдается противоположная картина — баланс смещается вверх. Это может свидетельствовать о формирующемся локальном дефиците, поскольку лимитные заявки эффективно поглощают рыночные продажи.
Причины выхода
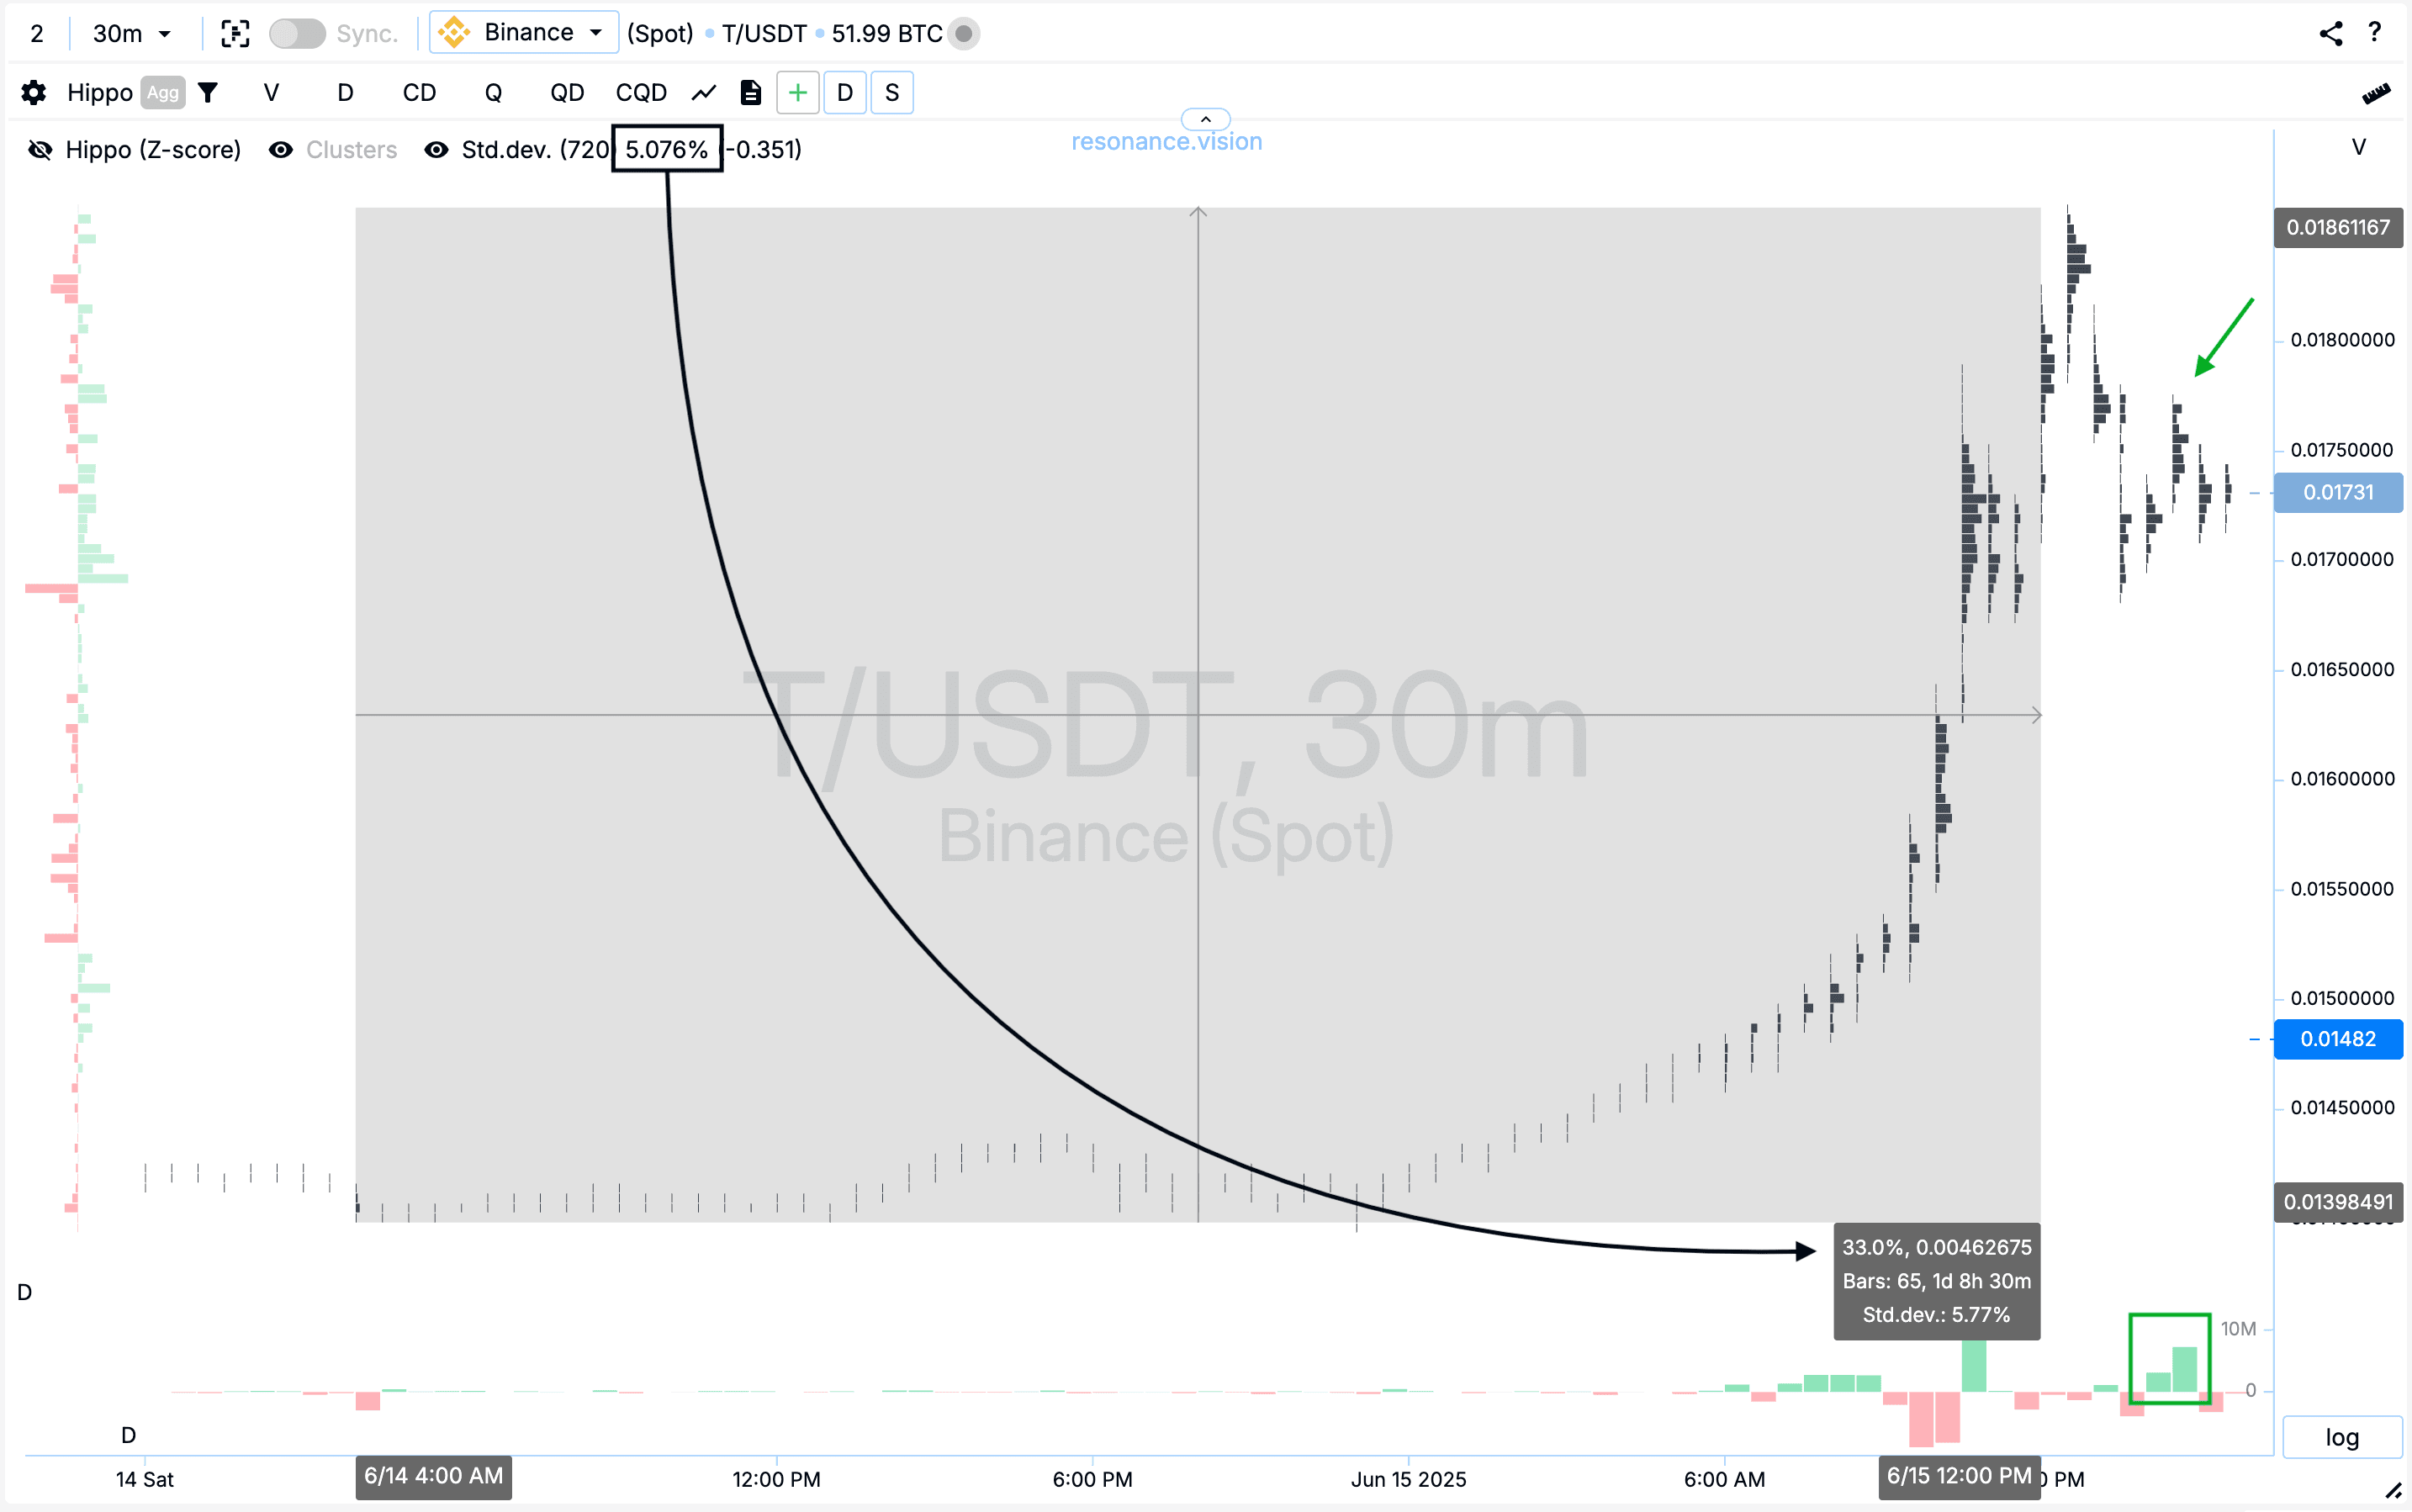
Кластерный график: Ценовое движение составило 33%, при том что одно стандартное движение для данного актива составляет 5,076%. Это более чем 6,5 стандартных отклонений — аномальное и значительное движение.
Также отметил повторные рыночные покупки, которые уже не приводят к дальнейшему росту цены (прямоугольник со стрелкой), что может указывать на ослабление инициативы со стороны покупателей.
Заключение
Удалось чётко отследить поведение участников рынка: несмотря на доминирование рыночных продаж, цена стабилизировалась и начала расти — это стало сигналом о формировании локального дефицита. Удержание при последующих активных продажах подтвердило наличие спроса и дало основание для входа в позицию.
На выходе ситуация изменилась: после сильного ценового импульса повторные покупки перестали приводить к дальнейшему росту, что указывало на ослабление спроса и снижение его эффективности.
Этот разбор подчёркивает, насколько важно комплексно анализировать объём, дельту и влияние объема на цену, для принятия взвешенных торговых решений.
Следи за новыми статьями в нашем телеграм канале.
Не нужно выдумывать сложных схем и искать “грааль”. Используй инструменты платформы Resonance.
Регистрируйся по ссылке — получай бонус и начинай зарабатывать:
OKX | BingX | KuCoin.
Промокод TOPBLOG дает тебе 10% скидки на любой тарифный план Resonance.
Рекомендуемые статьи


