TNSR +377.41% (Resonance Directional Strategy)

How to recognize buyer weakness before a reversal?
This analysis of the TNSR/USDT trade shows how the price failed to update the maximum despite active purchases - this is a key signal that is worth paying attention to.
🔍 What’s inside:
M-shaped formation and volume on clusters
Signs of market surplus
Abnormal values by Z-Score
Limit support as an exit trigger
Result: +377.41% profit with a systematic approach to volume and behavior of market participants.
Table of contents

Coin: TNSR/USDT
Risk: low
Understanding level: beginner
Reasons to enter
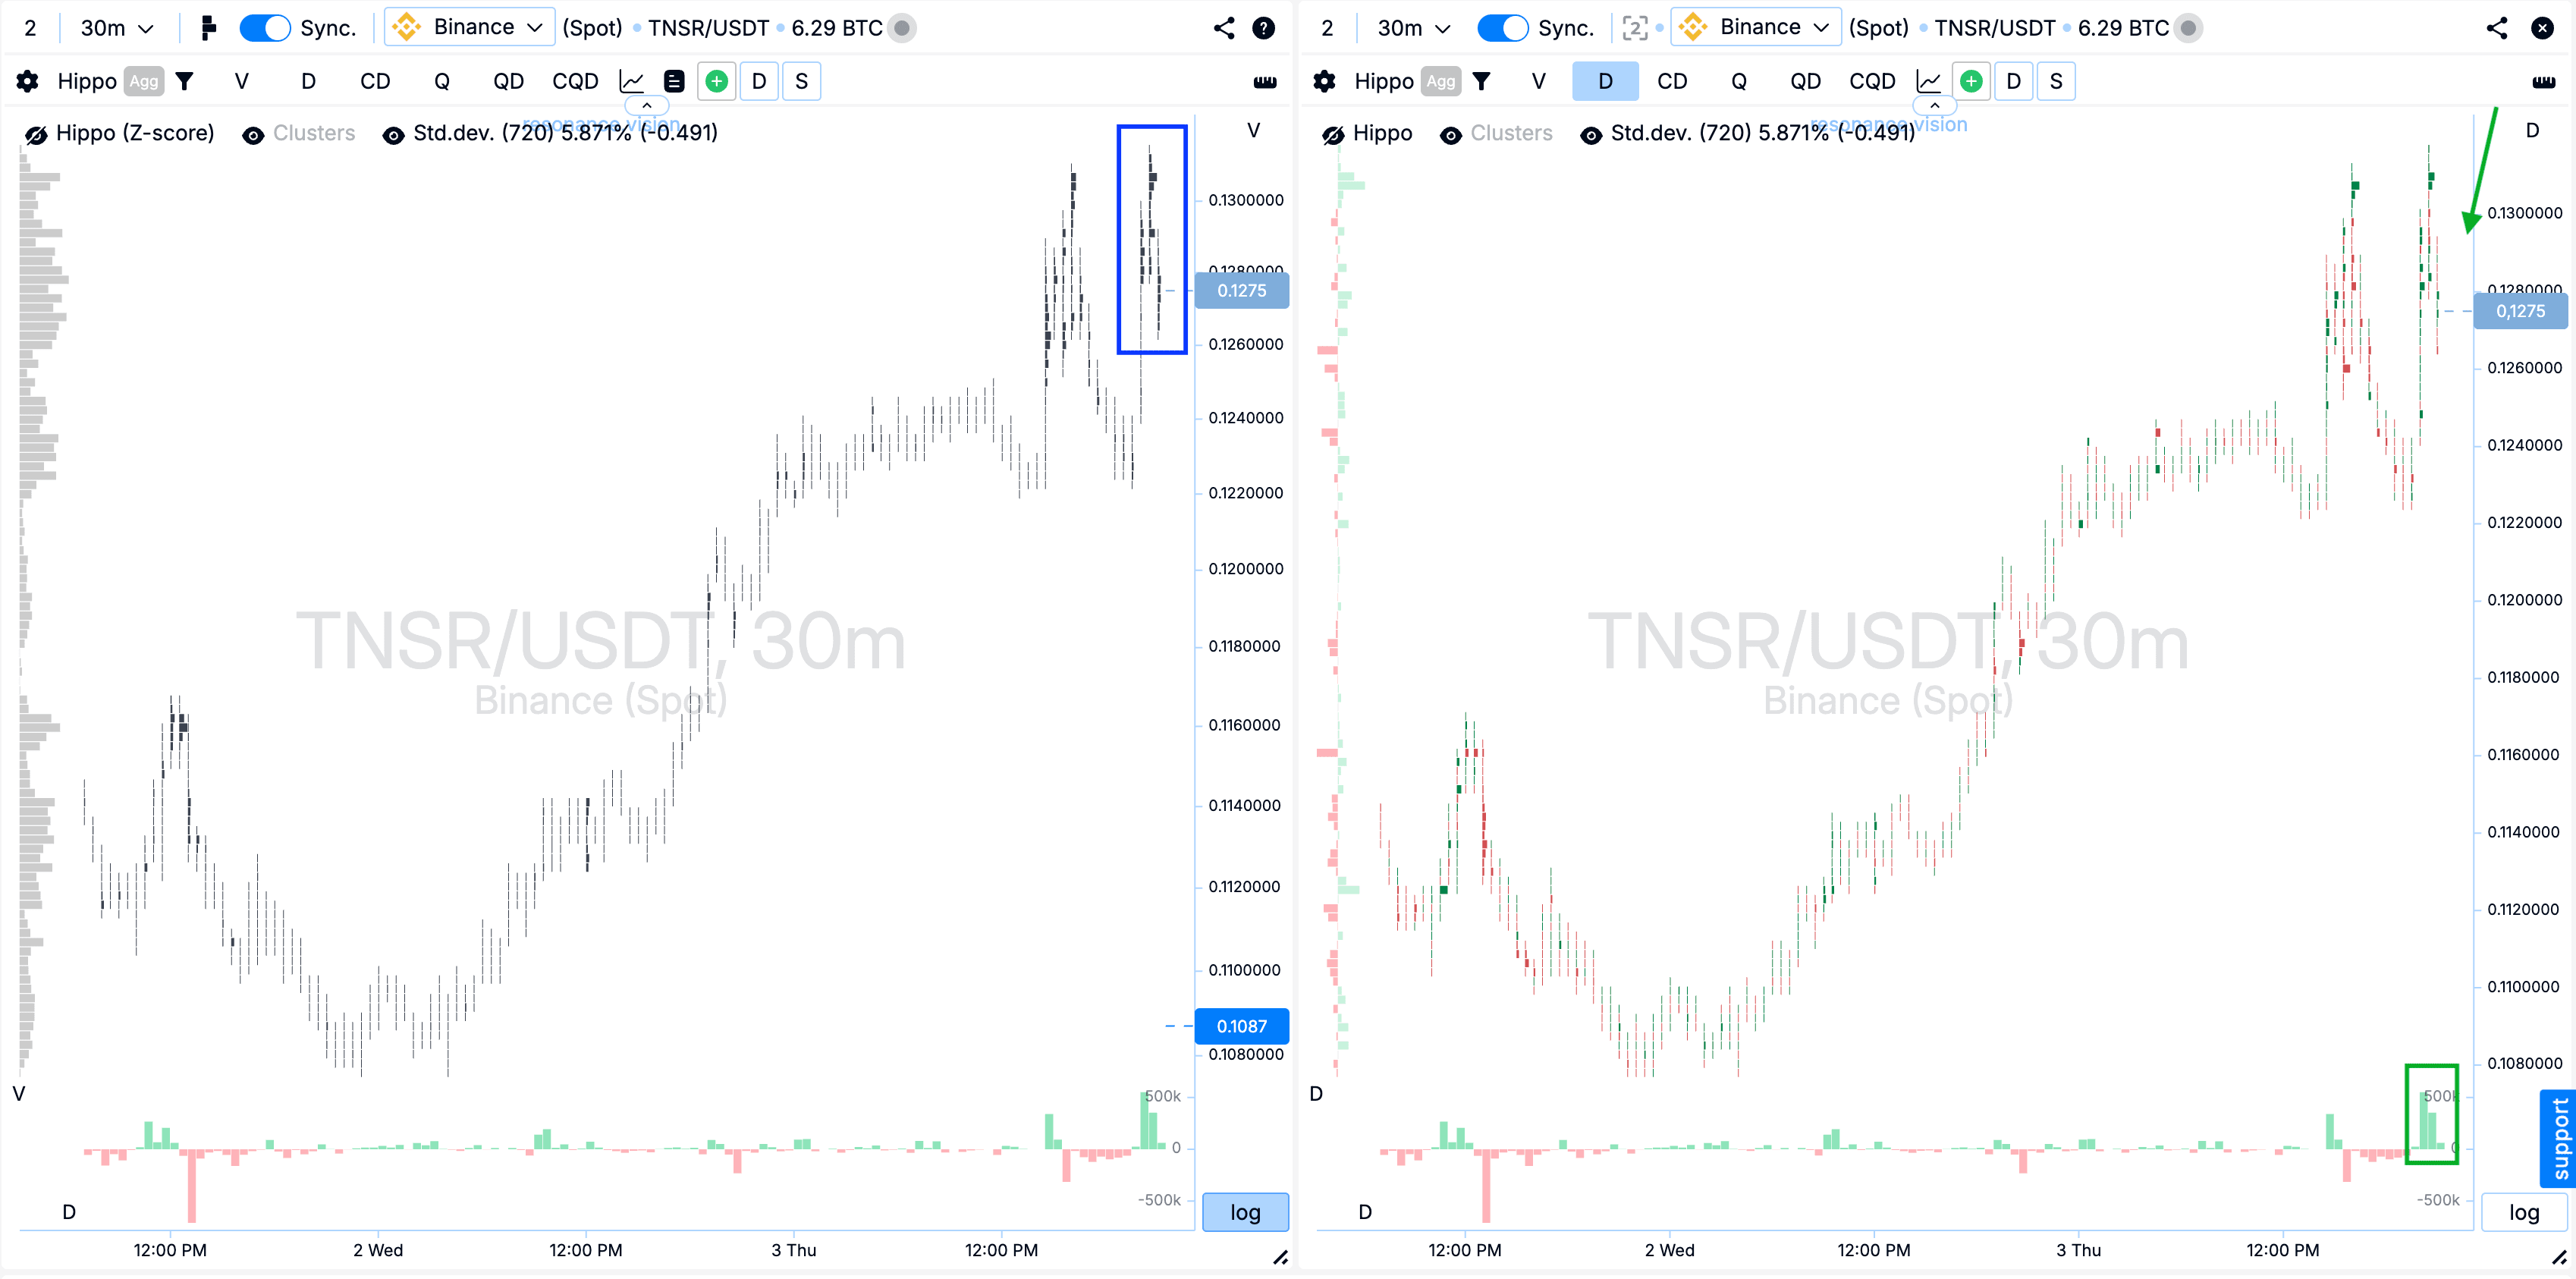
Cluster chart: An M-shaped formation has formed, within which clusters by volume have formed (blue rectangle). During the repeated upward impulse movement, there was a clear predominance of market purchases, however, despite their volume, the price failed to significantly break through the previous maximum. This indicates a weakening of the buying efficiency, after which a decline began (green rectangle and arrow).
In the Dashboard
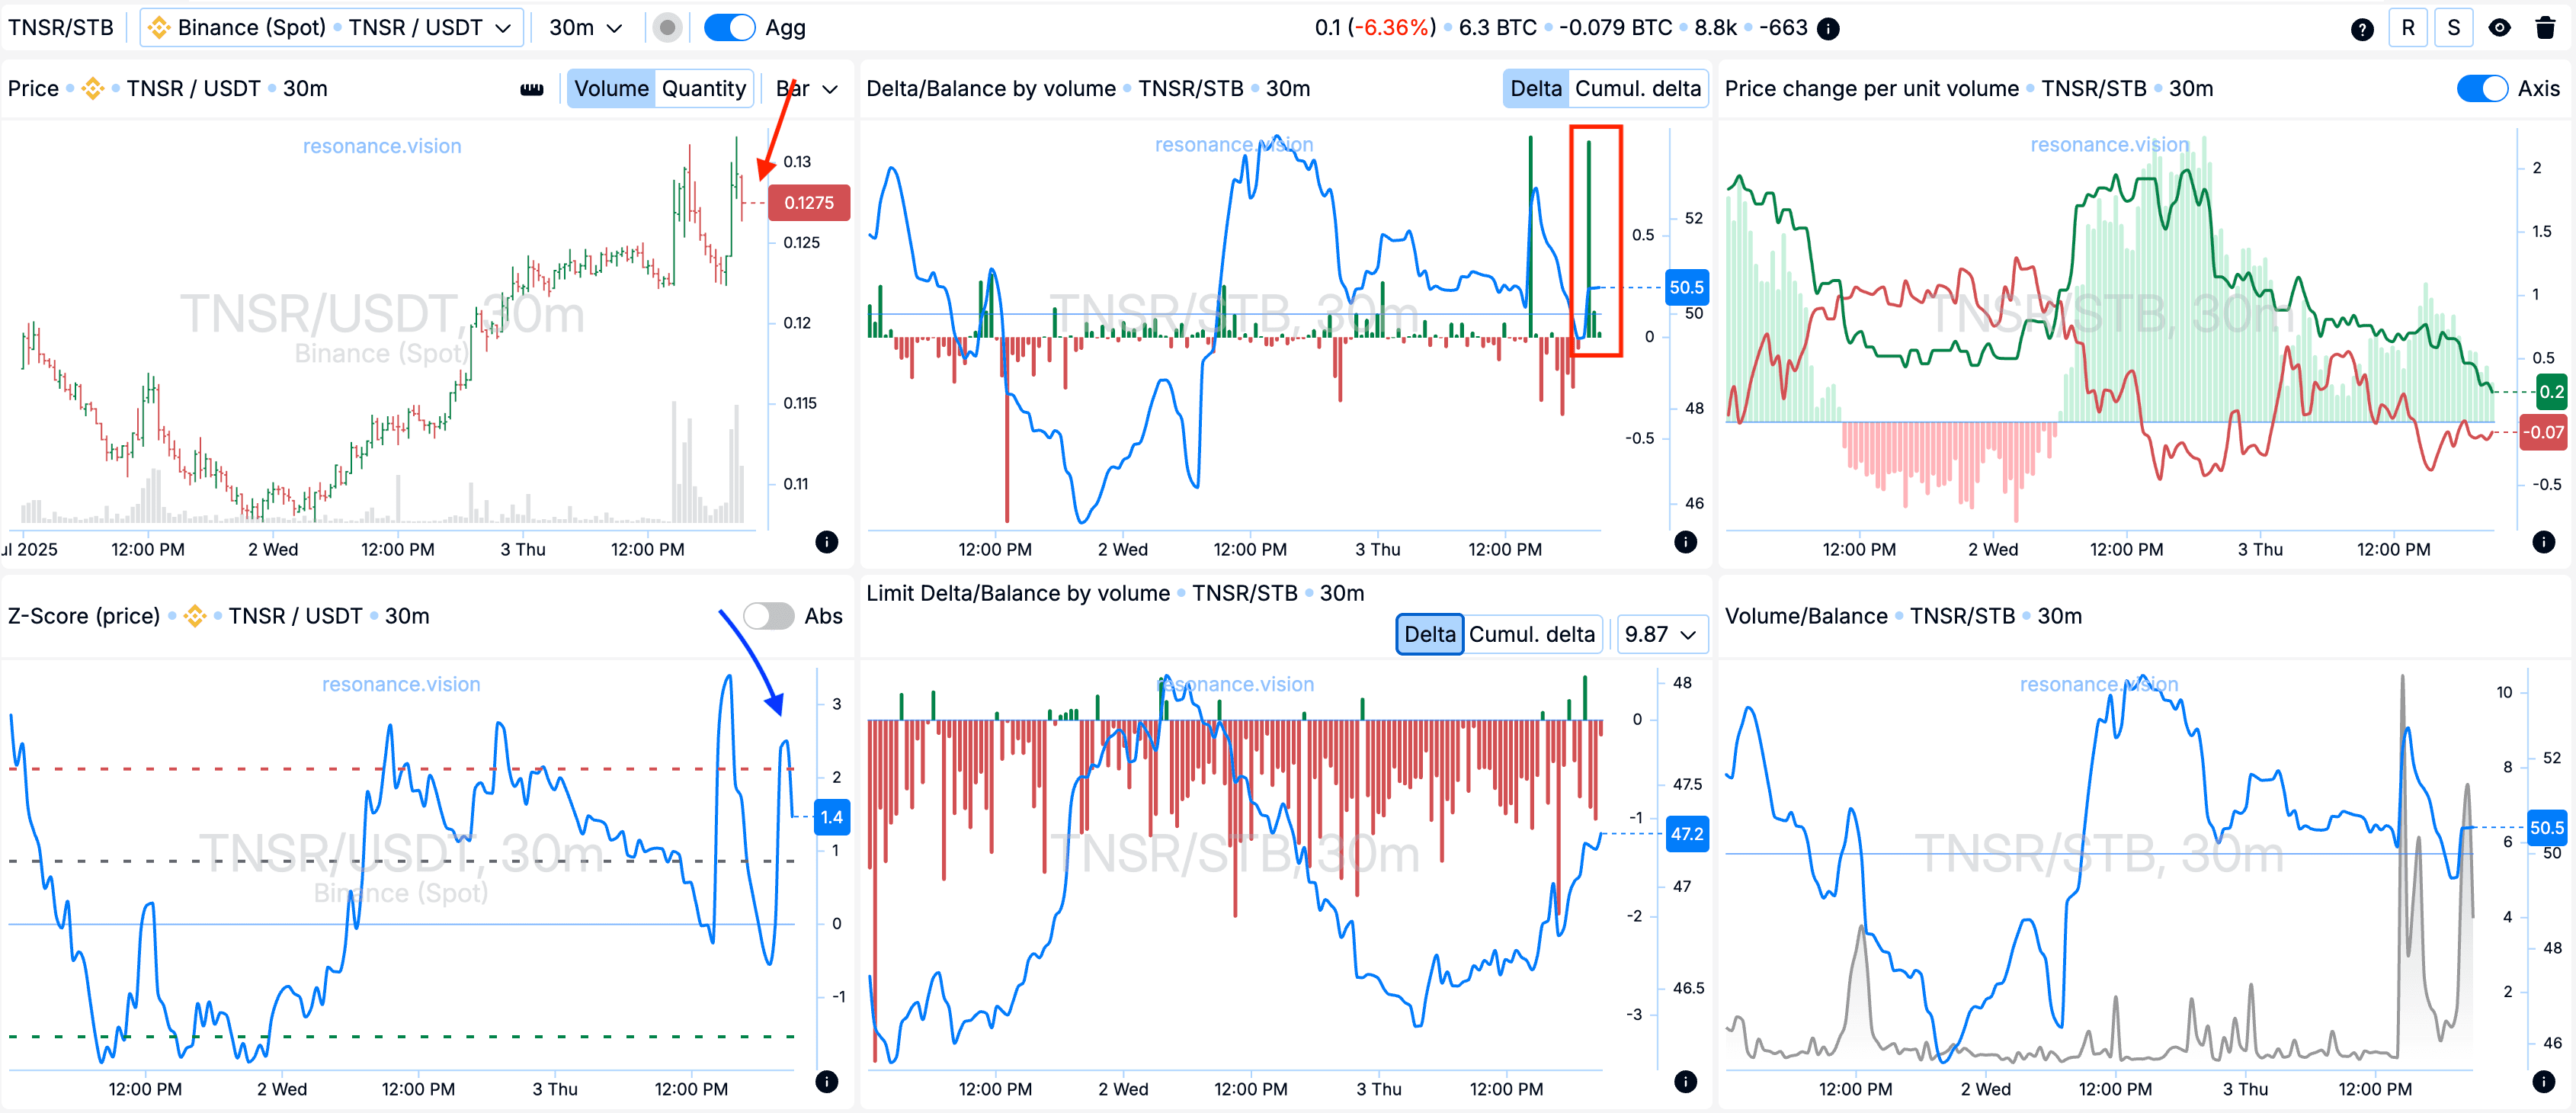
Delta/Balance by volume: According to the aggregated data, market purchases prevail, however, against the backdrop of this pressure, the price, on the contrary, began to decline (red rectangle and arrow). This indicates the inefficiency of buyers and may indicate the formation of a local surplus - a situation when the supply for sale is greater than the current demand.
Z-Score (price): An abnormal upward price deviation was additionally recorded at the extreme impulse movement - the value exceeded 2 standard deviations (blue arrow).
Exit reasons
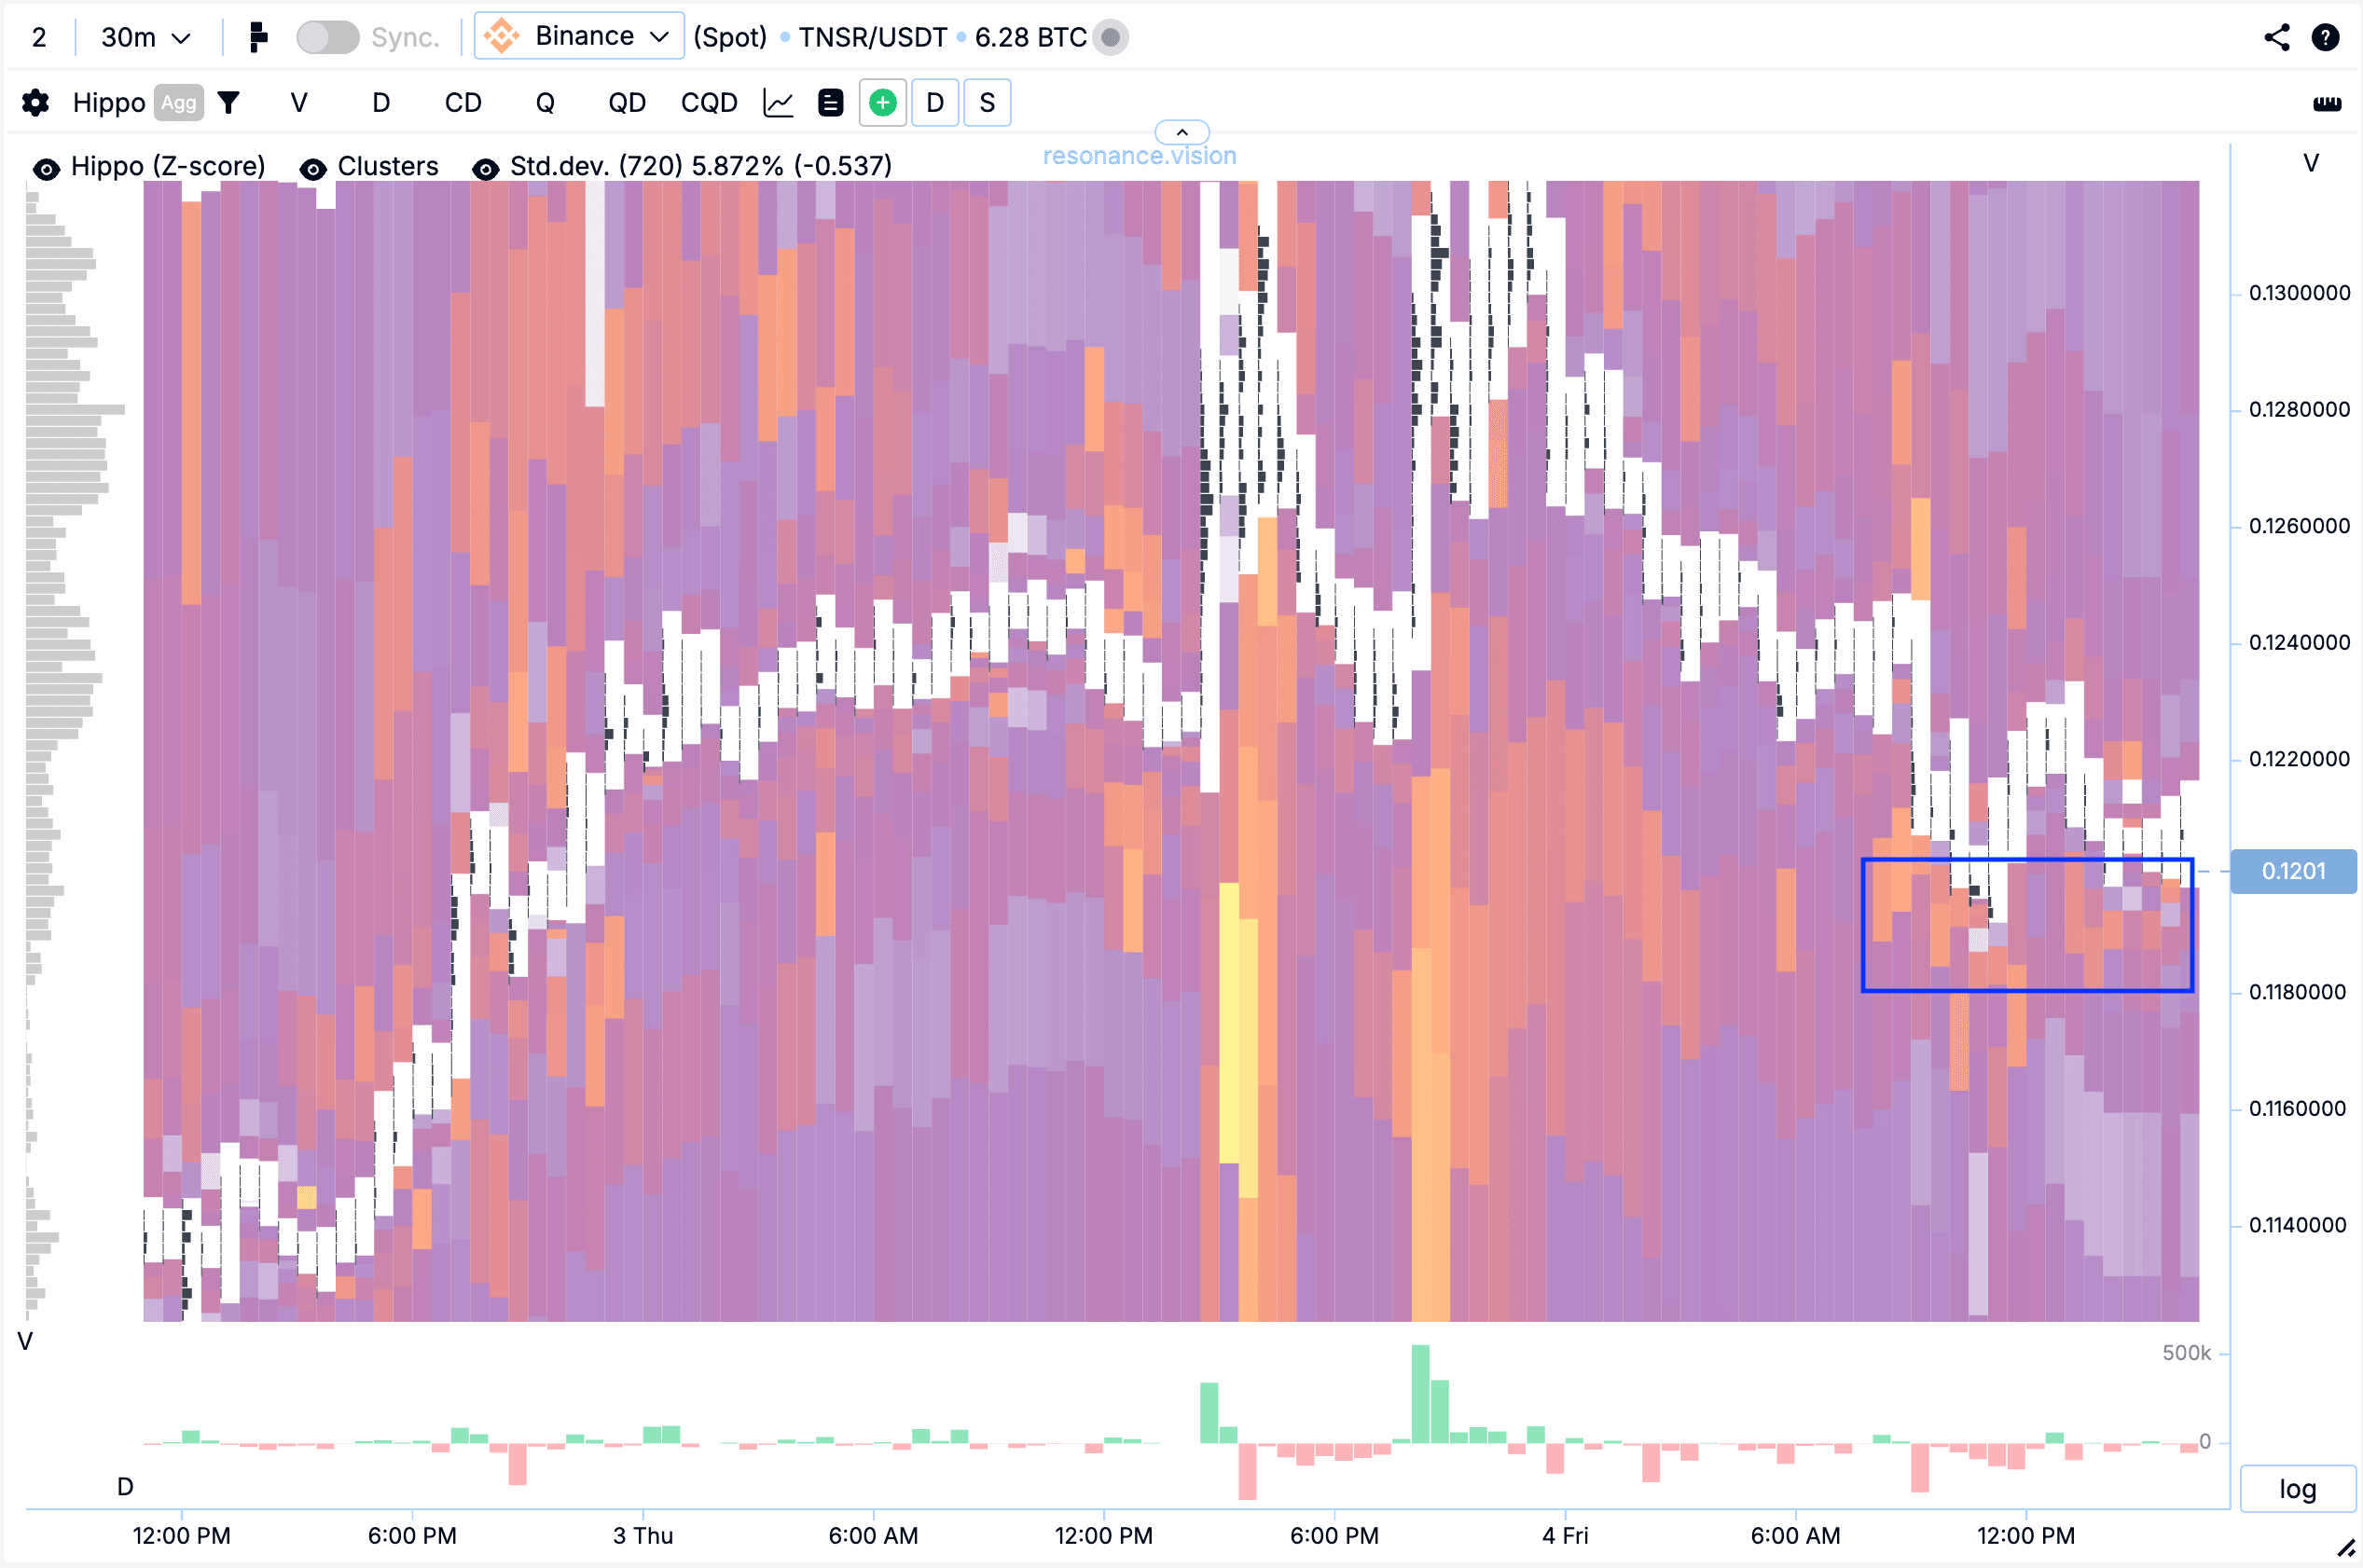
Heat map in Z-Score mode: Abnormal limit clusters (blue rectangle) began to appear under the price in the range, which effectively absorb market sales. This is confirmed by the fact that the price stopped declining - a potential signal of a stop in the movement and a possible reversal.
Given this picture, a decision was made to fix the position and close the deal.
Result
As a result, we managed to secure a profit of +377.41%.

Conclusion
This deal is a clear example of how timely recognition of buyers’ weakness near local highs can become the basis for building a strong trading hypothesis. Despite the significant volume of market purchases, the price was unable to consolidate higher - this served as the first signal of a possible reversal. Aggregated data confirmed the ineffectiveness of pressure from buyers, as well as the presence of a surplus.
At the exit, the key factor was the emergence of local limit support, which stopped the movement. This approach highlights the importance of a comprehensive analysis: volume, delta and price action all combine to provide good entry and exit points.
Follow new articles in our telegram channel.
No need to invent complex schemes and look for the "grail". Use the Resonance platform tools.
Register via the link — get a bonus and start earning:
OKX | BingX | KuCoin.
Promo code TOPBLOG gives you a 10% discount on any Resonance tariff plan.
Recommended articles


