TOWNS +52.1% (Напрямкова стратегія Resonance)

У аналізі показано, як поєднання кластерного аналізу та агрегованих даних допомагає визначити ослаблення продавців та формування локального дефіциту. Додаткові метрики, такі як ефективність покупок, посилили впевненість у лонг-сценарії. Імпульсне зростання підтвердило коректність аналізу, а продажі на відкаті стали сигналом для своєчасної фіксації прибутку.
Зміст

Монета: TOWNS/USDT
Ризик: середній
Рівень розуміння: новачок
Причини входу
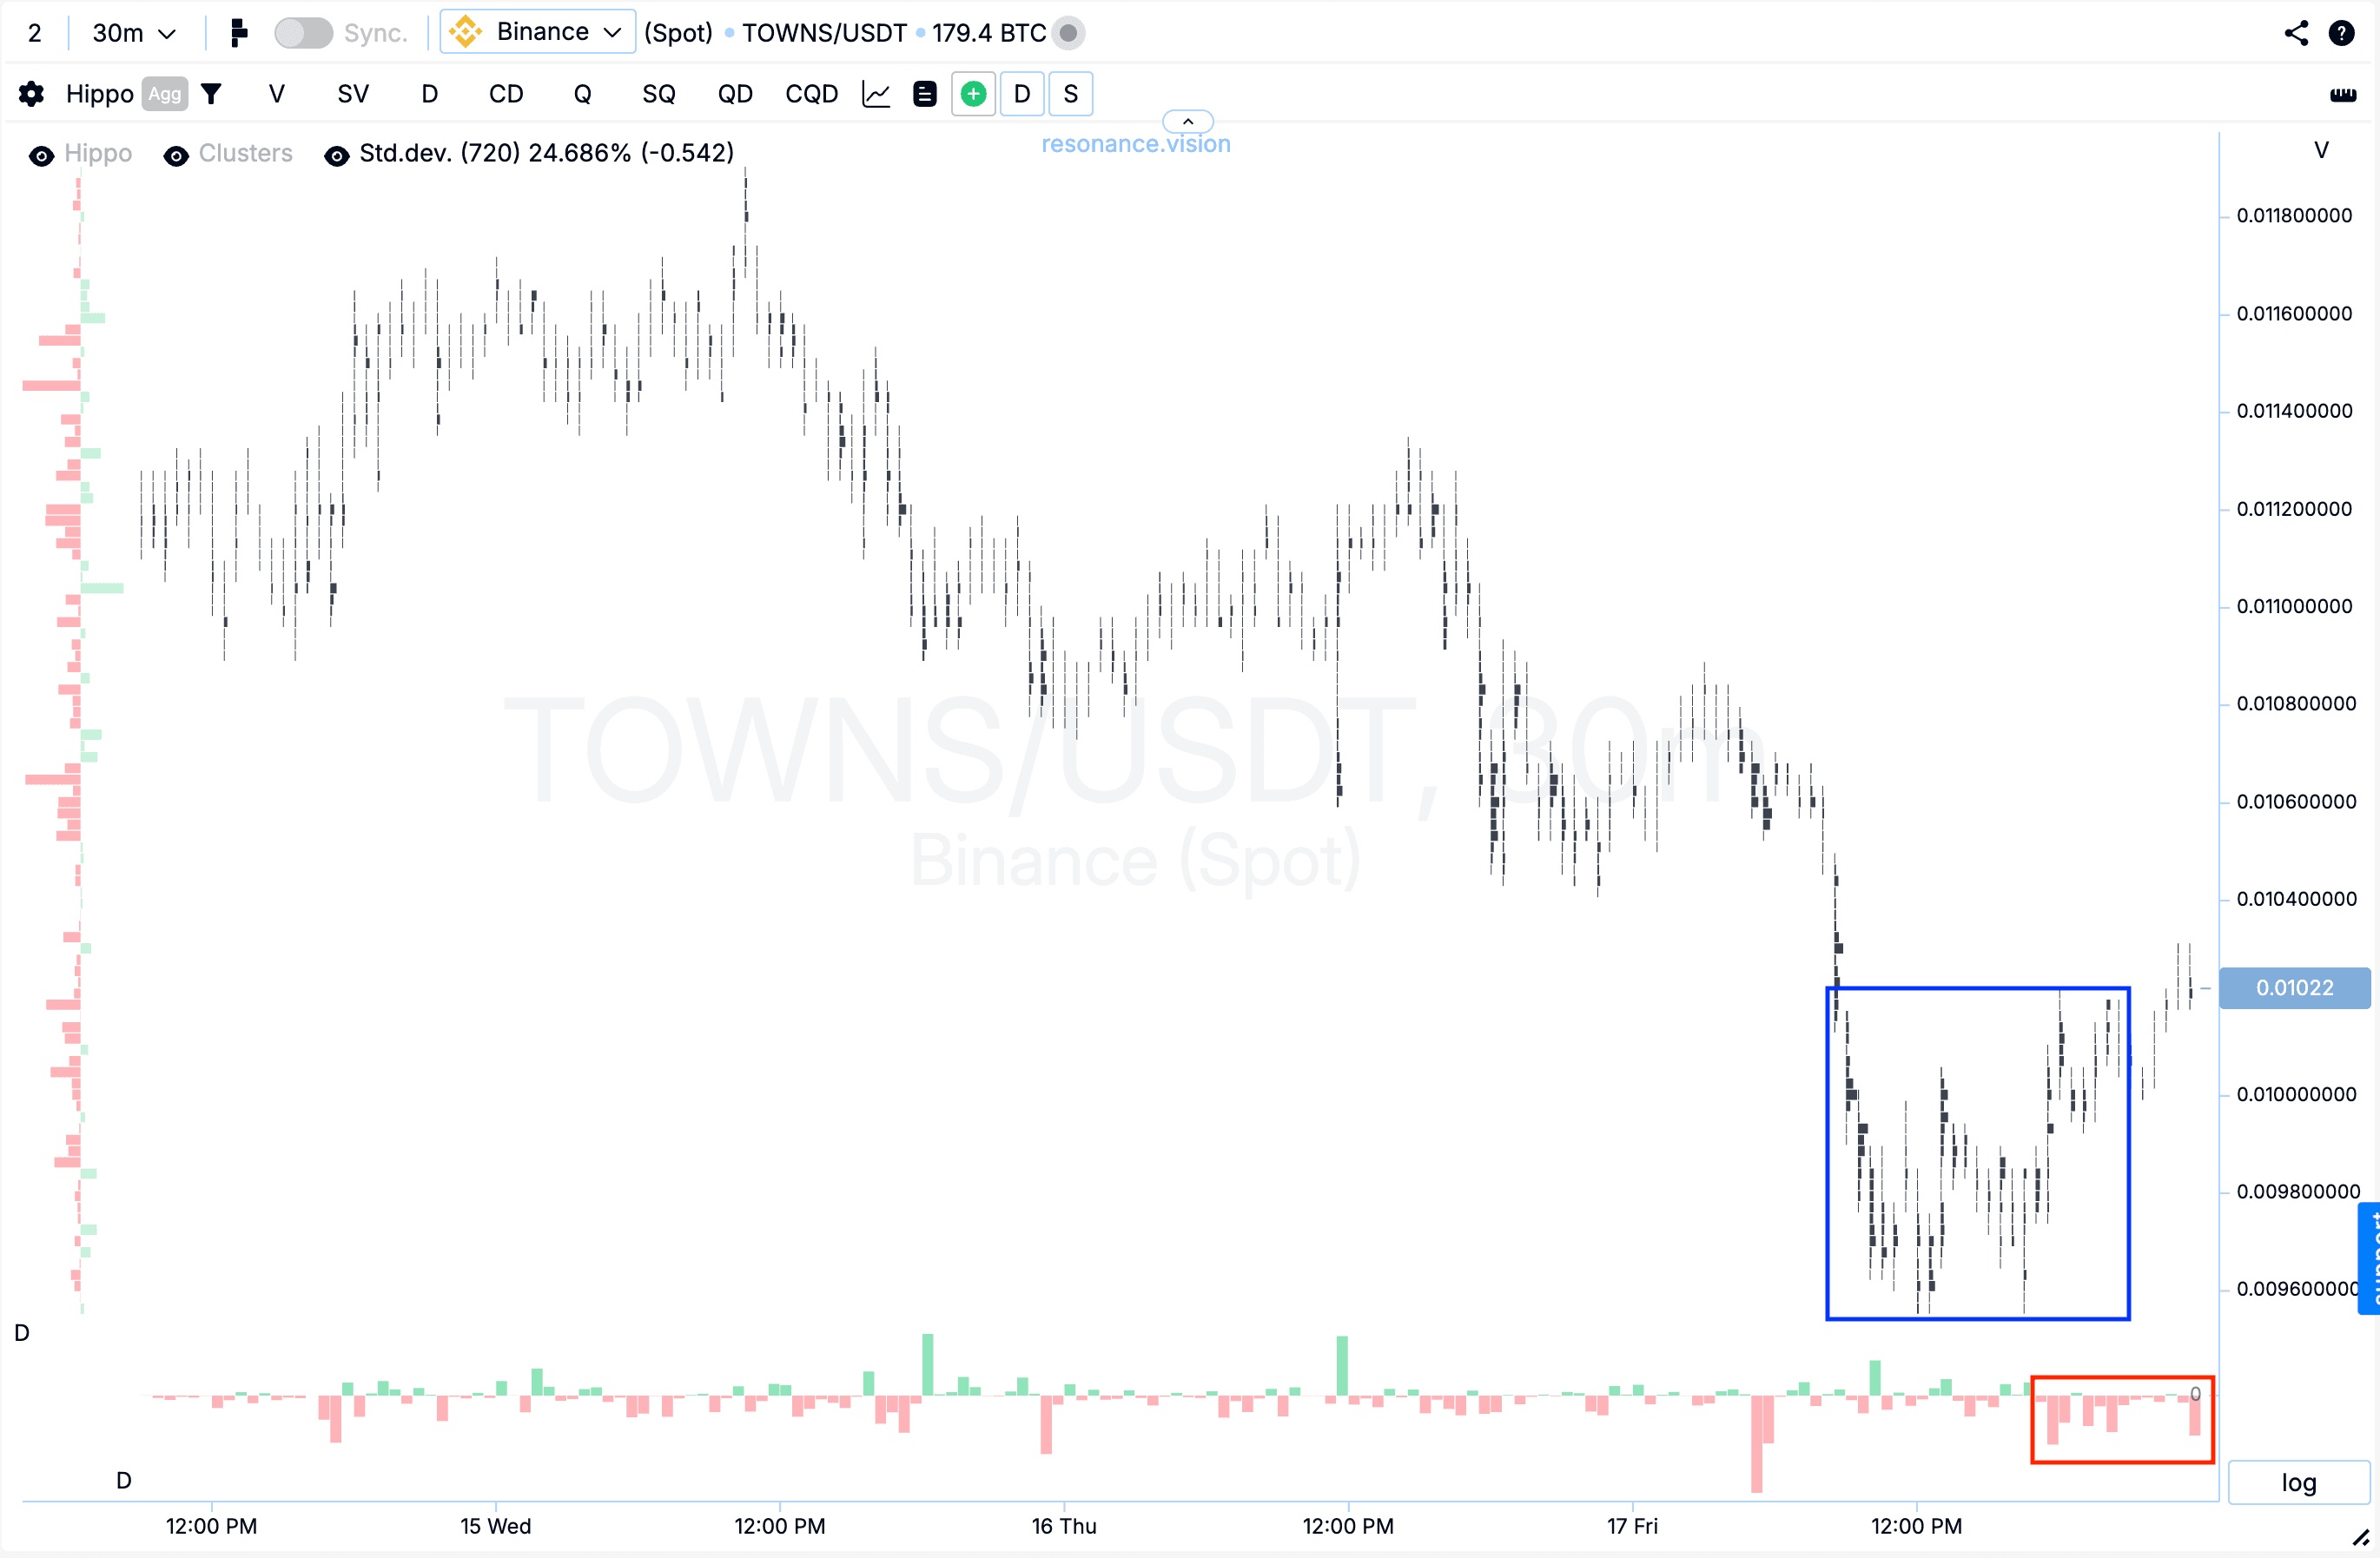
Кластерний графік: на зниженні почали формуватися великі кластери за об’ємом (синій прямокутник). Після чого помітно почали переважати продажі (червоний прямокутник), проте ціна на цих продажах вже не знижується, а навпаки почала зростати. Подібна динаміка може сигналізувати про локальний дефіцит та зниження сили продавців.
У Дешборді
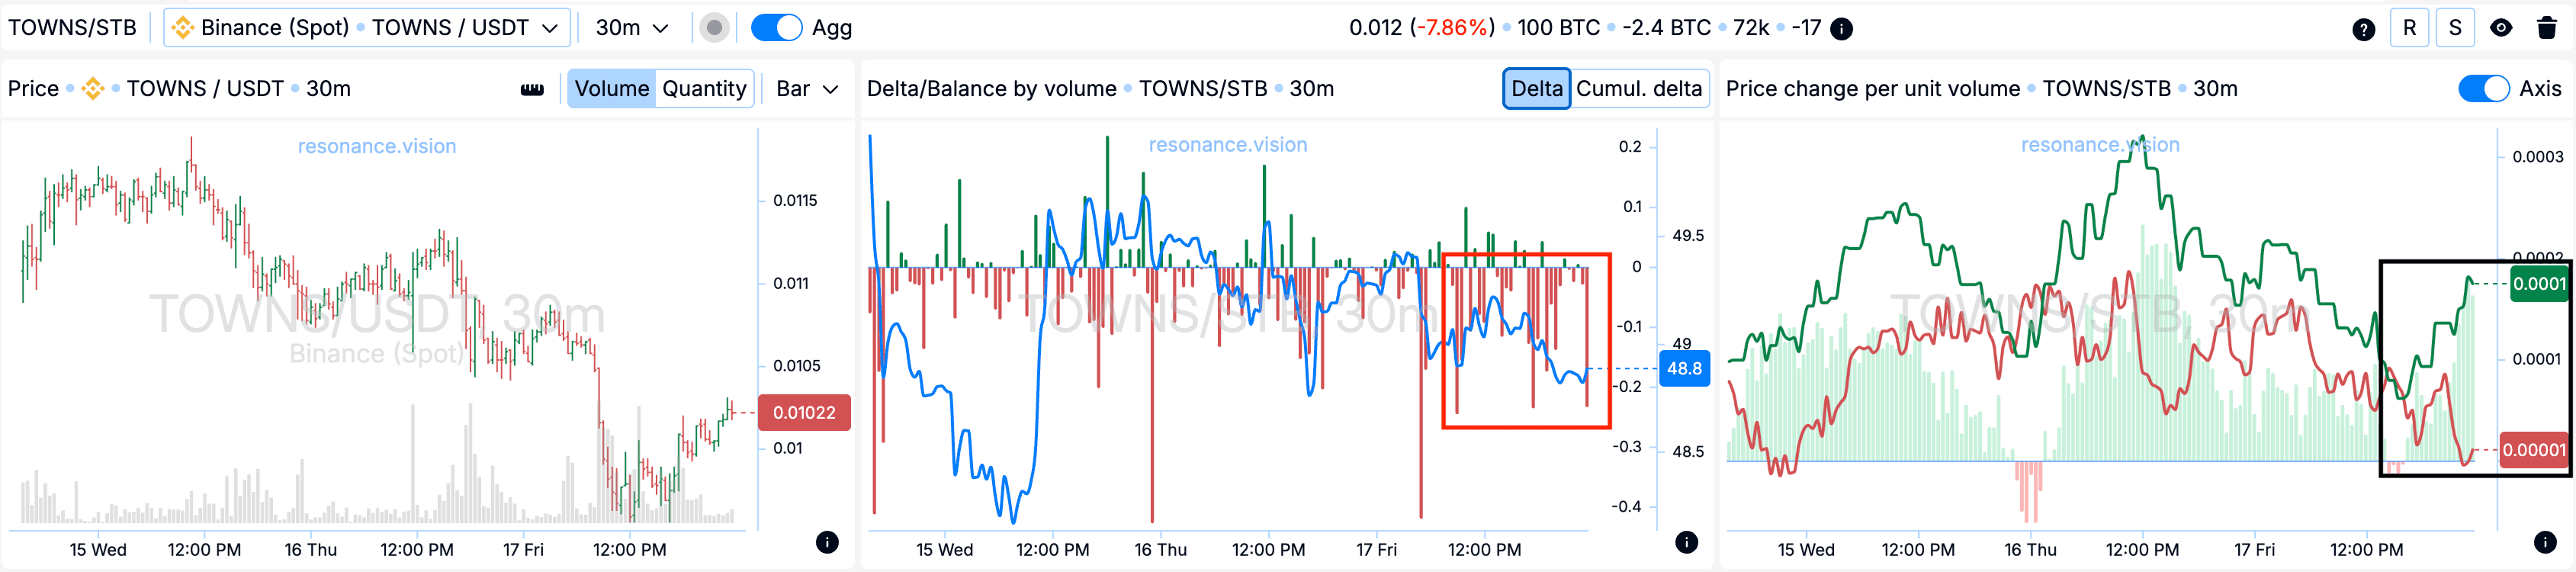
Дельта/Баланс за об’ємом: агреговані дані показують переважання продажів по всіх парах та біржах, що виразно видно по гістограмі дельти (червоний прямокутник). Це підтверджує картину, яка спостерігається на кластерному графіку.
Зміна ціни на одиницю об’єму: додатково видно, що ефективність впливу ринкових ордерів початку розходиться на користь покупців (чорний прямокутник), що вказує на зростання ефективності покупок.
Причини виходу
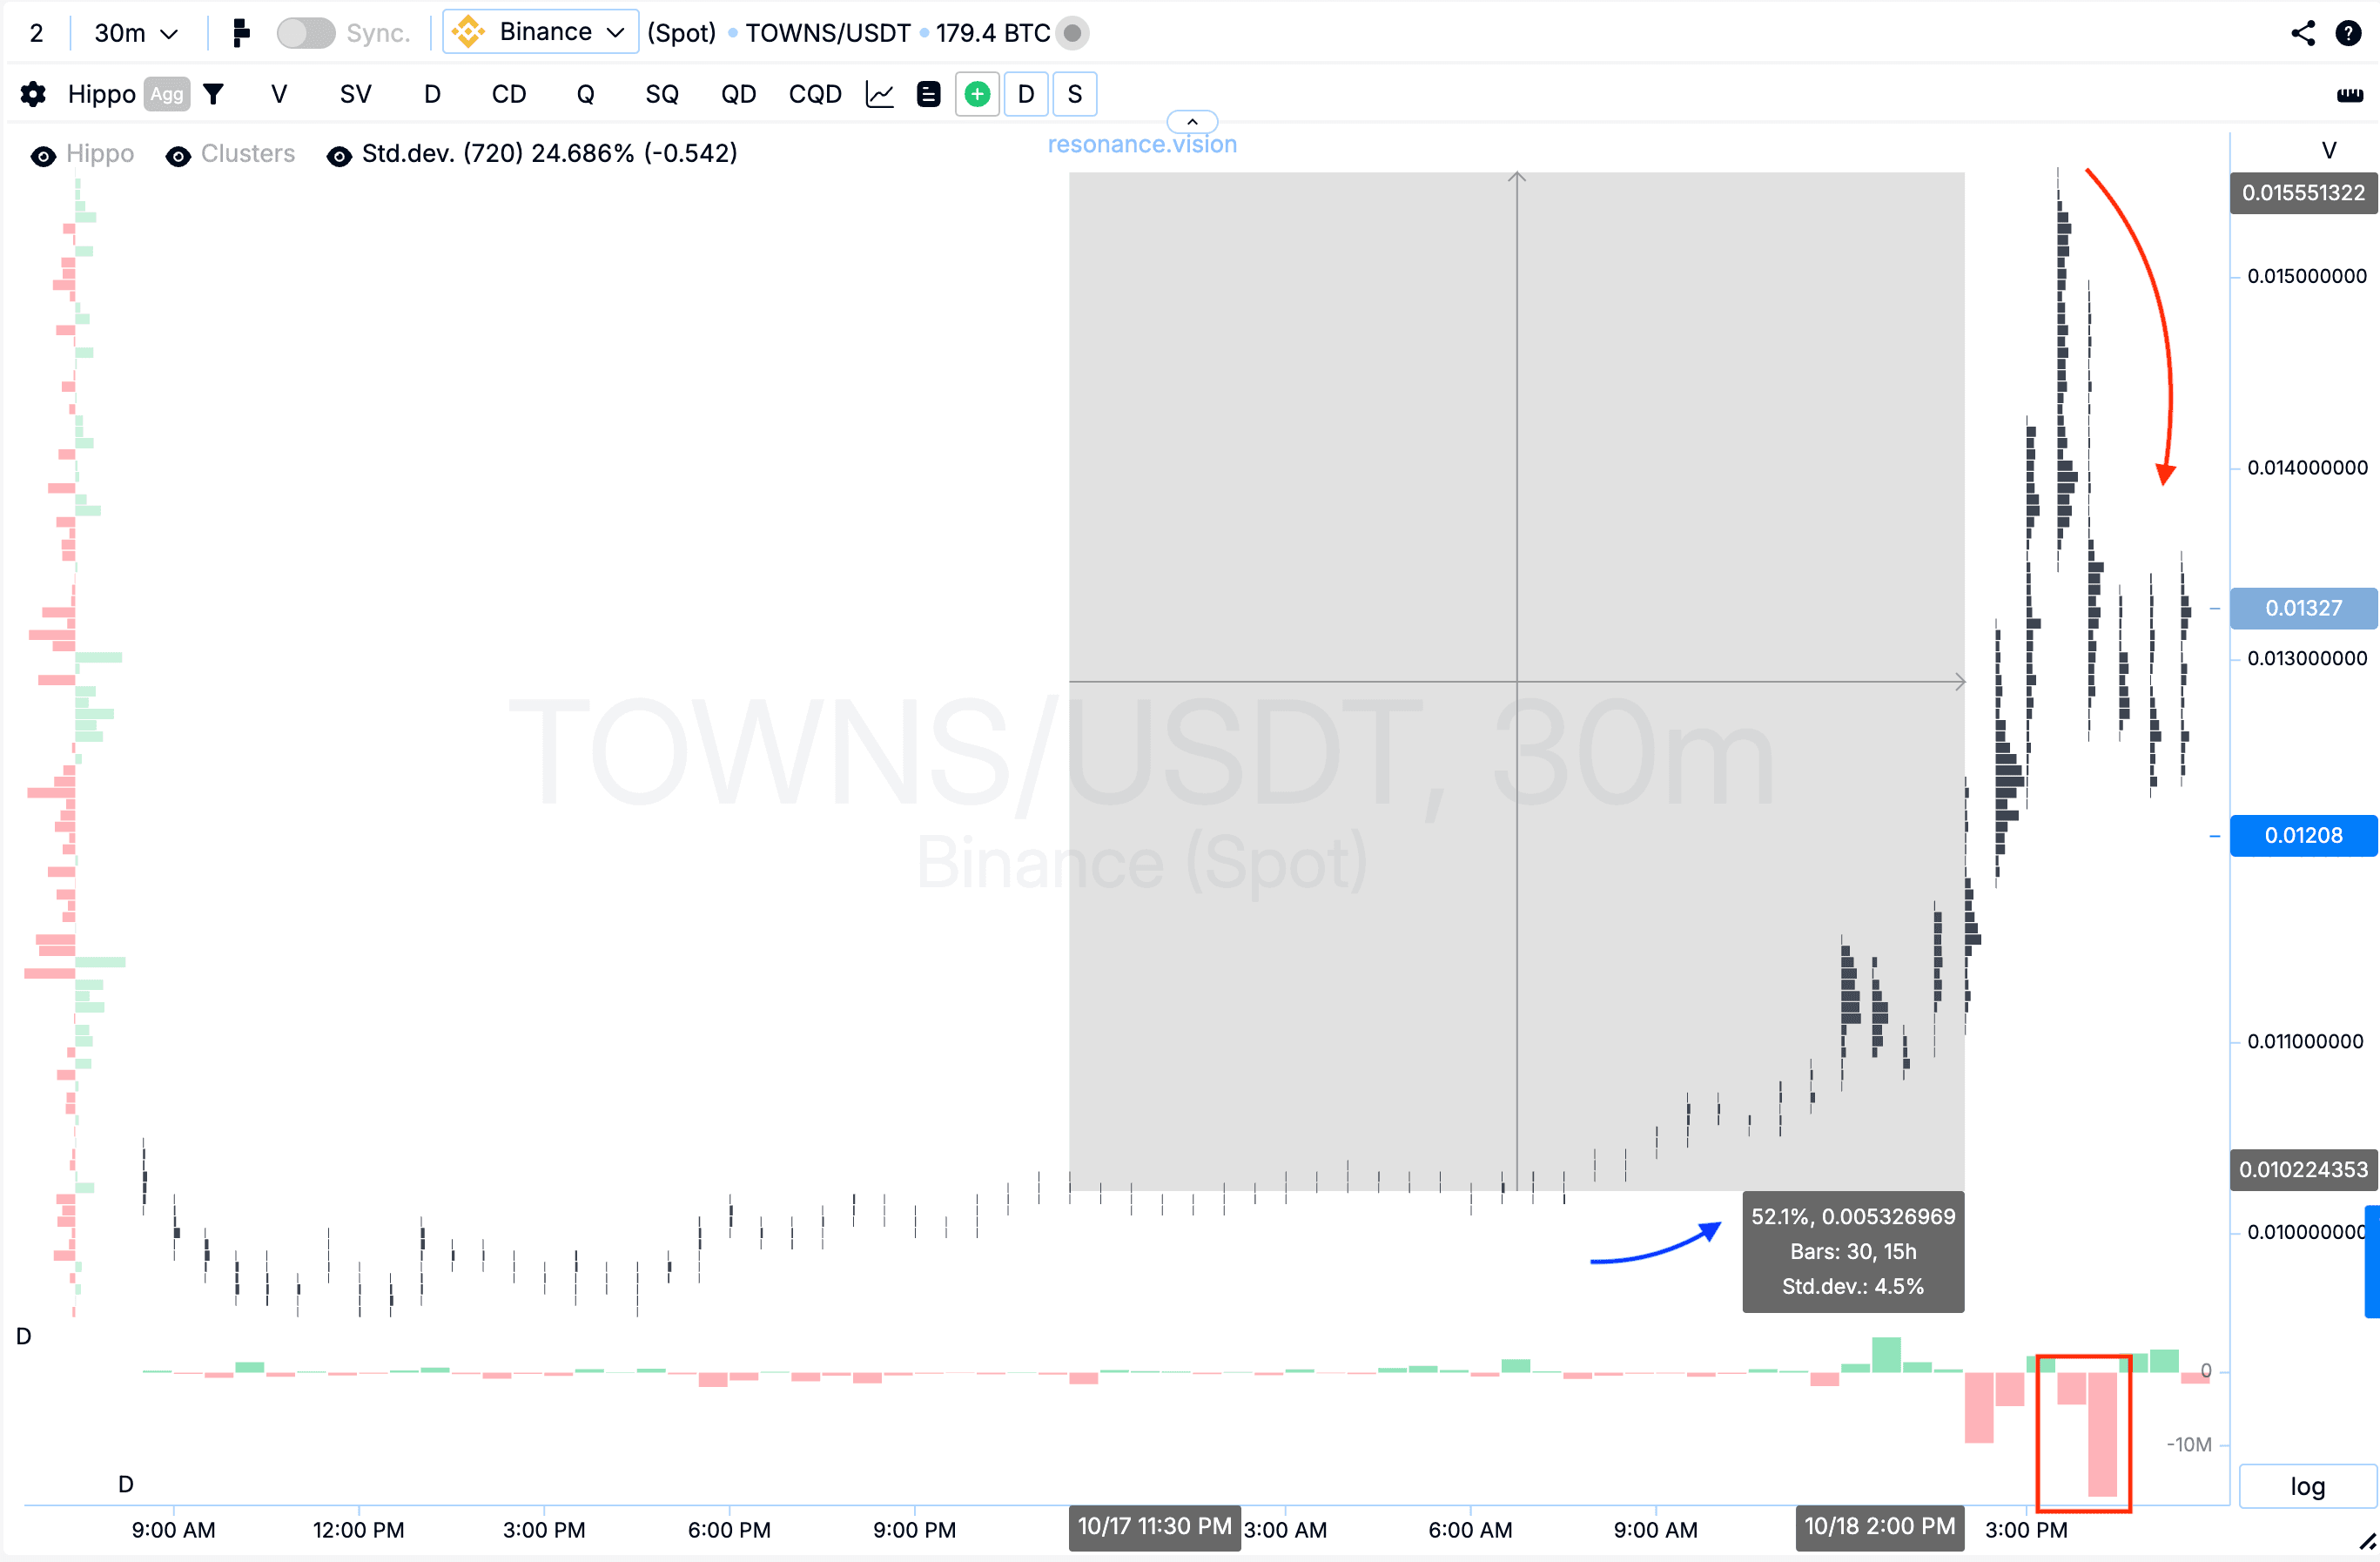
Кластерний графік: після імпульсного зростання більш ніж на 50% ціна сформувала відкат, що супроводжується значними маркет-продажами (червоний прямокутник та стрілка). У таких умовах подальше утримання позиції супроводжувалося підвищеними ризиками, тому фіксація прибутку виглядала найбільш раціональним рішенням.
Висновок
Вхід у позицію був заснований на ознаках локального дефіциту та ослаблення тиску з боку продавців, що підтверджувалося як за кластерами, так і за агрегованими даними. Зростання ефективності покупок за метрикою зміни ціни на одиницю обсягу стало додатковим аргументом на користь можливого продовження цінового руху.
Імпульсний рух підтвердив коректність аналізу, а поява помітних продажів на відкаті стало сигналом для фіксації результату і завершення угоди.
Стеж за новими статтями у нашому телеграм каналі.
Не треба вигадувати складних схем та шукати “грааль”. Використовуйте інструменти платформи Resonance.
Реєструйся за посиланням - отримуй бонус і починай заробляти:
OKX | BingX | KuCoin.
Промокод TOPBLOG дає тобі 10% знижки на будь-який тарифний план Resonance.
Рекомендовані статті


