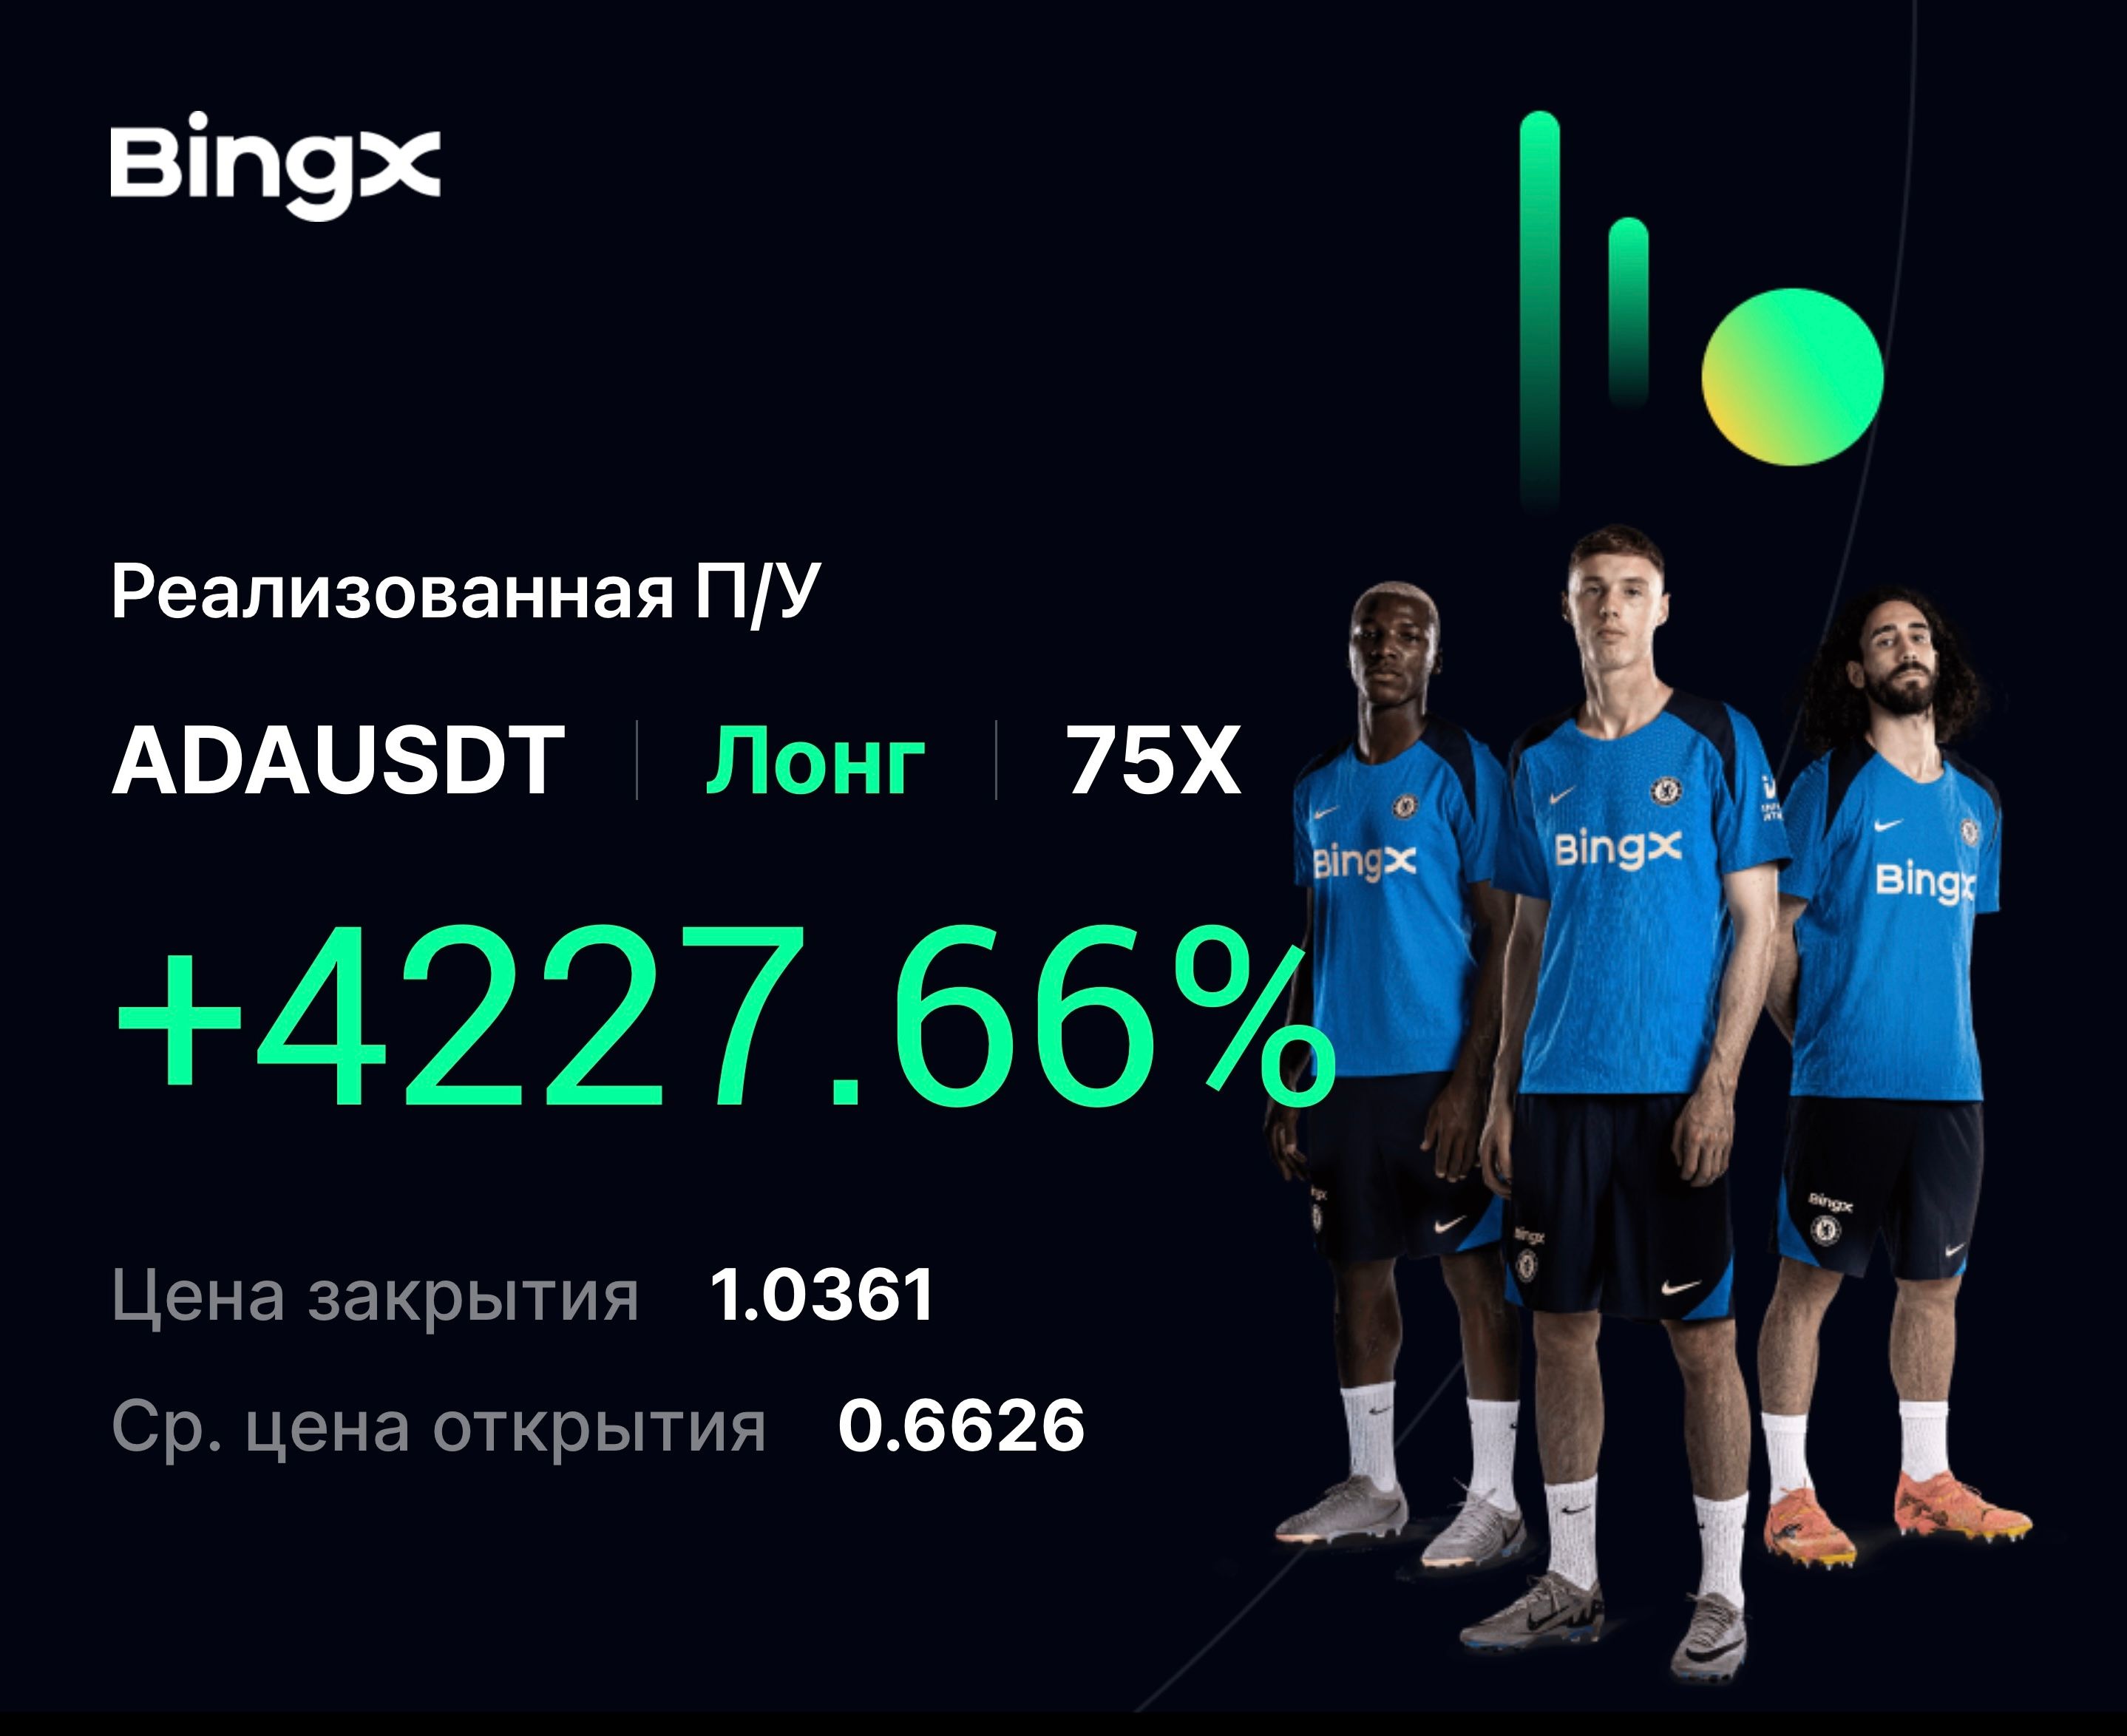
ADA +4227.66% (Resonance Directional Strategy)

A detailed analysis of a high-risk ADA/USDT trade with a clear explanation for beginners.
Using a cluster chart, heat map, and Dashboard metrics, it shows how to identify a local deficit, entry point, and then exit point when selling intensifies and volatility increases.
Profit taking was +4227.66%, which highlights the power of volume analysis and correct assessment of limit activity.
Table of contents

Coin: ADA/USDT
Risk: high
Understanding level: beginner
Reasons to enter
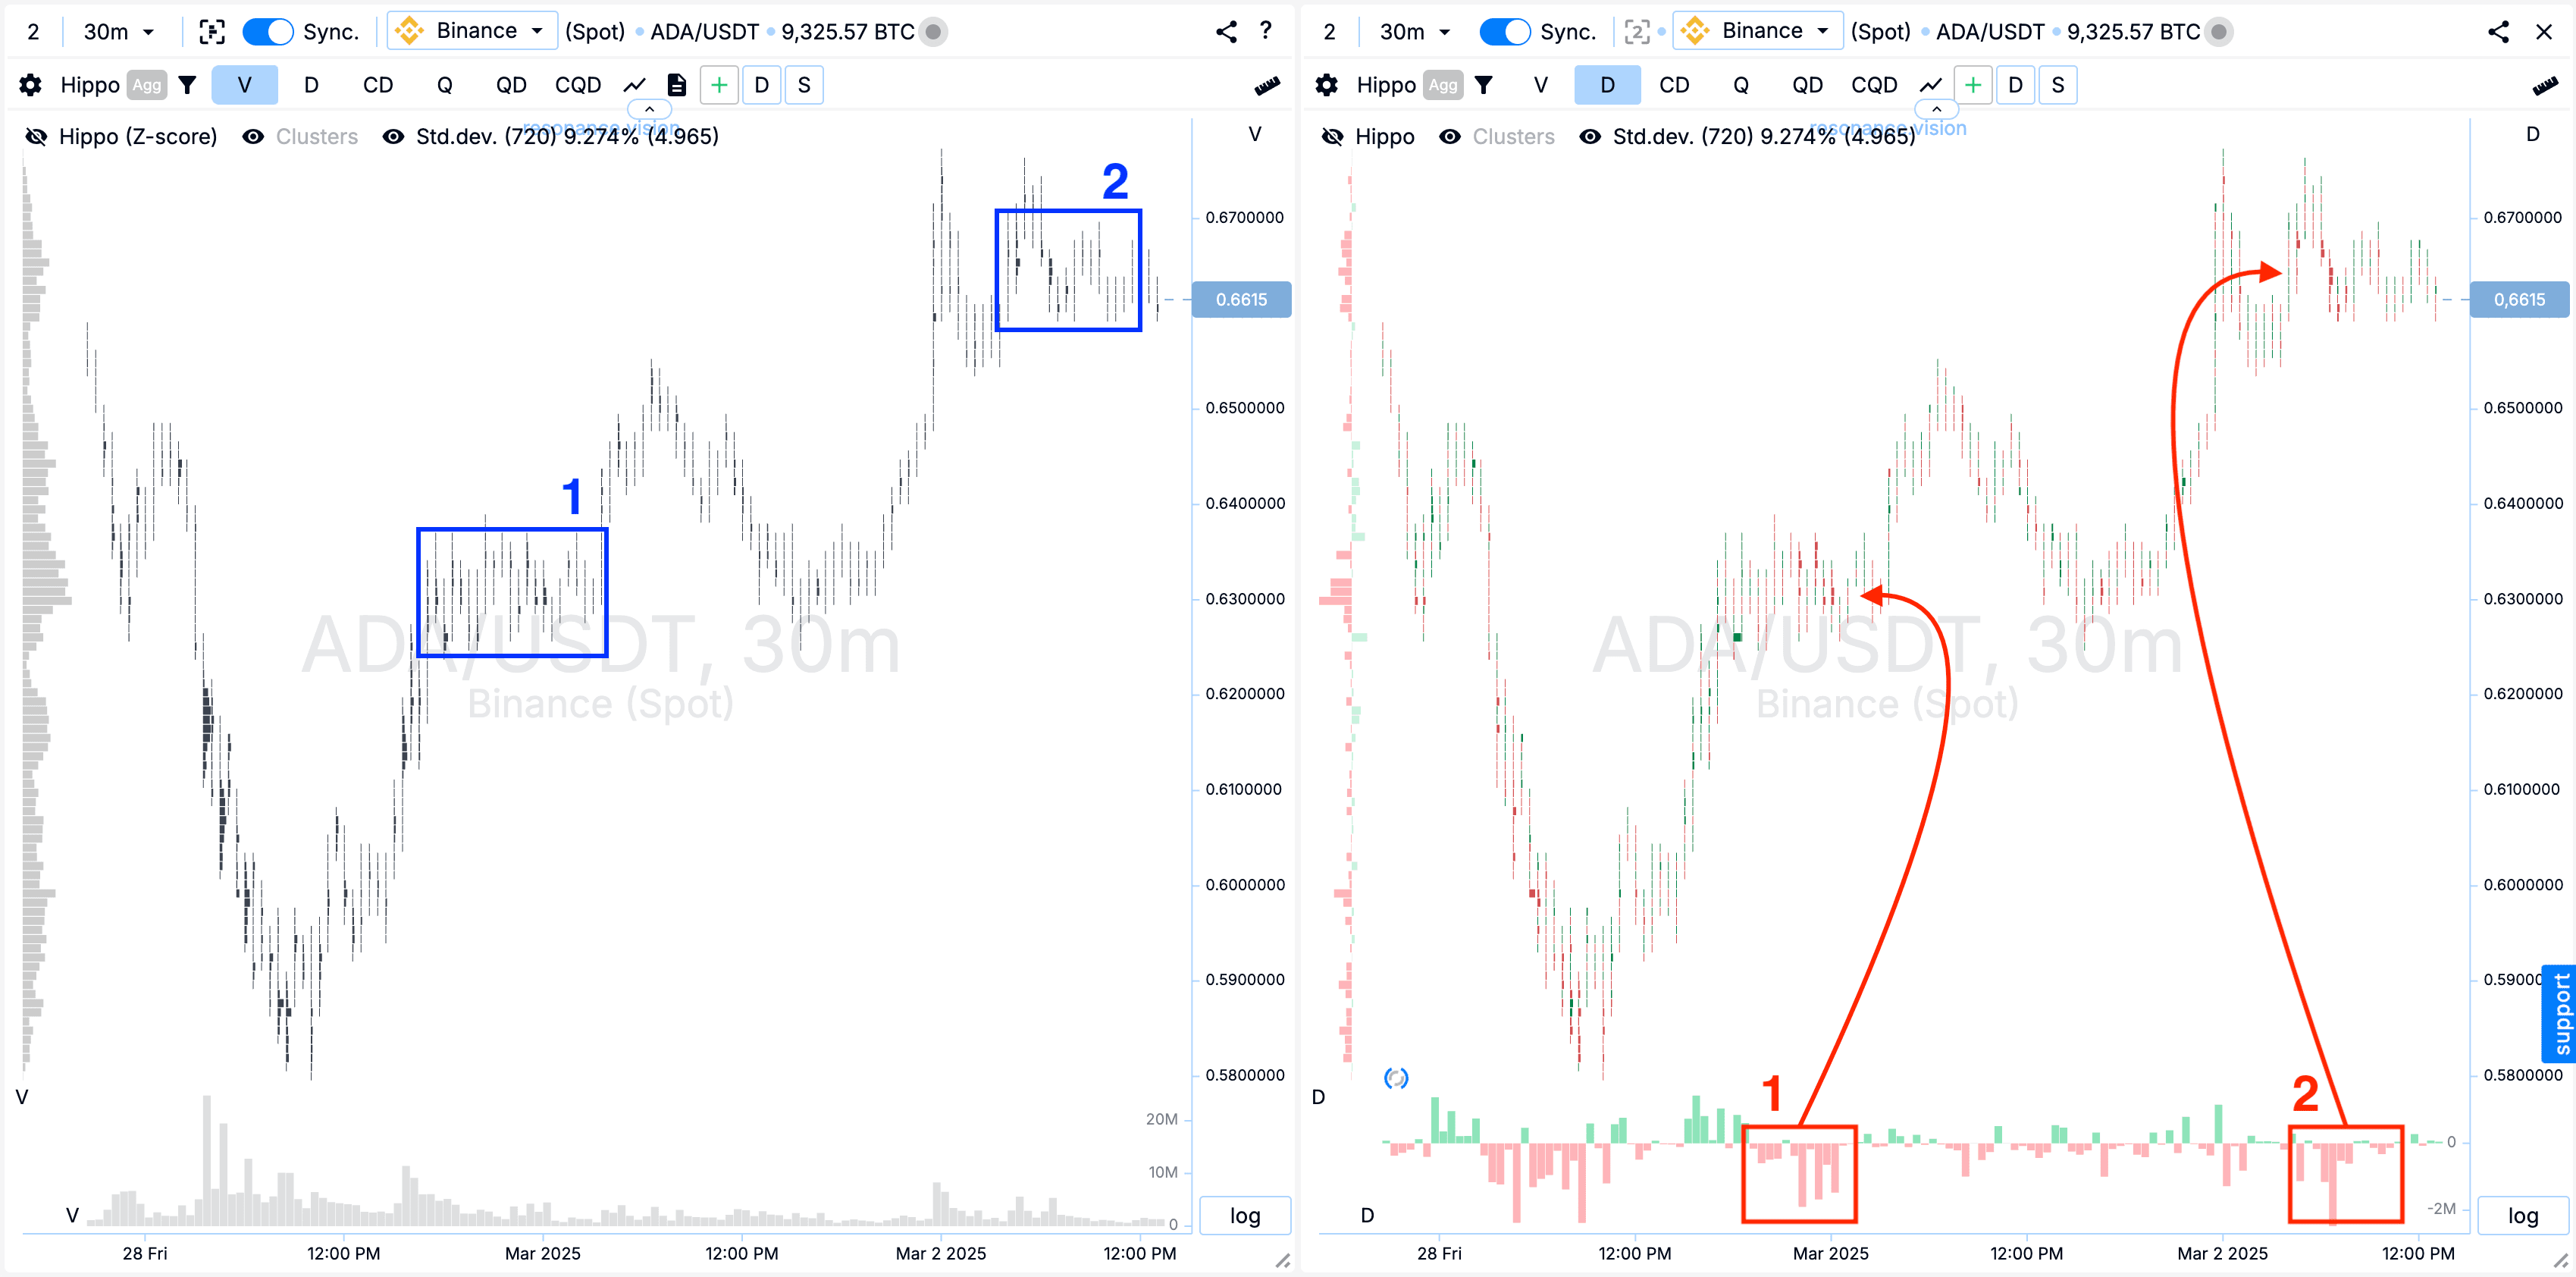
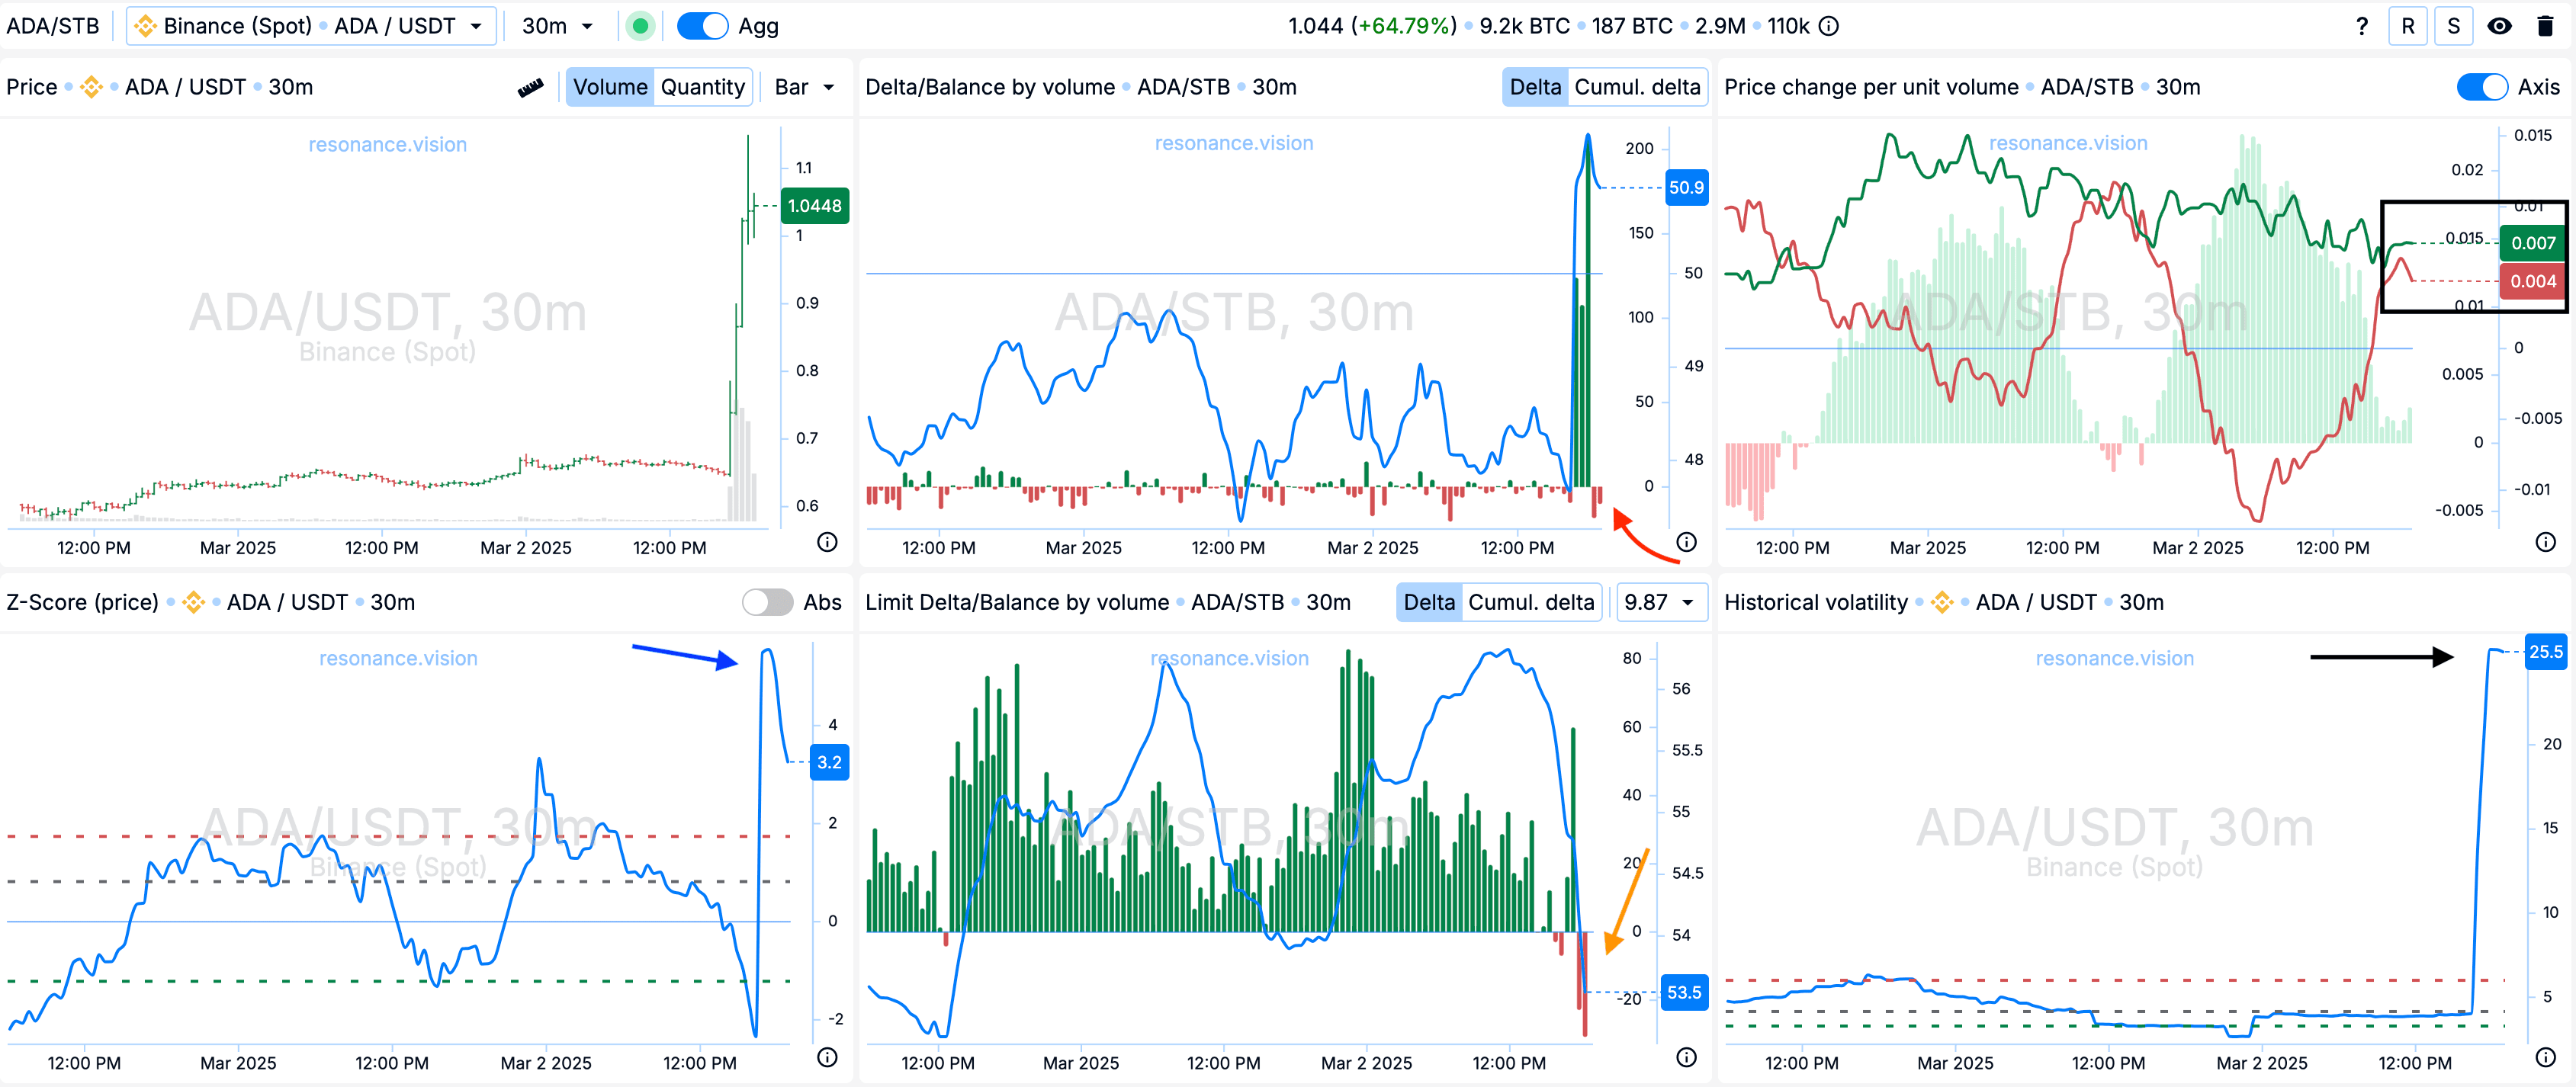
Cluster chart:
At the moment of growth, relatively large clusters by volume began to form (blue rectangles).
These volumes were accompanied by large sales, but in both cases the sales did not lead to a result (marked with red rectangles with an arrow).
Which indicates a potential local deficit.
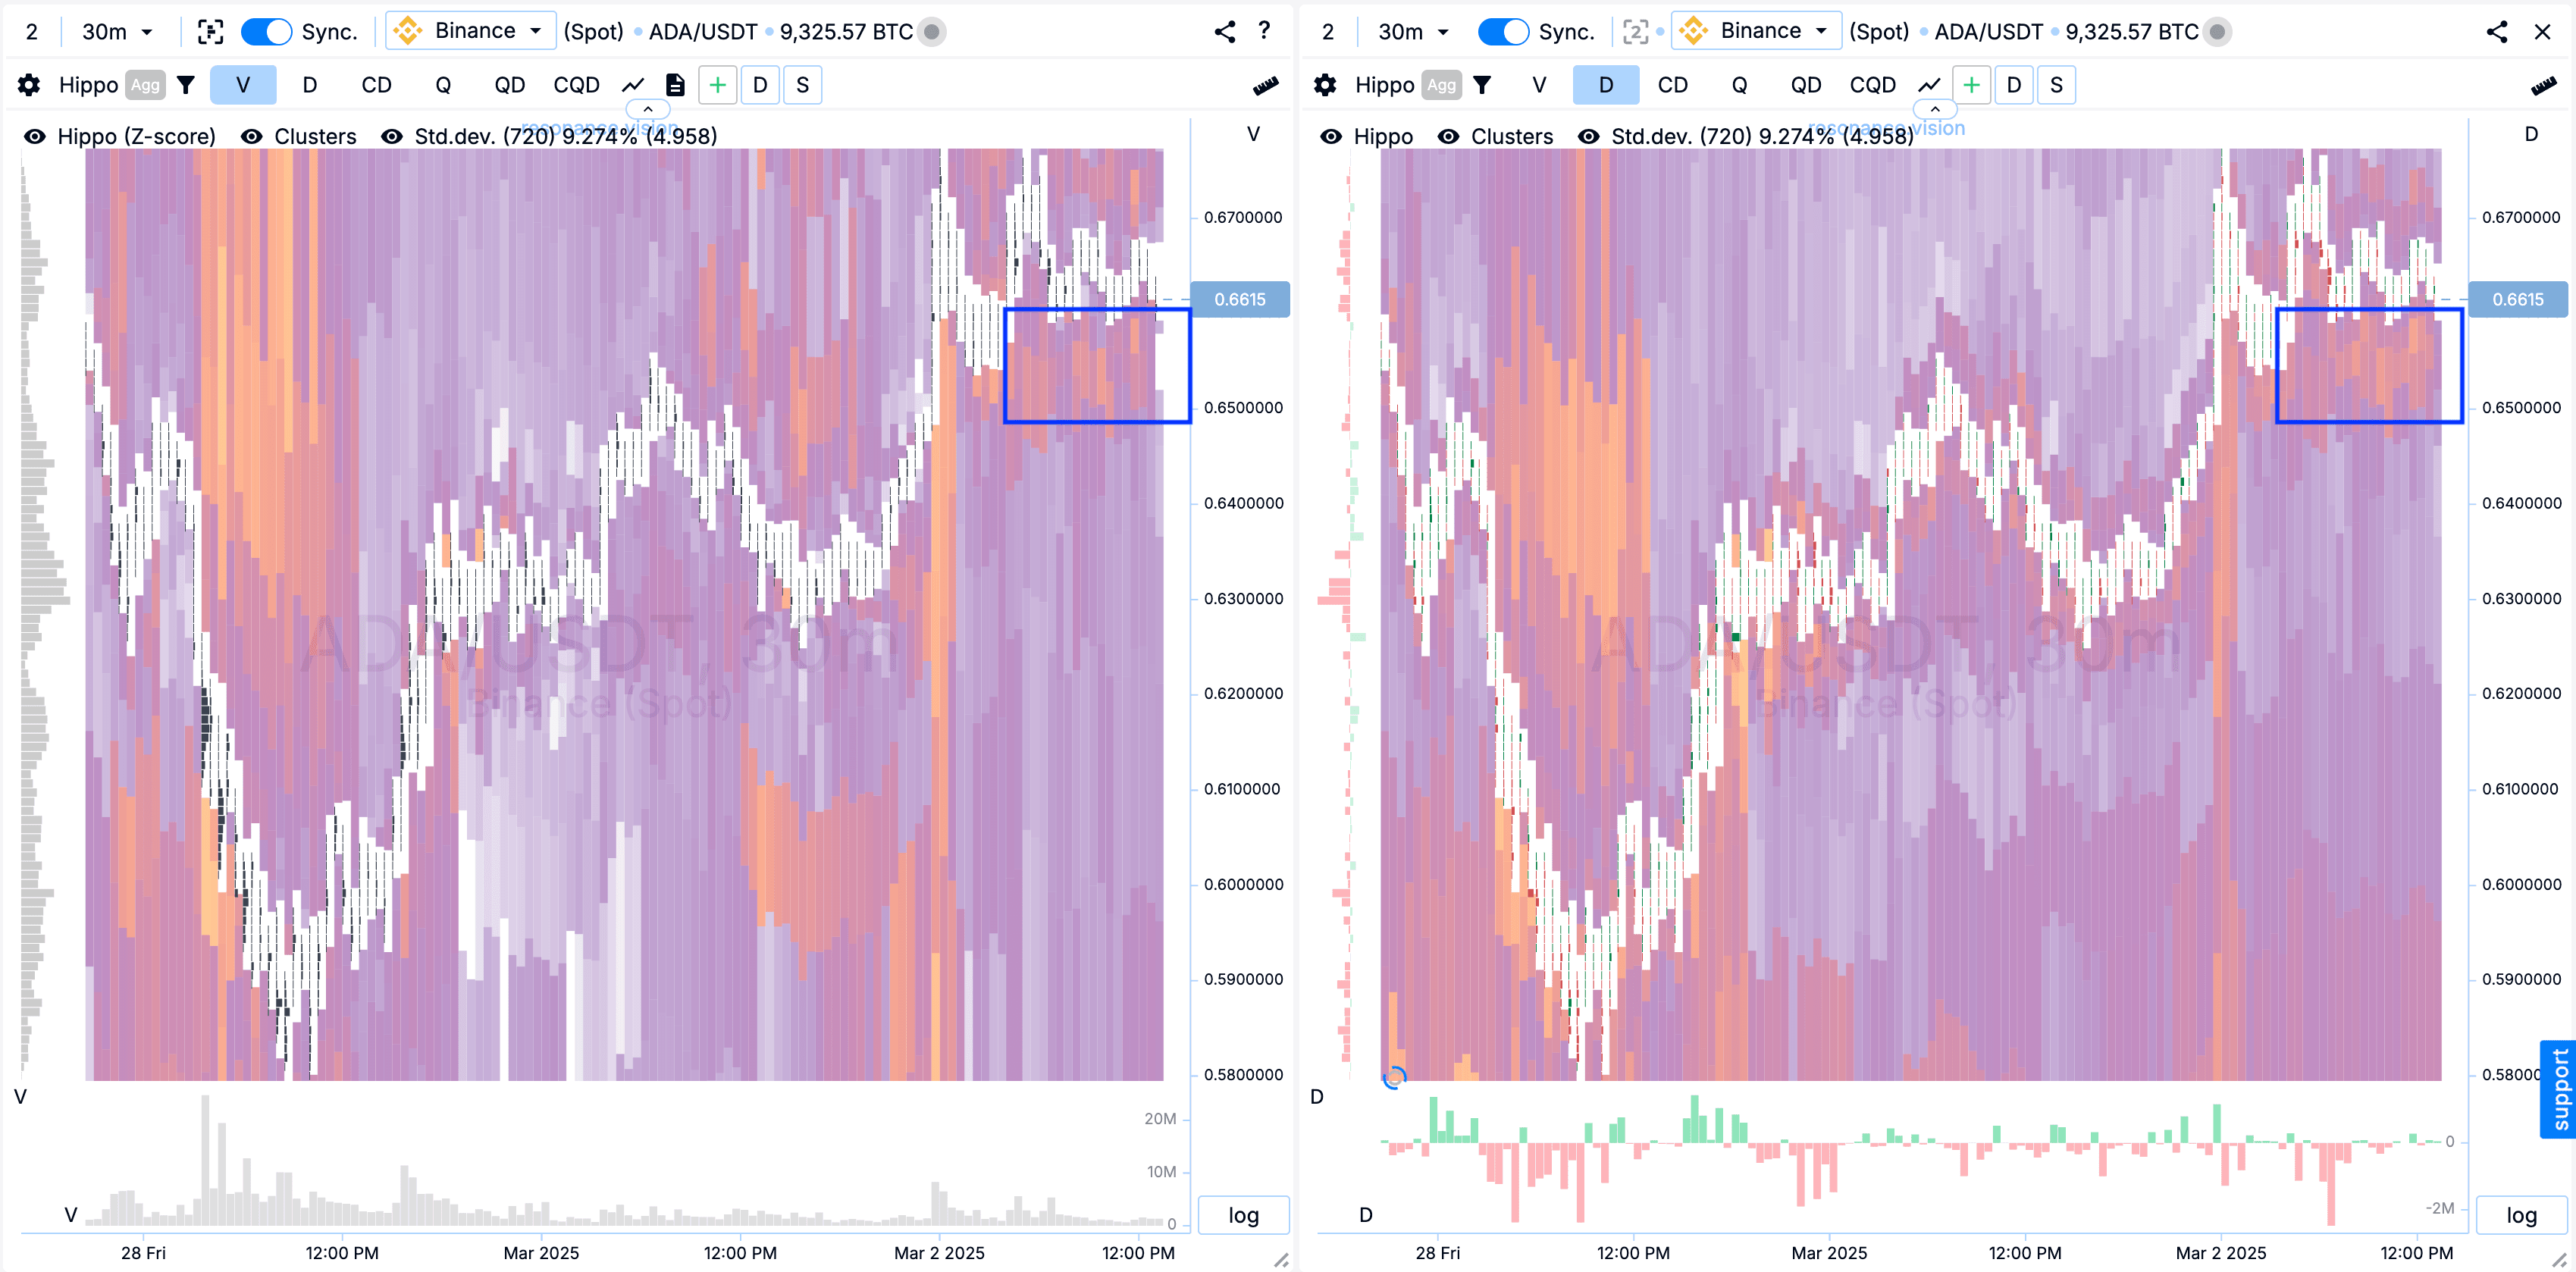
Heat map in Z-Score mode and by volume: Also, abnormal limit clusters in the form of bright spots (marked with rectangles) began to appear under the current price.
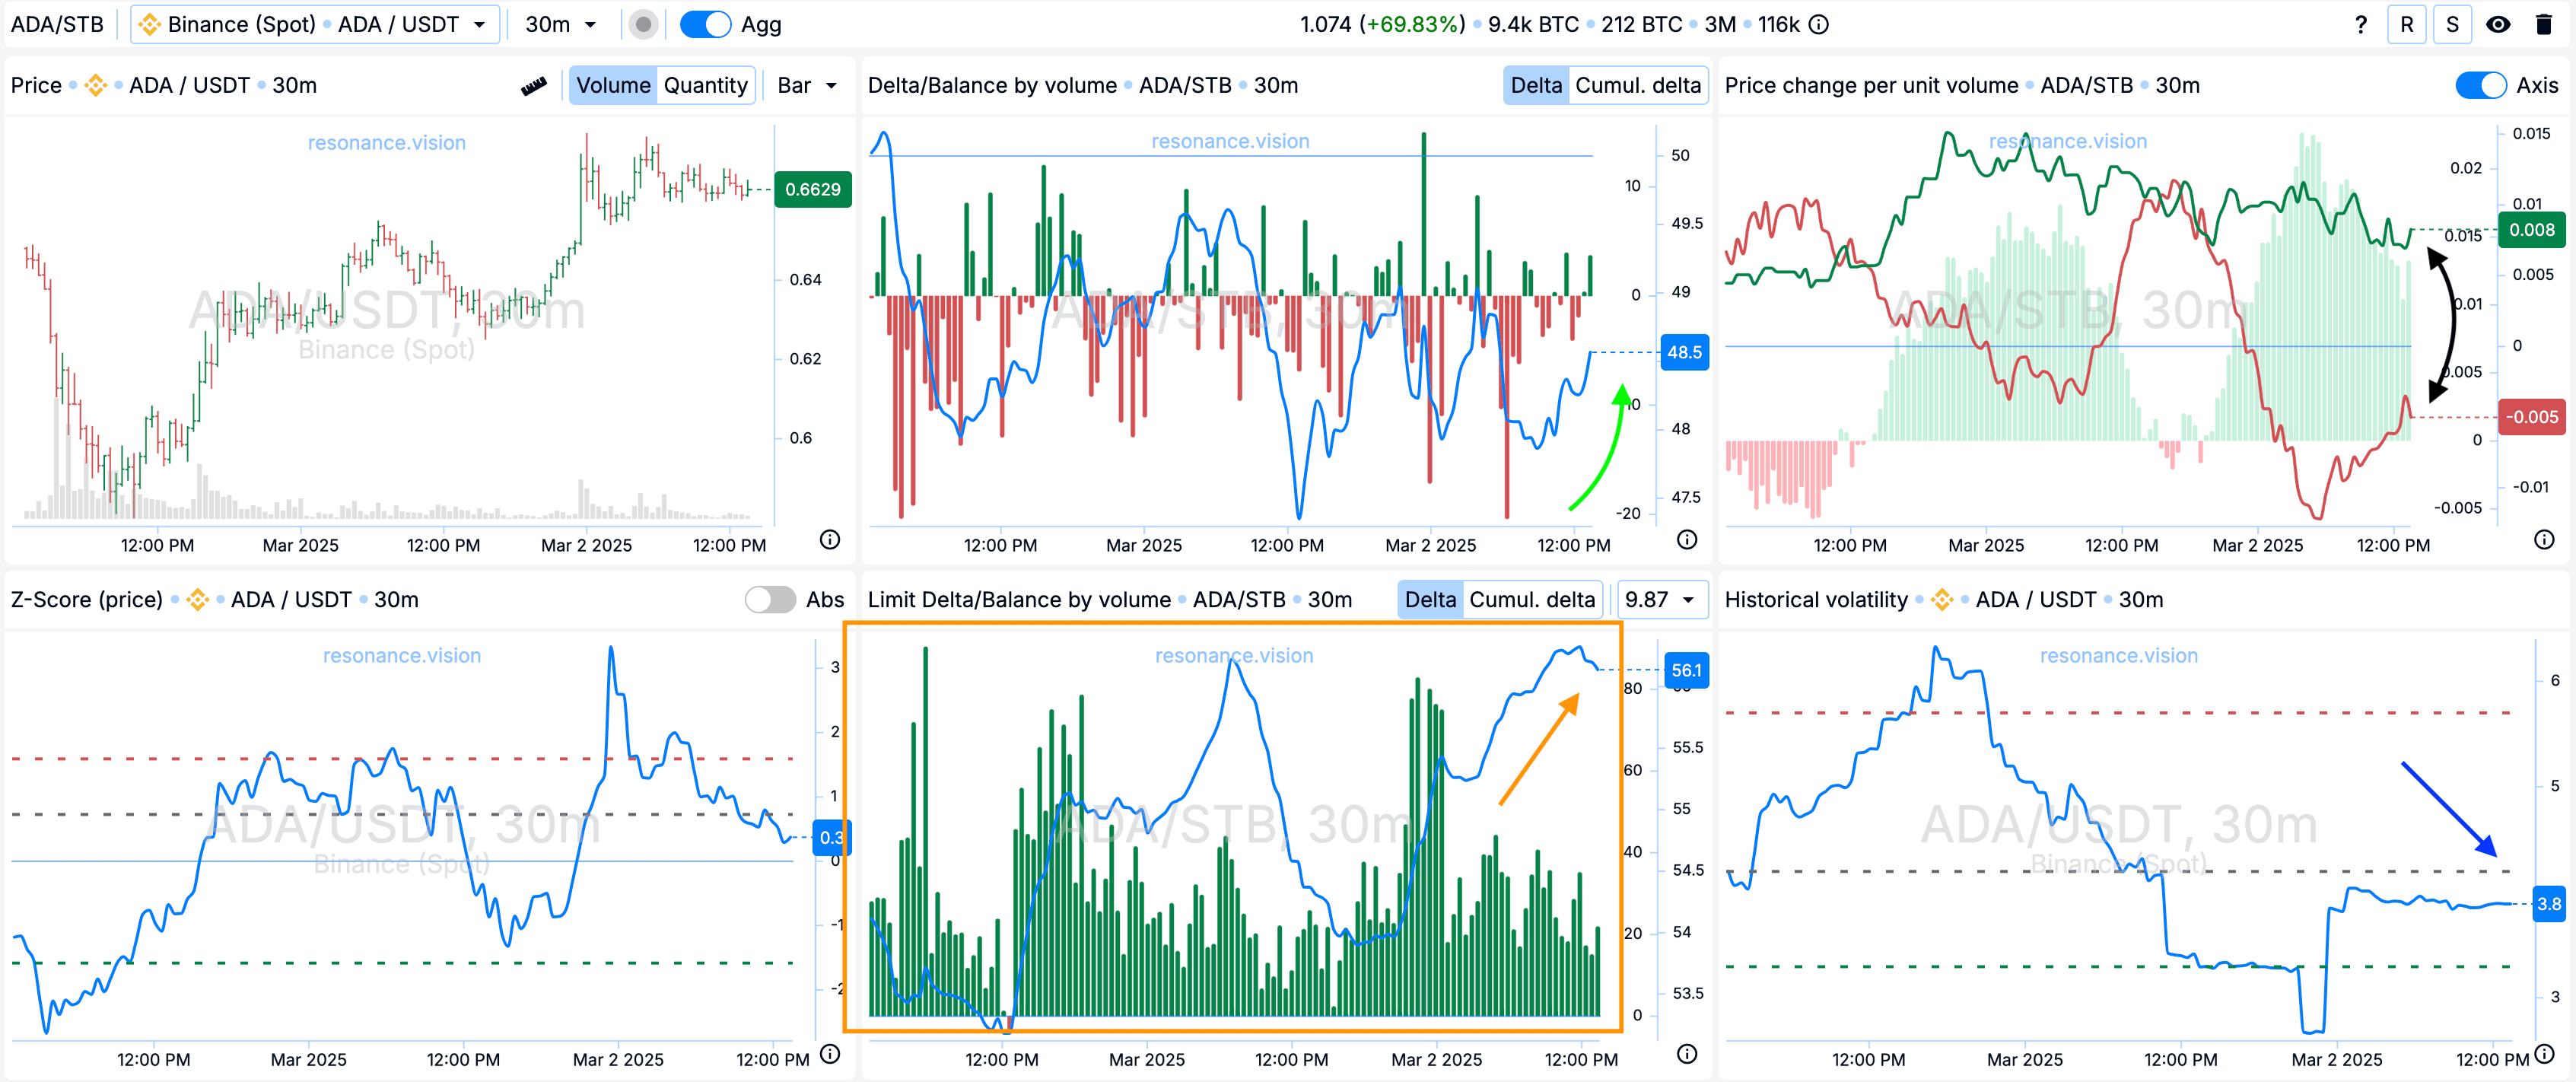
In Dashboard
Delta/Volume Balance: The balance has started to shift towards buyers (green arrow).
Limit Delta/Volume Balance: Limit orders have been dominating sell orders for a long time, this can be seen in the histogram, and the balance is also growing (orange rectangle with an arrow).
Change in price per unit of volume: The pressure of the volume of market purchases on the price change looks more effective in comparison with sales - I noted how the lines continue to diverge (black arched arrow).
Historical Volatility: Volatility is at low values (blue arrow).
Exit Reasons
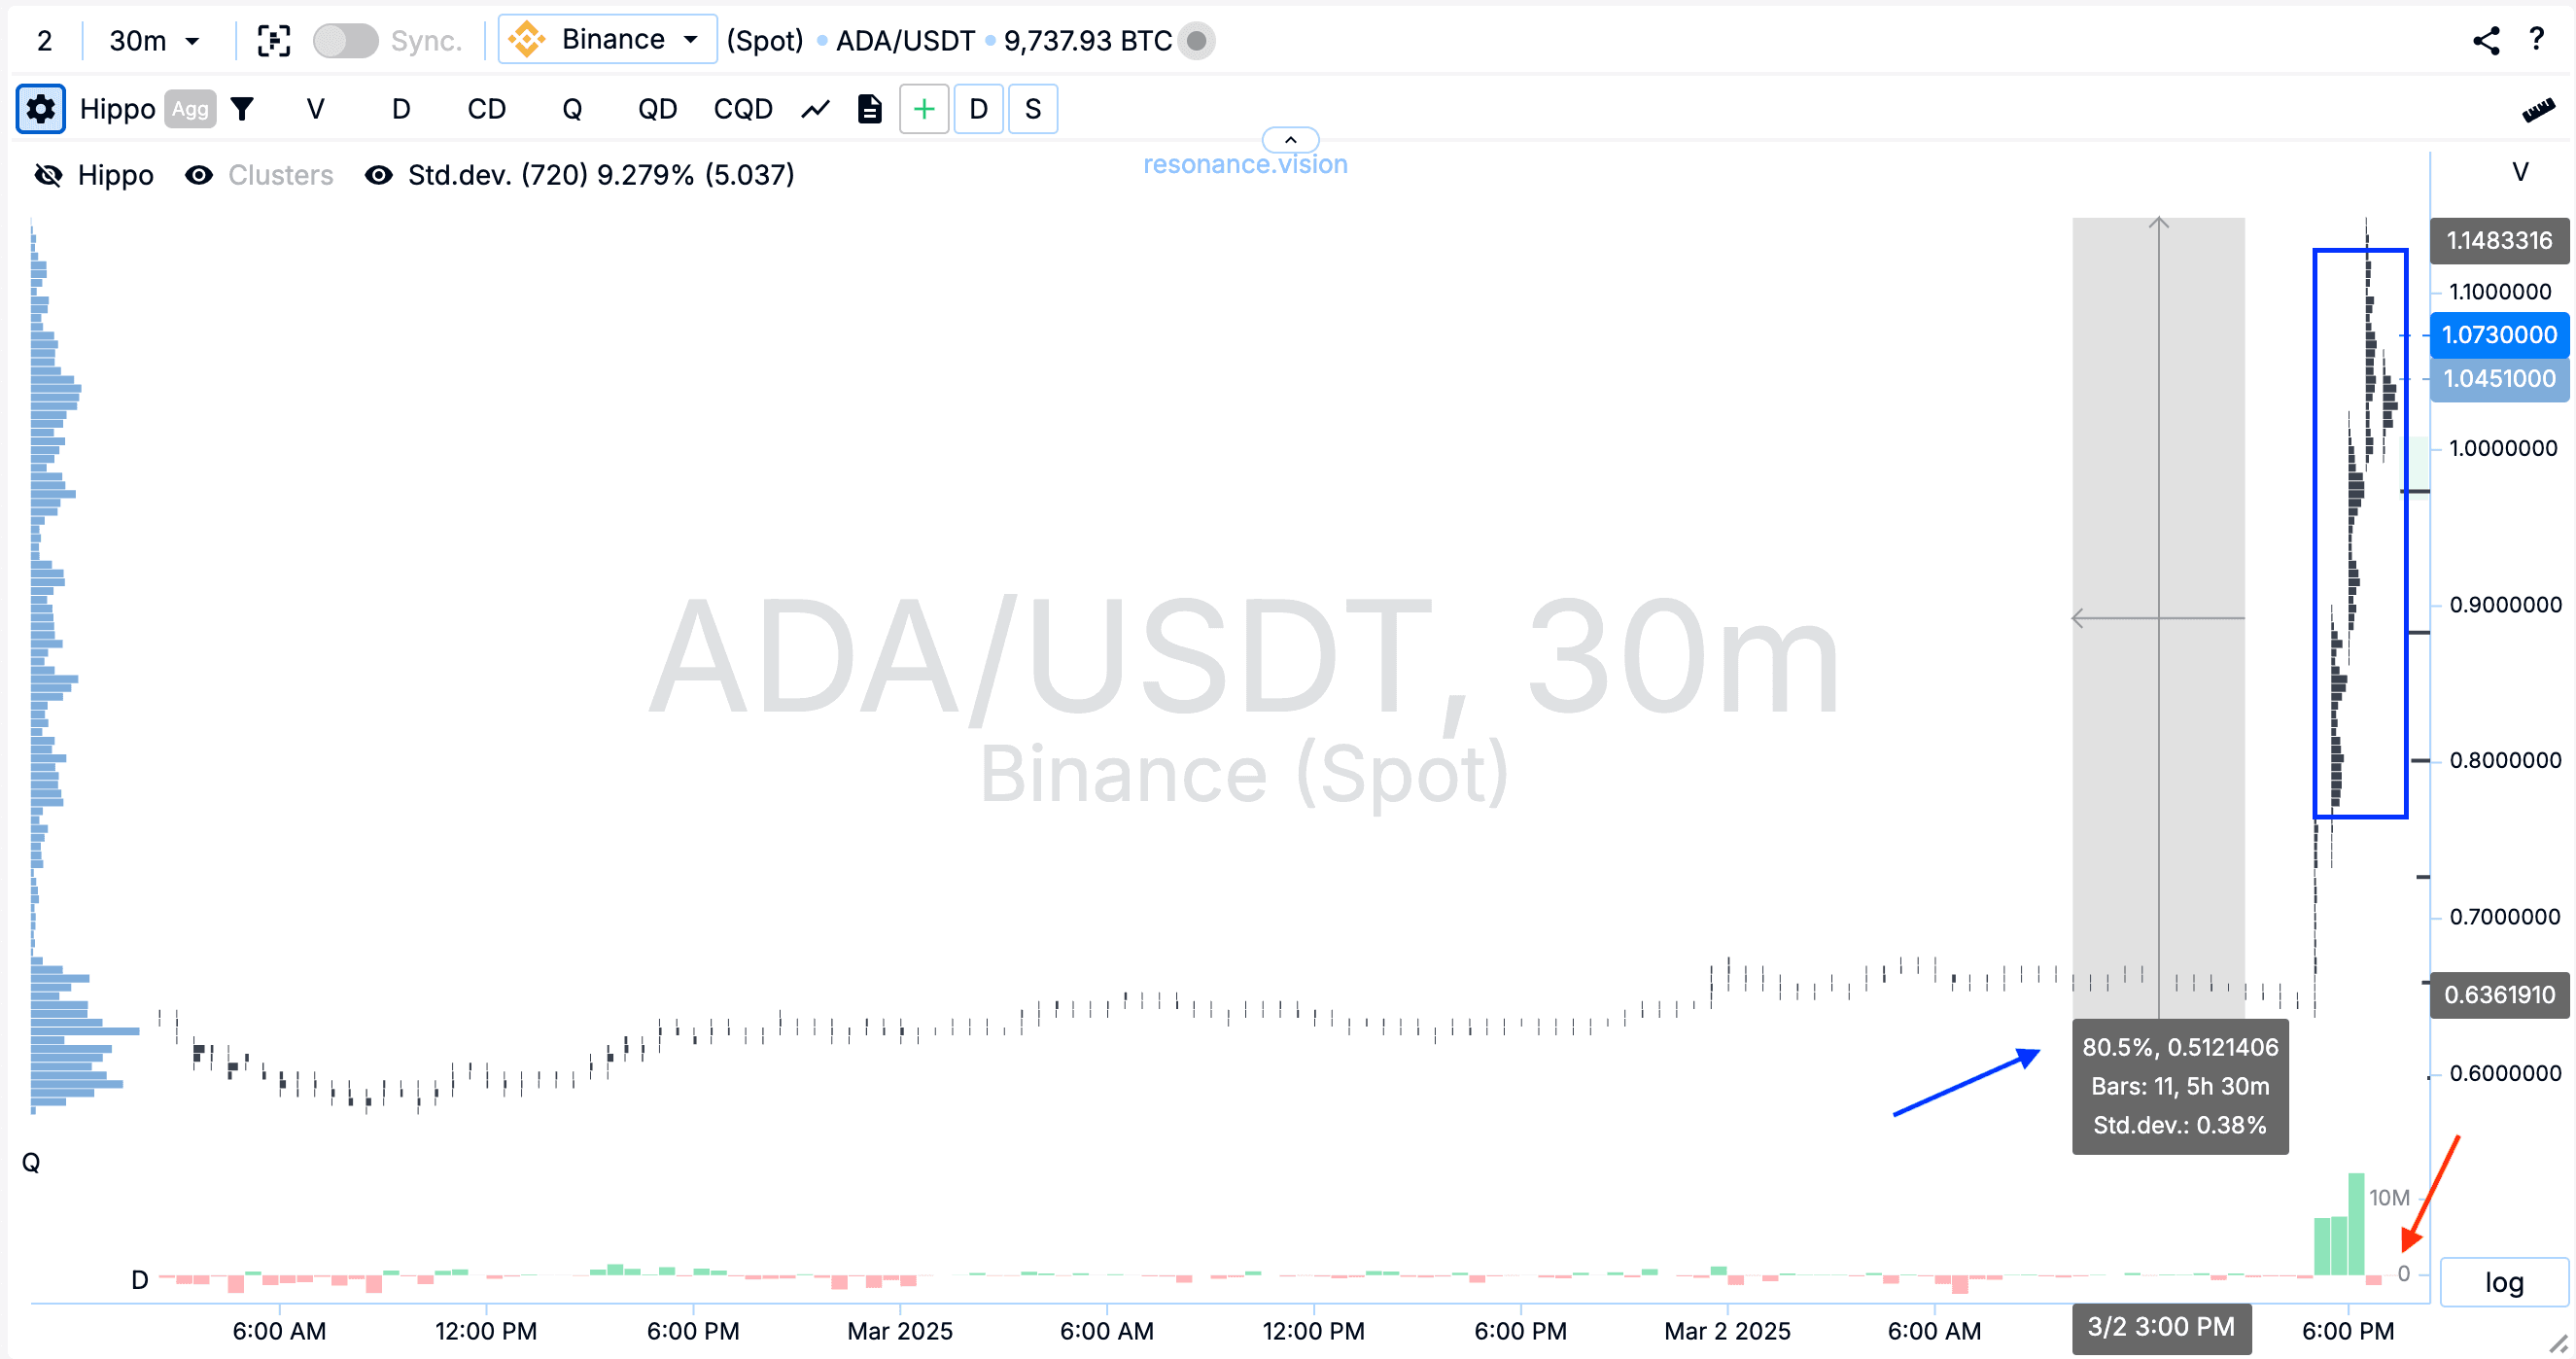
Cluster Chart:
Very large clusters by volume (blue rectangle) were formed and there was a movement of 80% (blue arrow). The delta shows that sell orders began to dominate (red arrow).
In the Dashboard
Delta/Balance by volume: Also aggregated to all pairs, market sales began to prevail (marked with a red arrow).
Limit Delta/Balance by volume: Also for limit orders, they began to substitute more for sale, and the balance is shifting towards sellers (orange arrow).
Change in price per unit of volume: The pressure of the volume of market orders on price change has almost converged - this is visually visible on the chart (black rectangle).
Z-Score (price): Buys have rejected the price by more than 5 standard deviations (blue arrow), which is an abnormal value.
Historical Volatility: Volatility has increased significantly (blue arrow).
Result
We managed to secure a profit of +4227.66%.
Conclusion
The deal perfectly illustrates how large sales volumes without the proper impact on the price can indicate a local deficit. Additional confirmation was provided by abnormal limit accumulations and indicators from the Dashboard.
Taking profits was justified, as market sales began to dominate, volatility increased significantly, and the price reached an abnormal deviation.
Such situations prove that analyzing volumes and their effectiveness makes it possible to timely determine entry and exit points, minimizing risks and increasing potential profit, and the profit in this deal was more than excellent.
Follow new articles in our telegram channel.
No need to invent complex schemes and look for the "grail". Use the Resonance platform tools.
Register via the link — get a bonus and start earning:
OKX | BingX | KuCoin.
Promo code TOPBLOG gives you a 10% discount on any Resonance tariff plan.
Recommended articles


