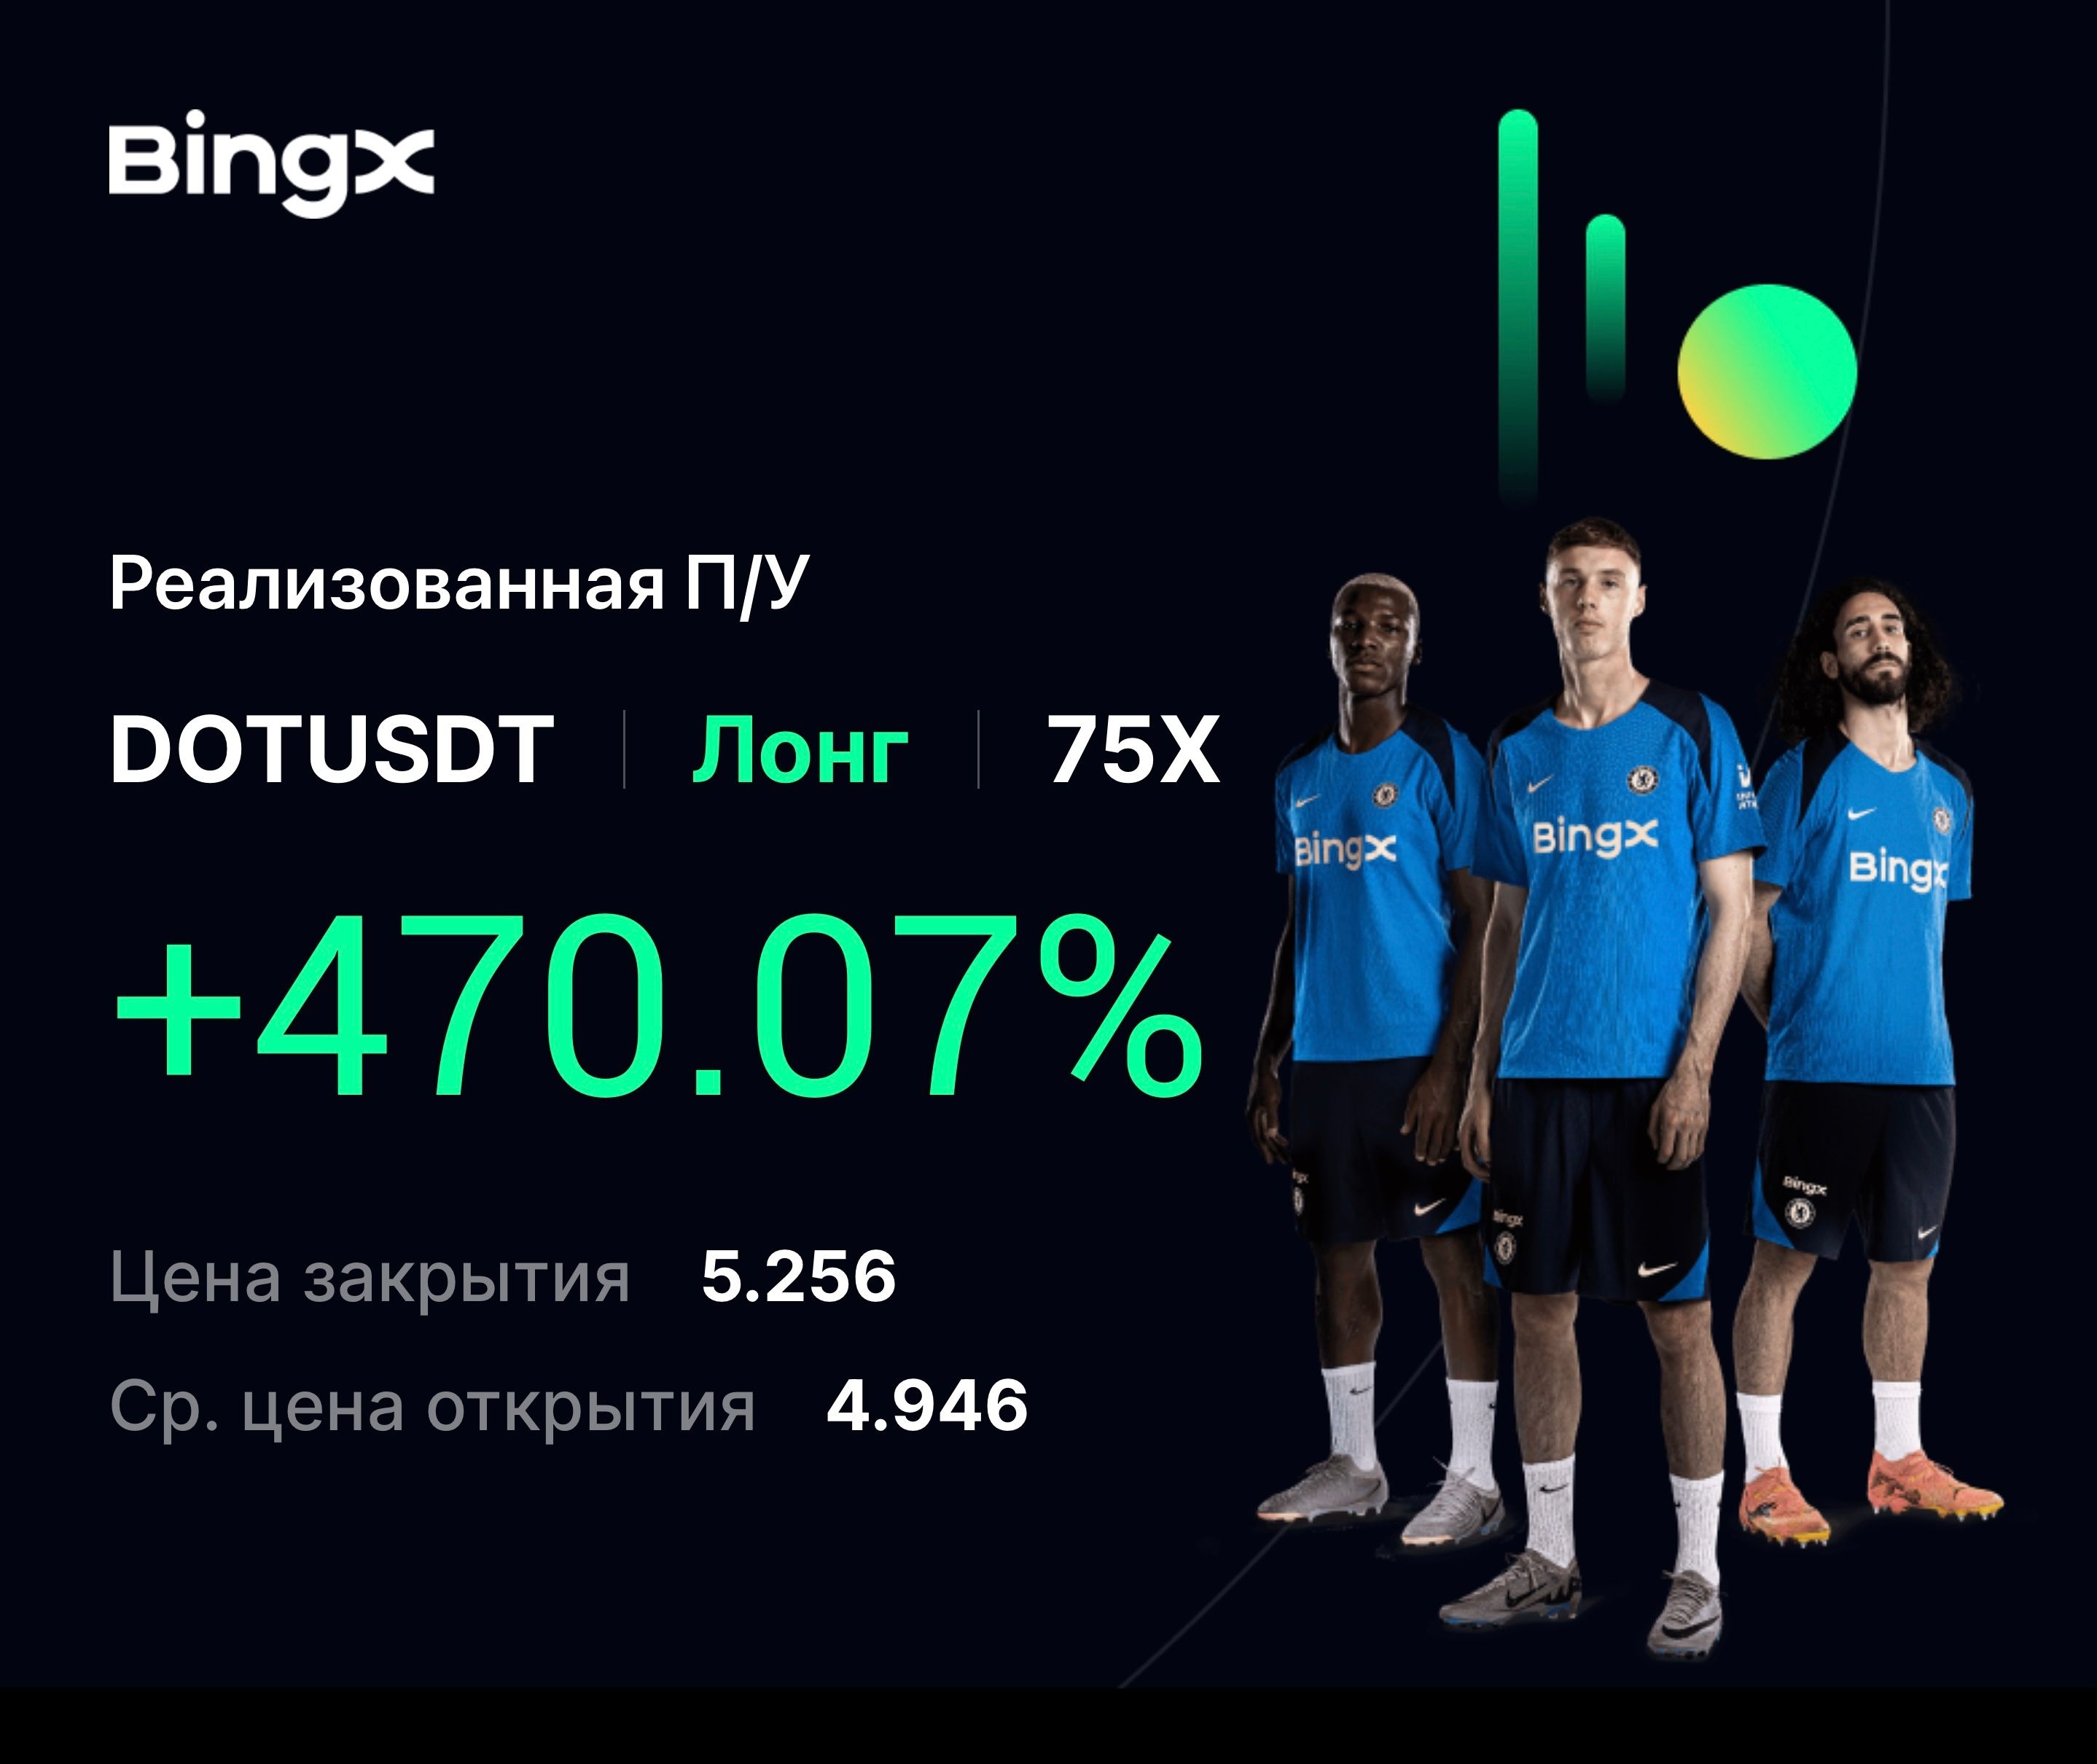
DOT +470.07% (Resonance Directional Strategy)

Low-risk DOT/USDT trade analytics that even a beginner can understand.
Entry was justified by volume growth without price reaction to sales and supported by the assessment from the heat map and Dashboard.
Exit - against the backdrop of increased sales, the appearance of limit densities from above and a price deviation of more than 3 tbsp. deviation.
Result: +470.07% profit. A great example of how volume analysis helps make informed decisions.
Table of contents

Coin: DOT/USDT
Risk: low
Understanding level: beginner
Reasons to enter
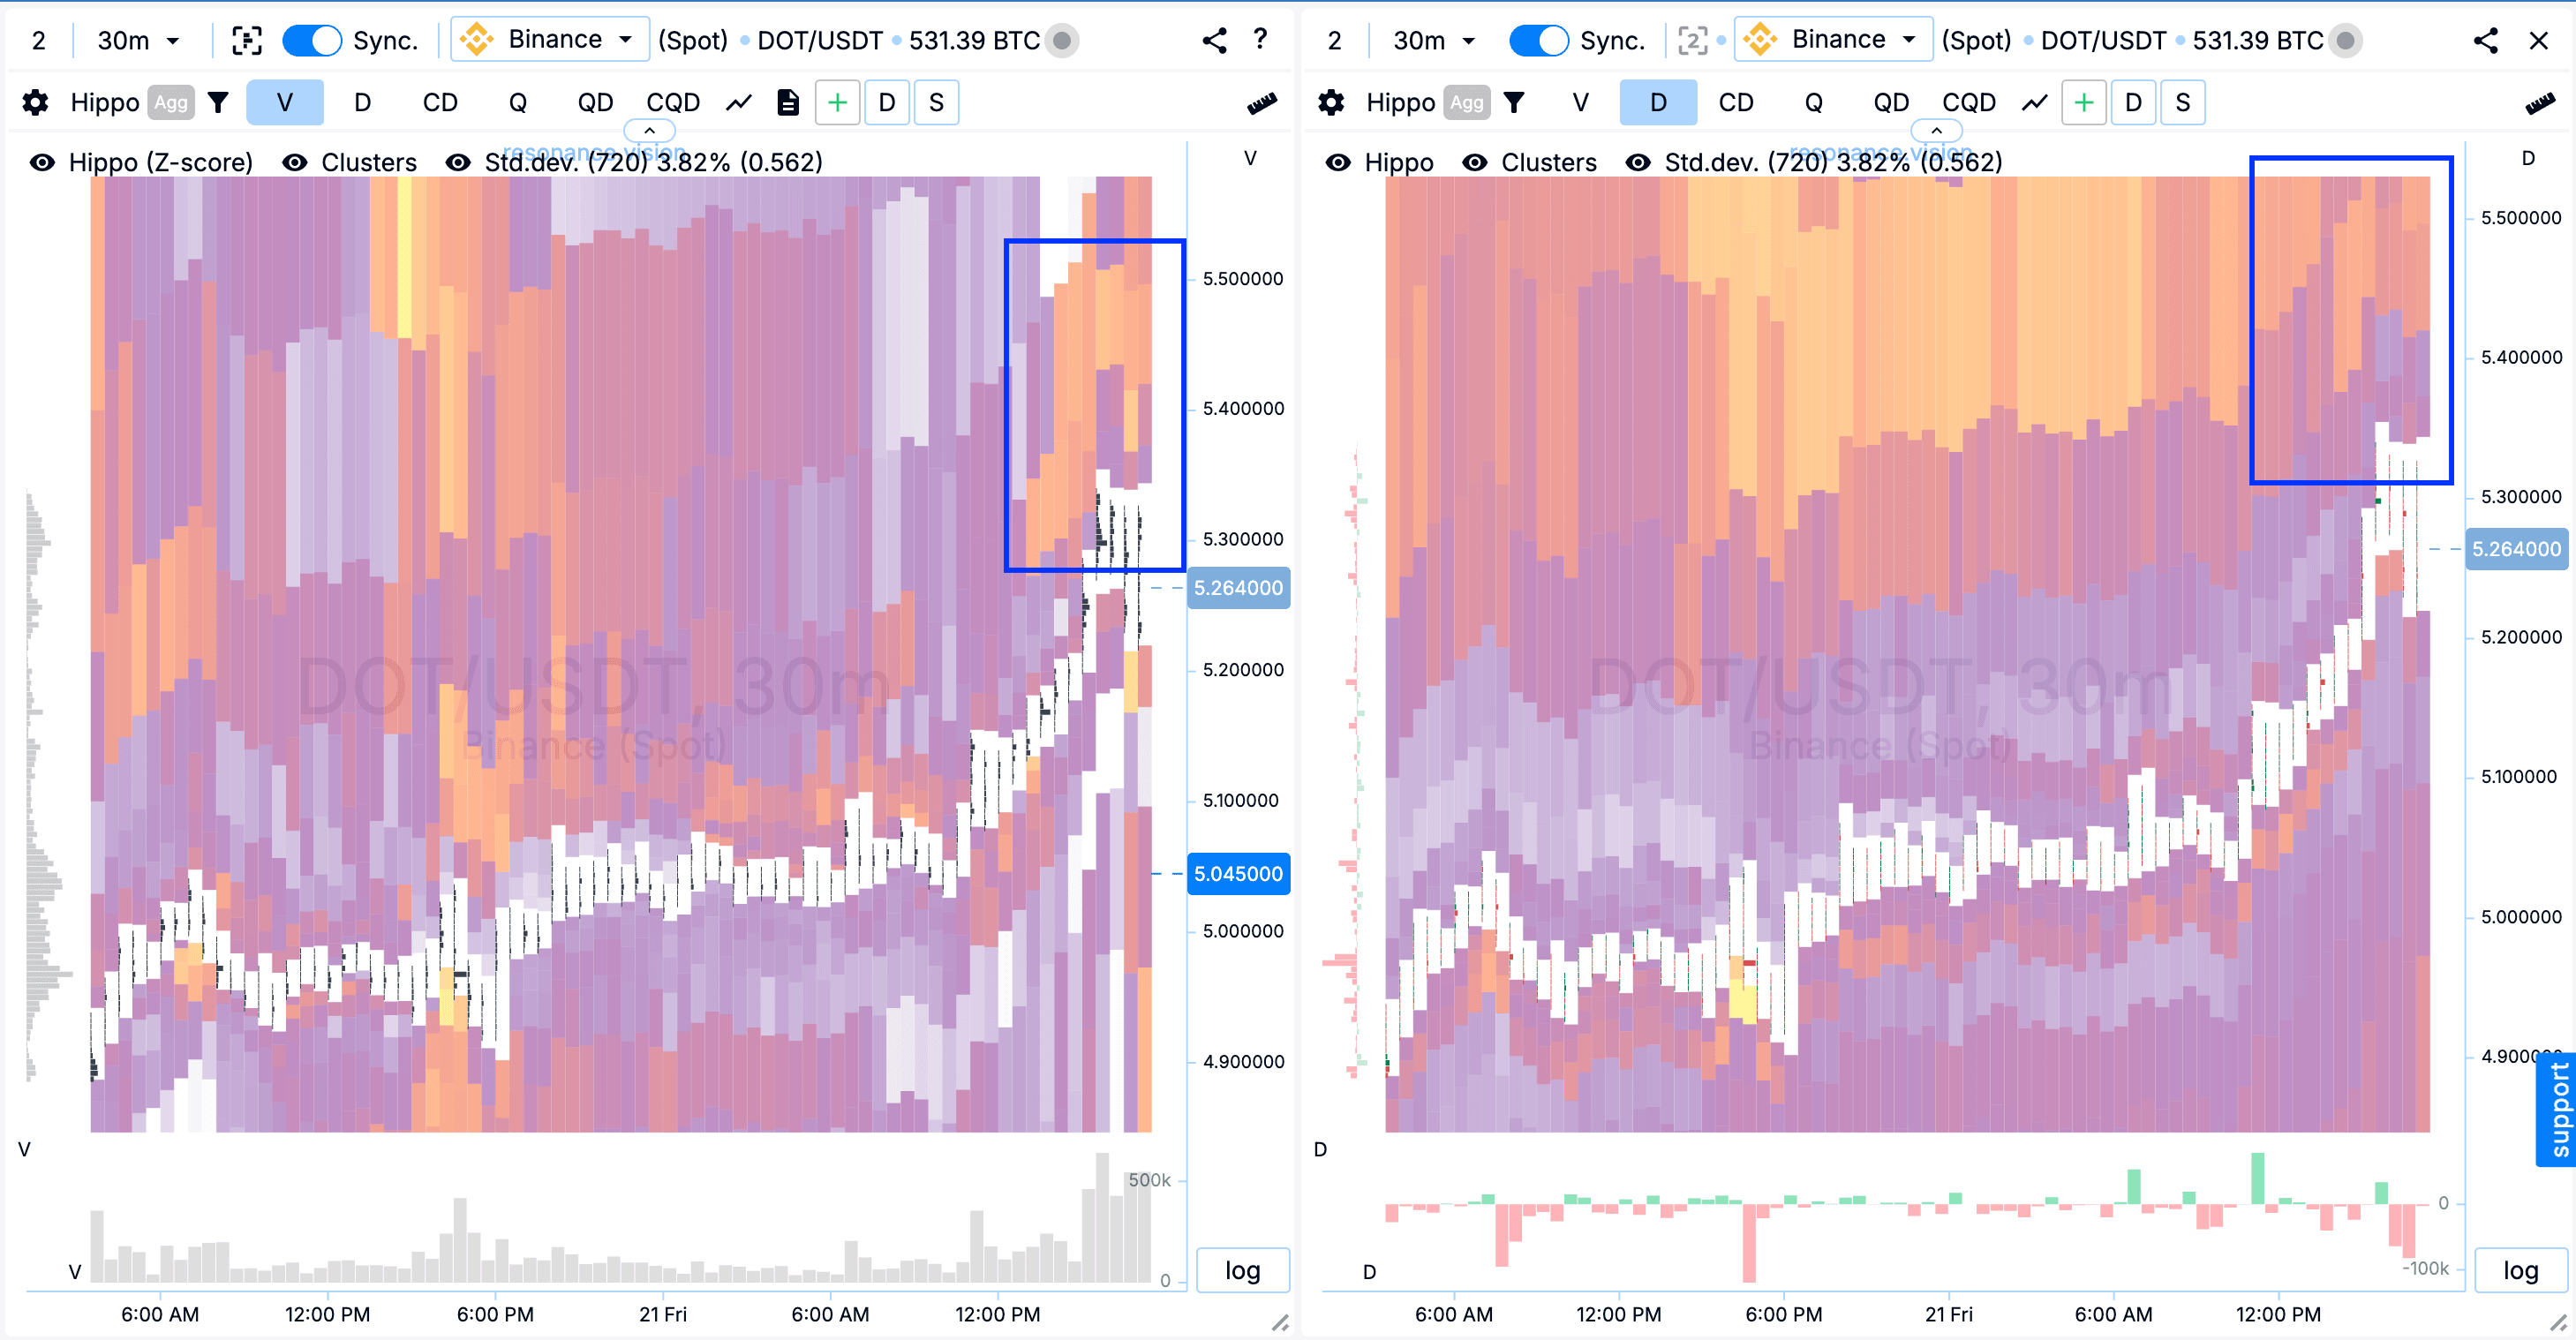
Cluster chart:
As the price rose, the traded volume increased, this can be seen from the formed clusters (blue rectangle).
Volume sales (red rectangle with an arrow) did not lead to a significant price decrease.
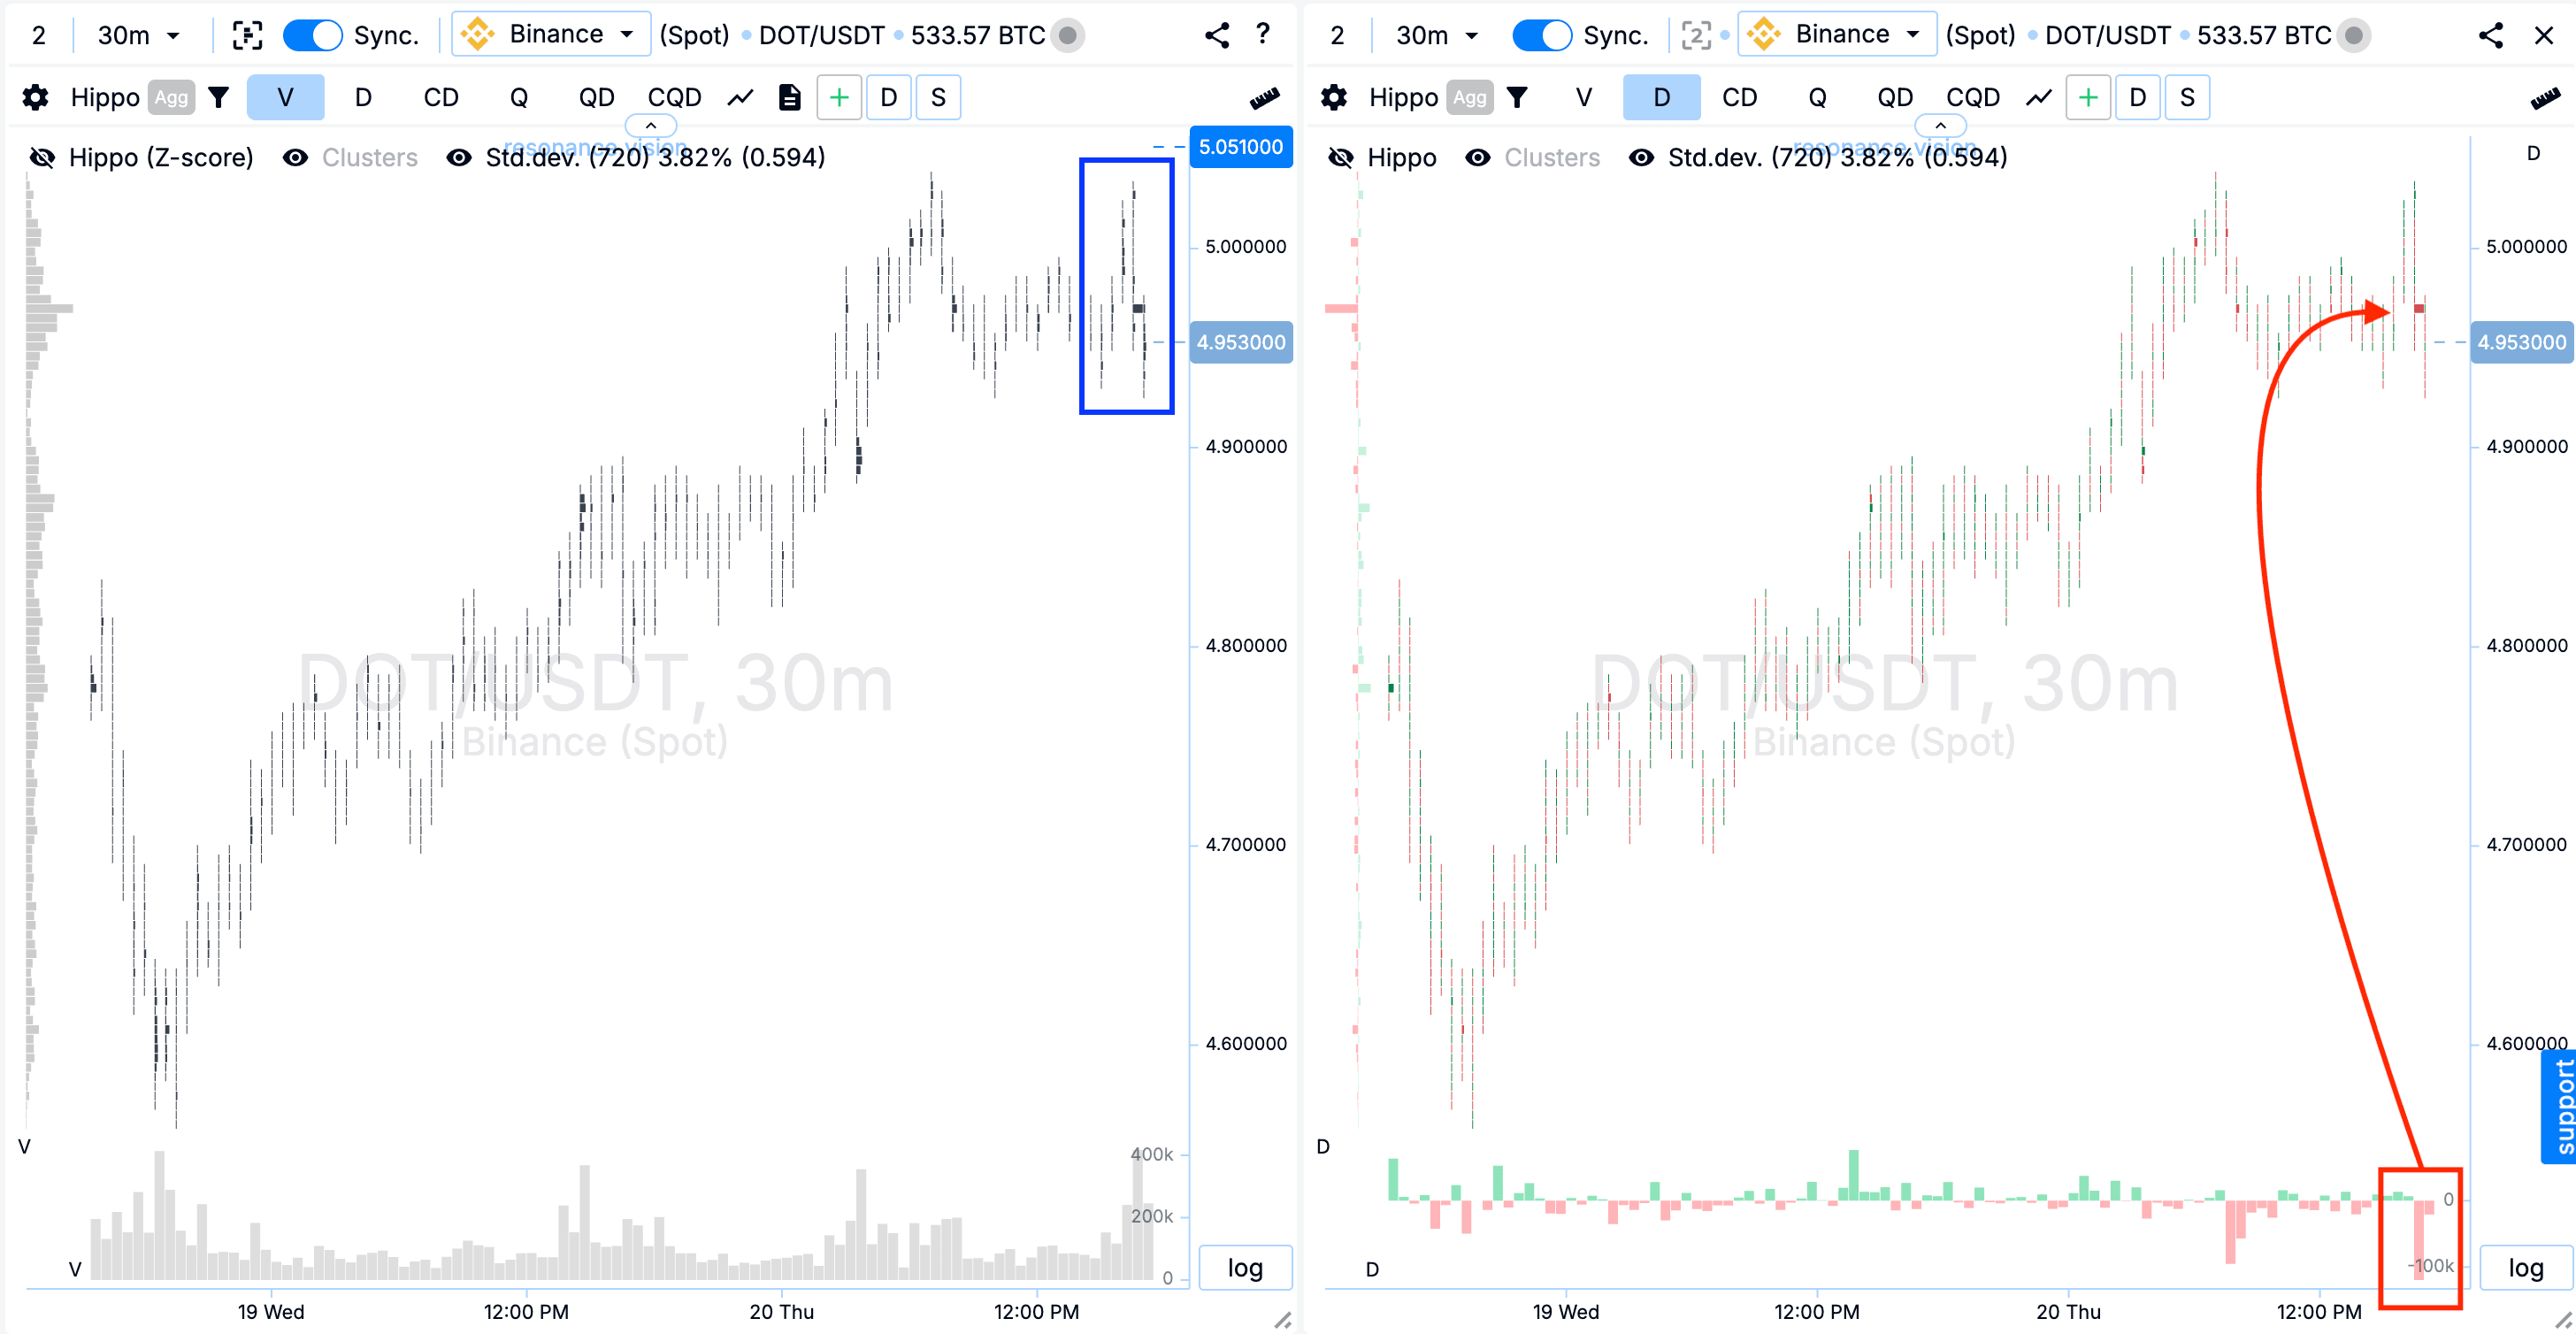
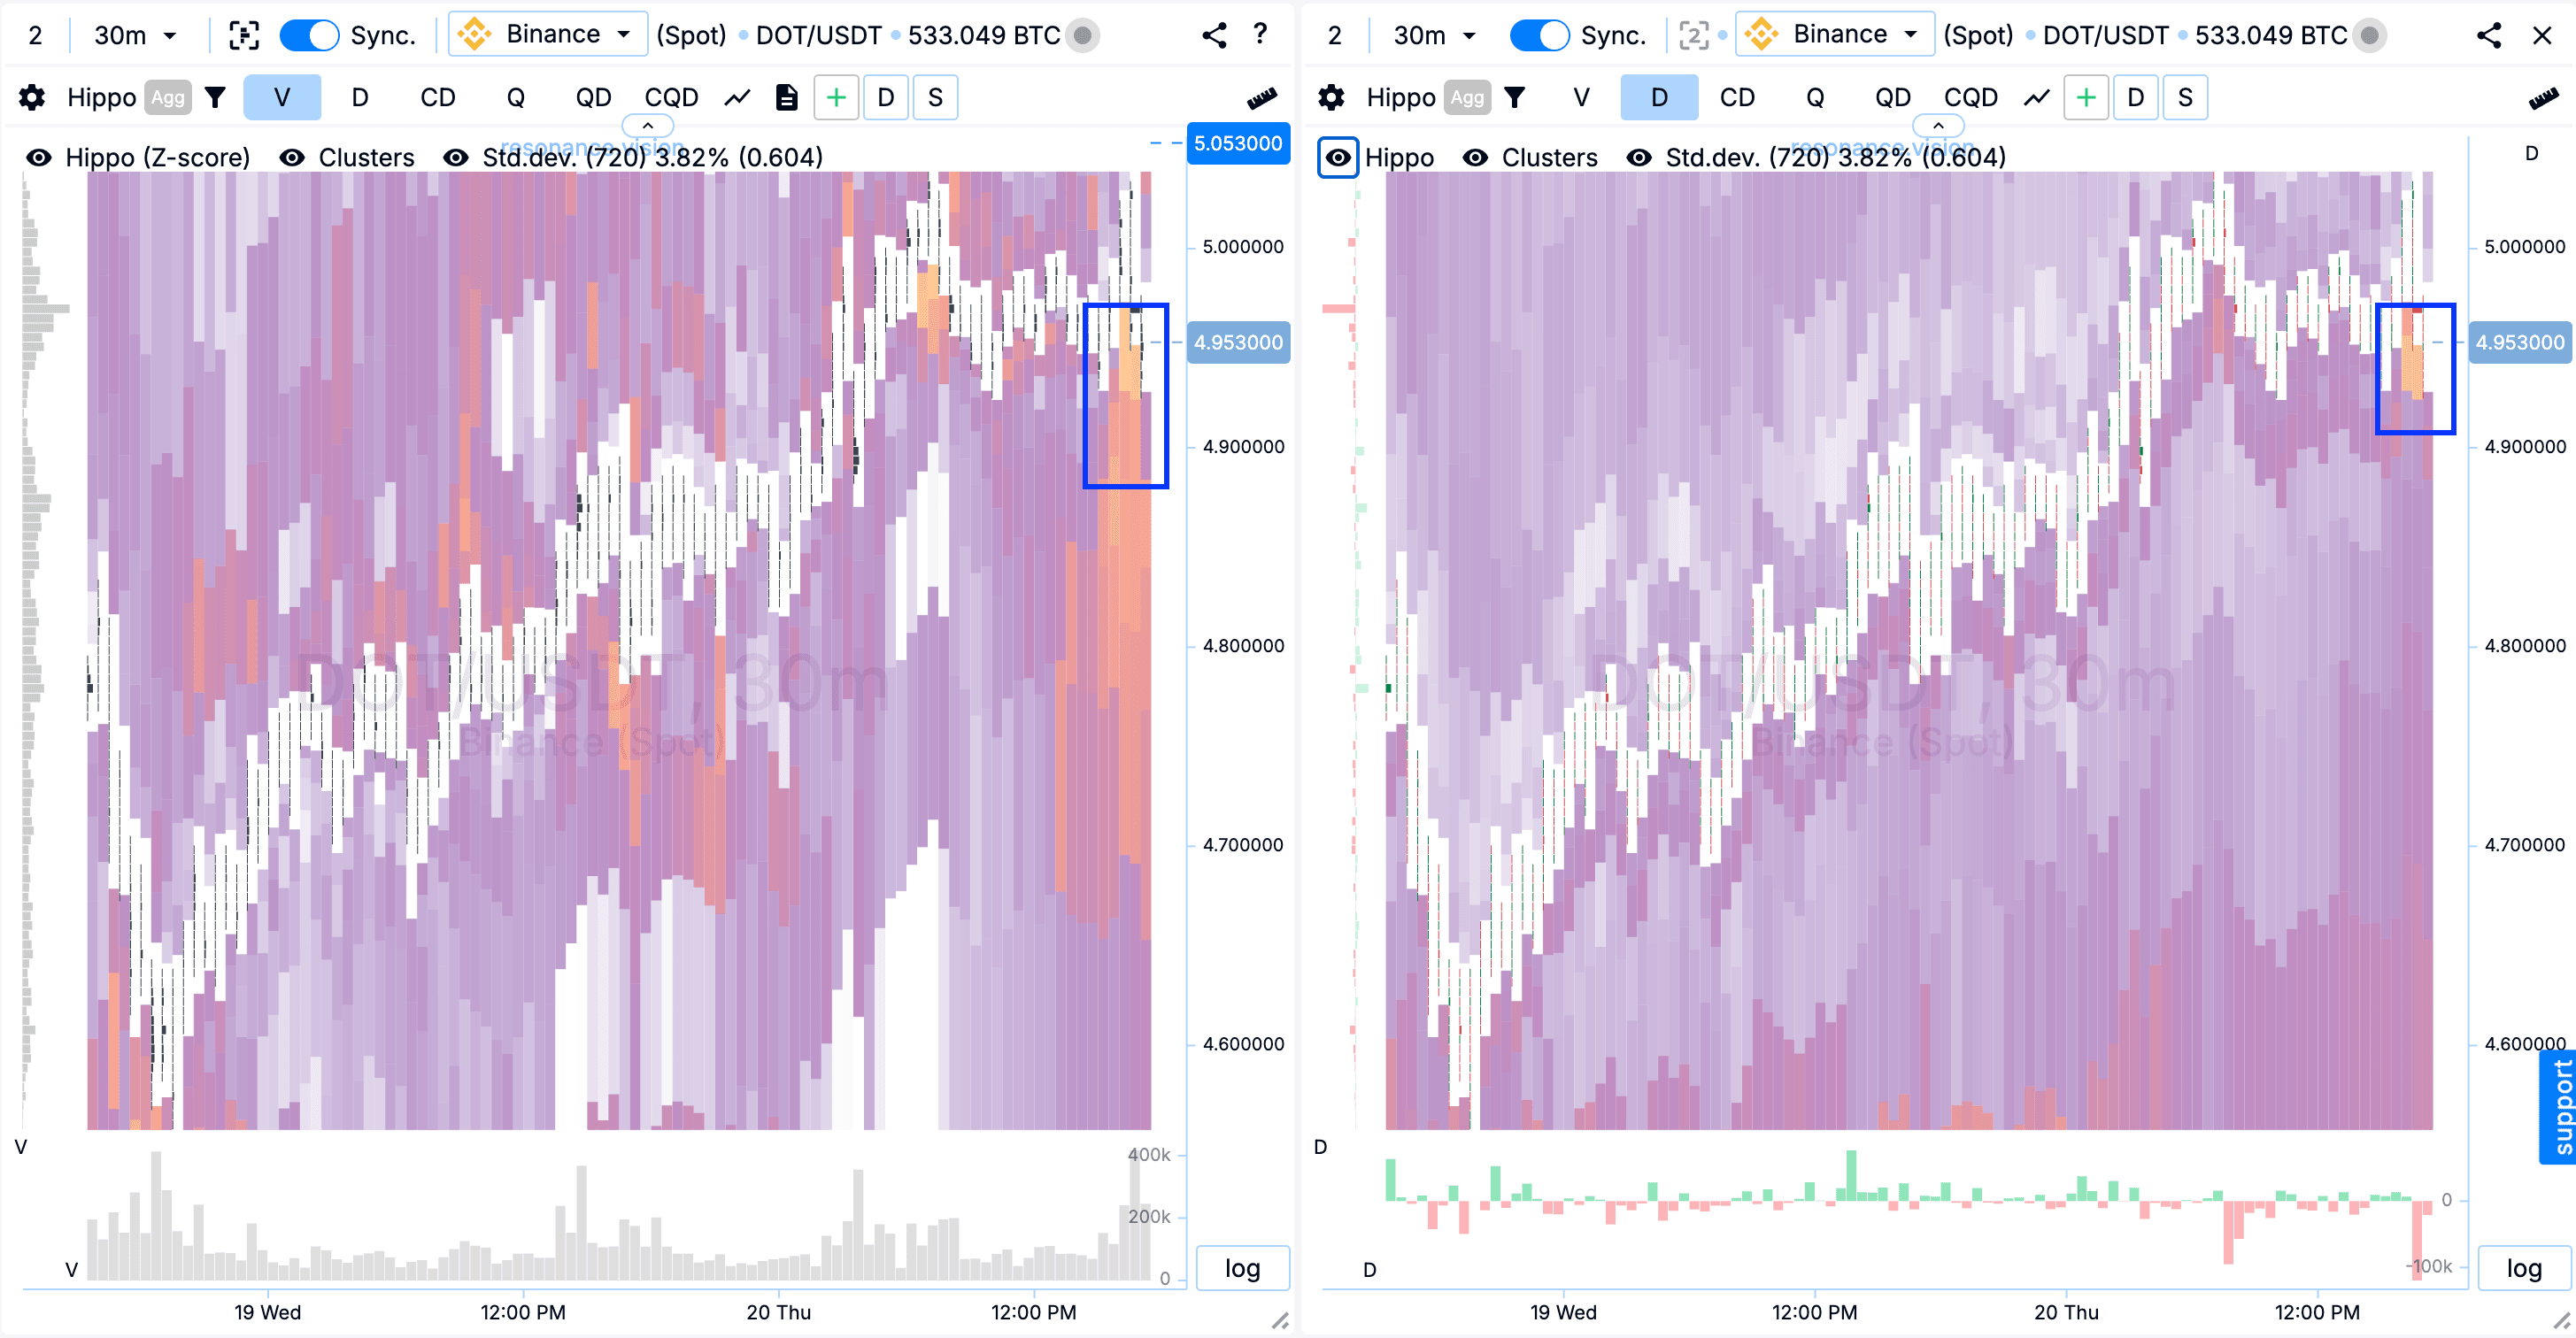
Heat map in Z-Score mode and by volume: Also, abnormal limit clusters in the form of bright spots began to appear under the current price (marked with rectangles).
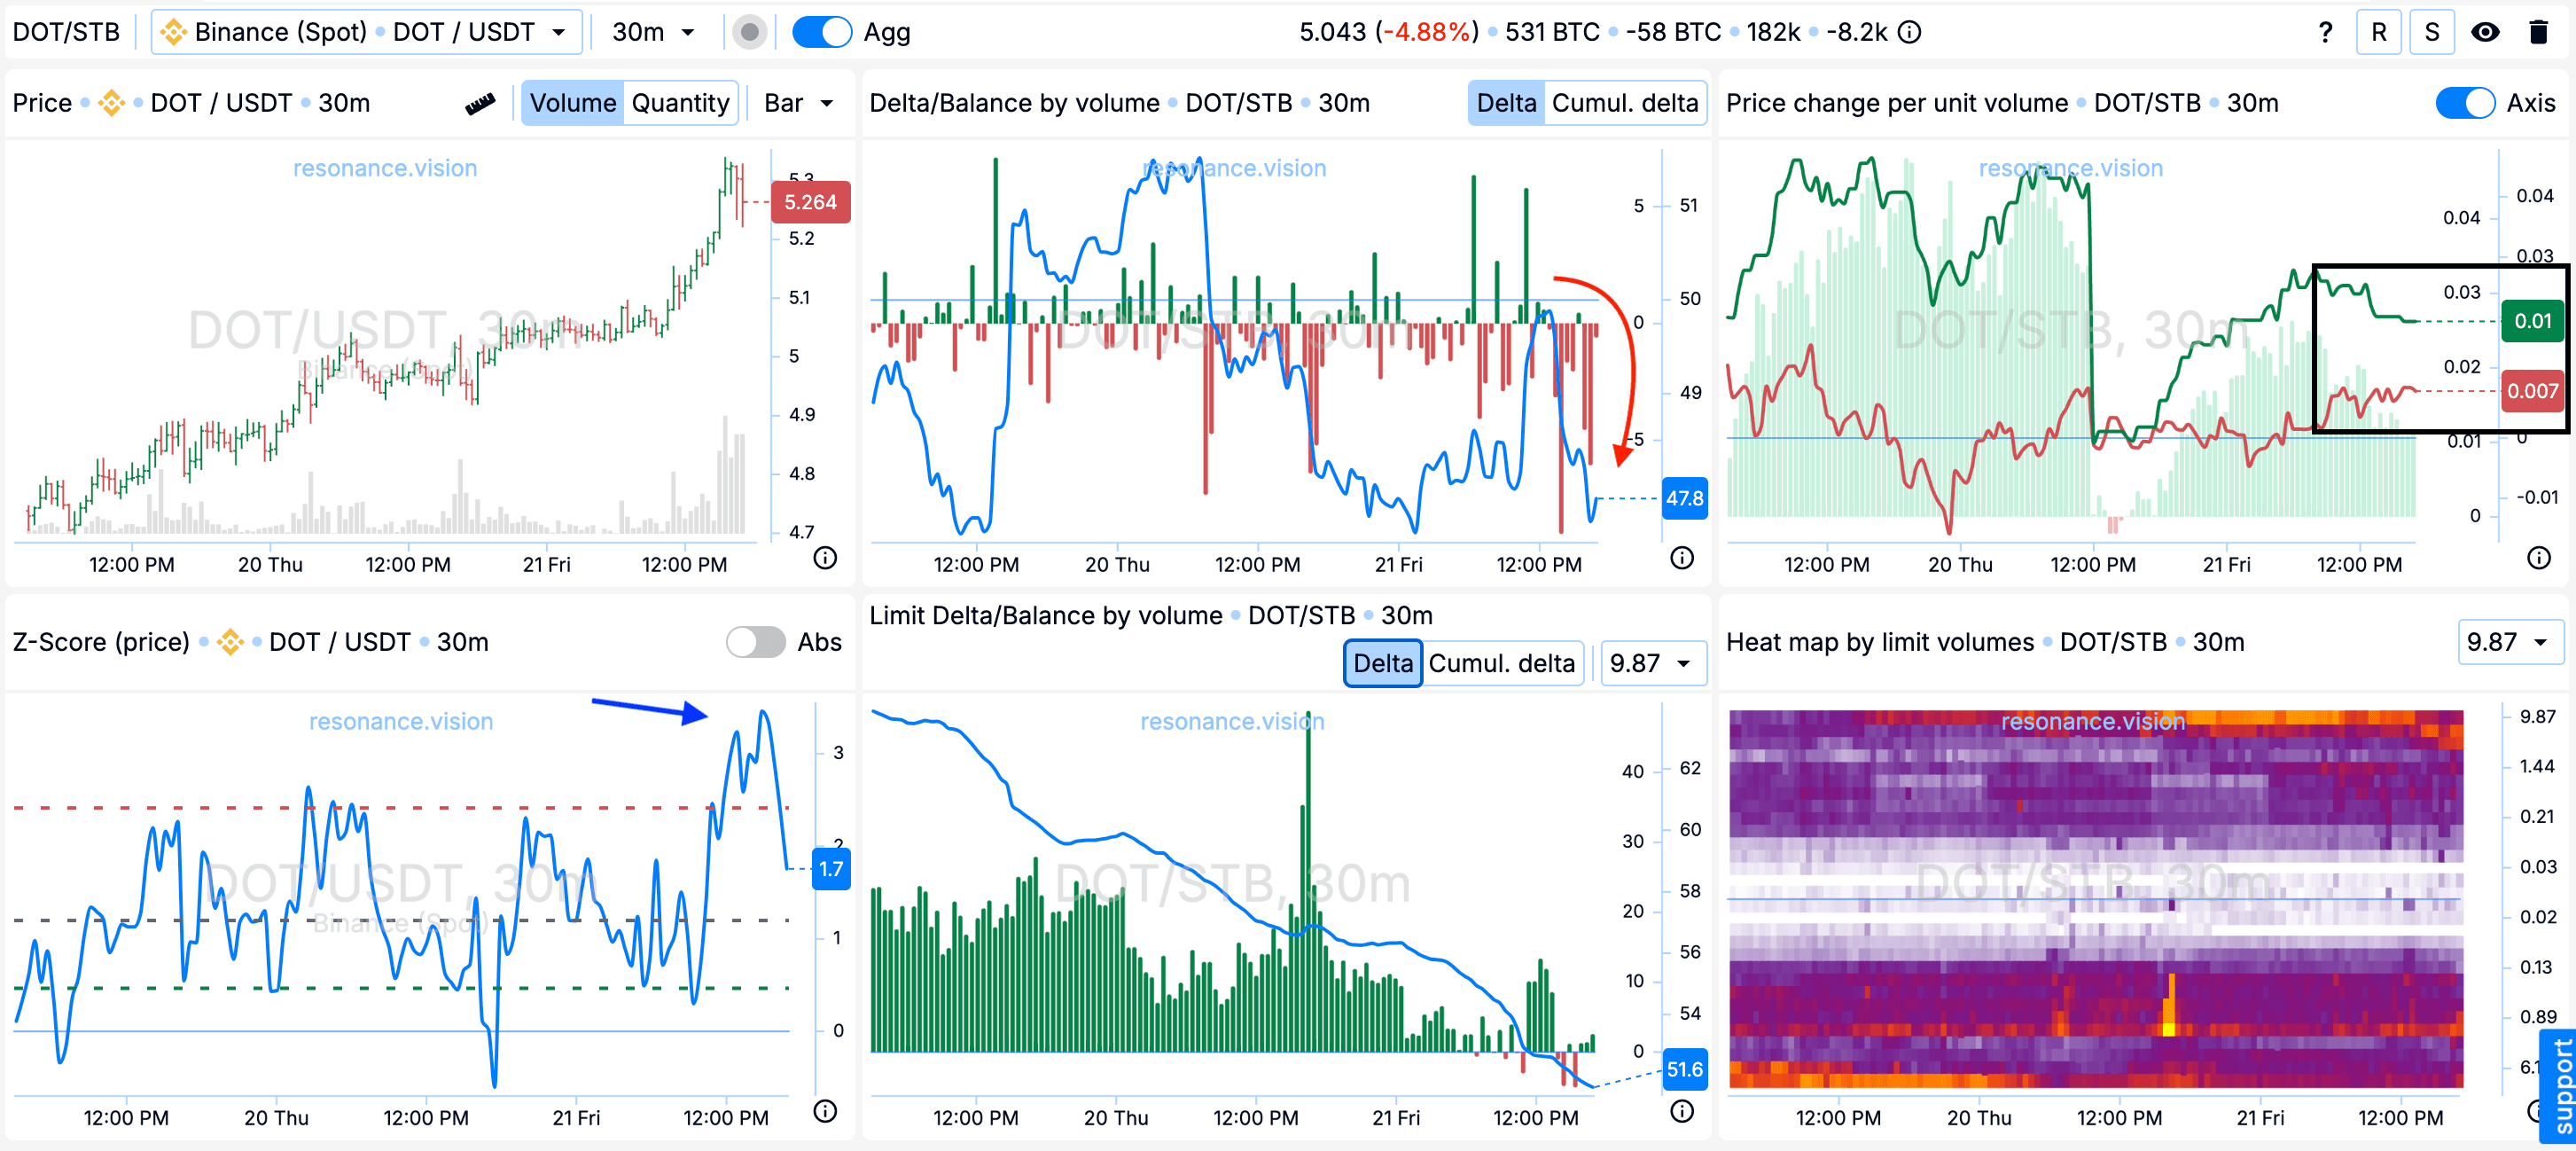
In Dashboard
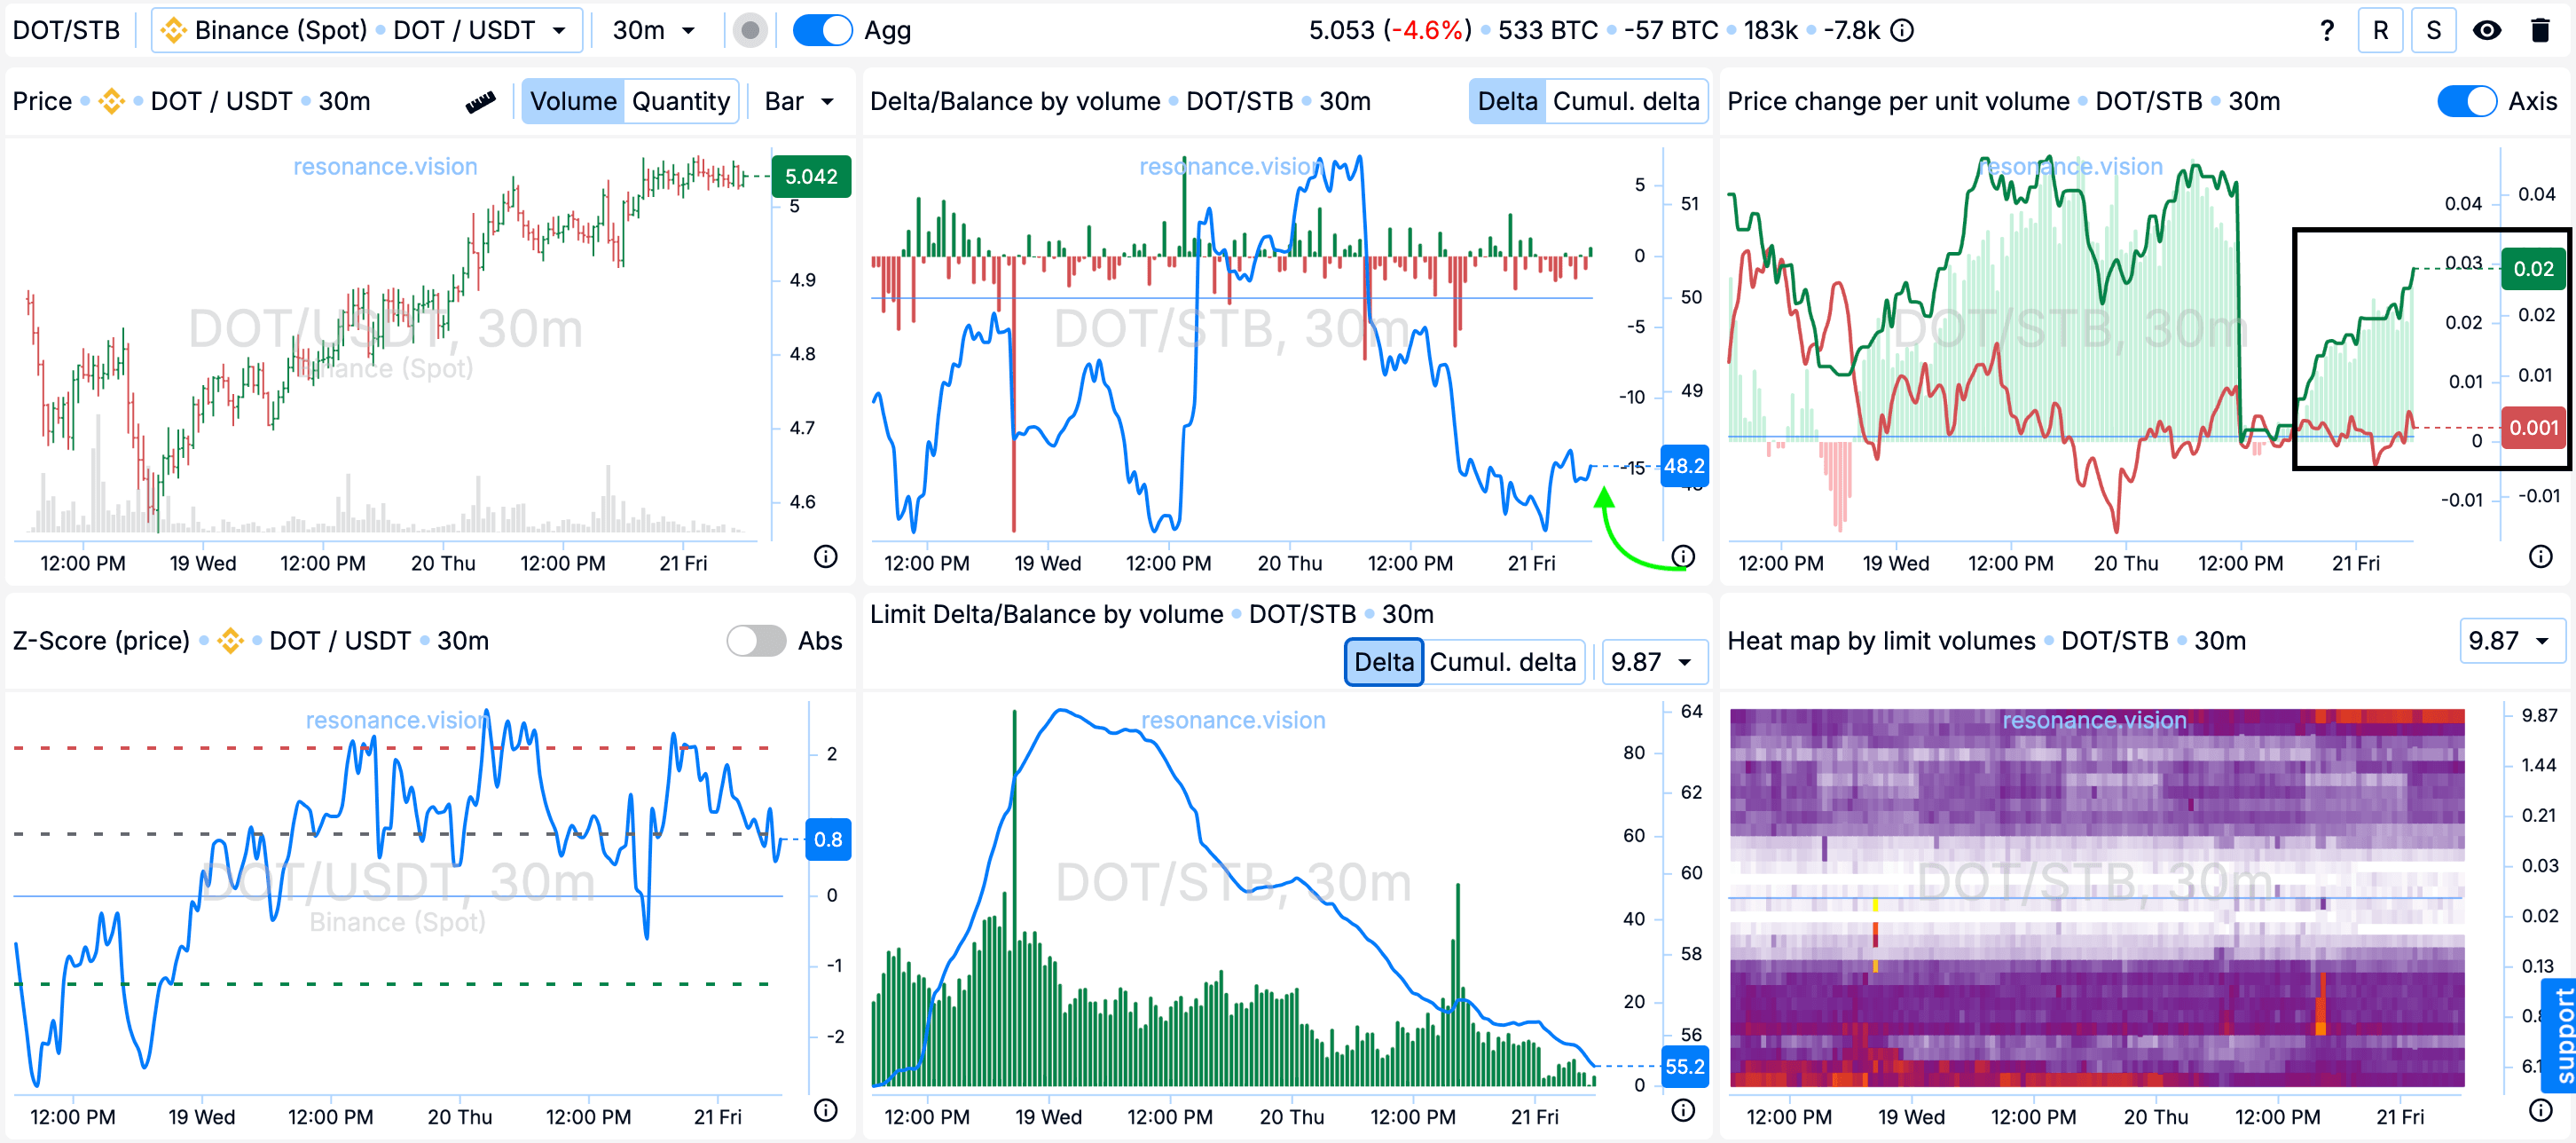
Delta/Balance by volume: Aggregated to all pairs, sales dominate, but the price is no longer falling, and the balance has begun to shift towards buyers (marked with a green arrow).
Change in price per unit of volume: Pressure from the volume of market purchases on price changes looks more effective in comparison with sales - noted how the lines began to diverge (black rectangle).
Exit reasons
Cluster chart:
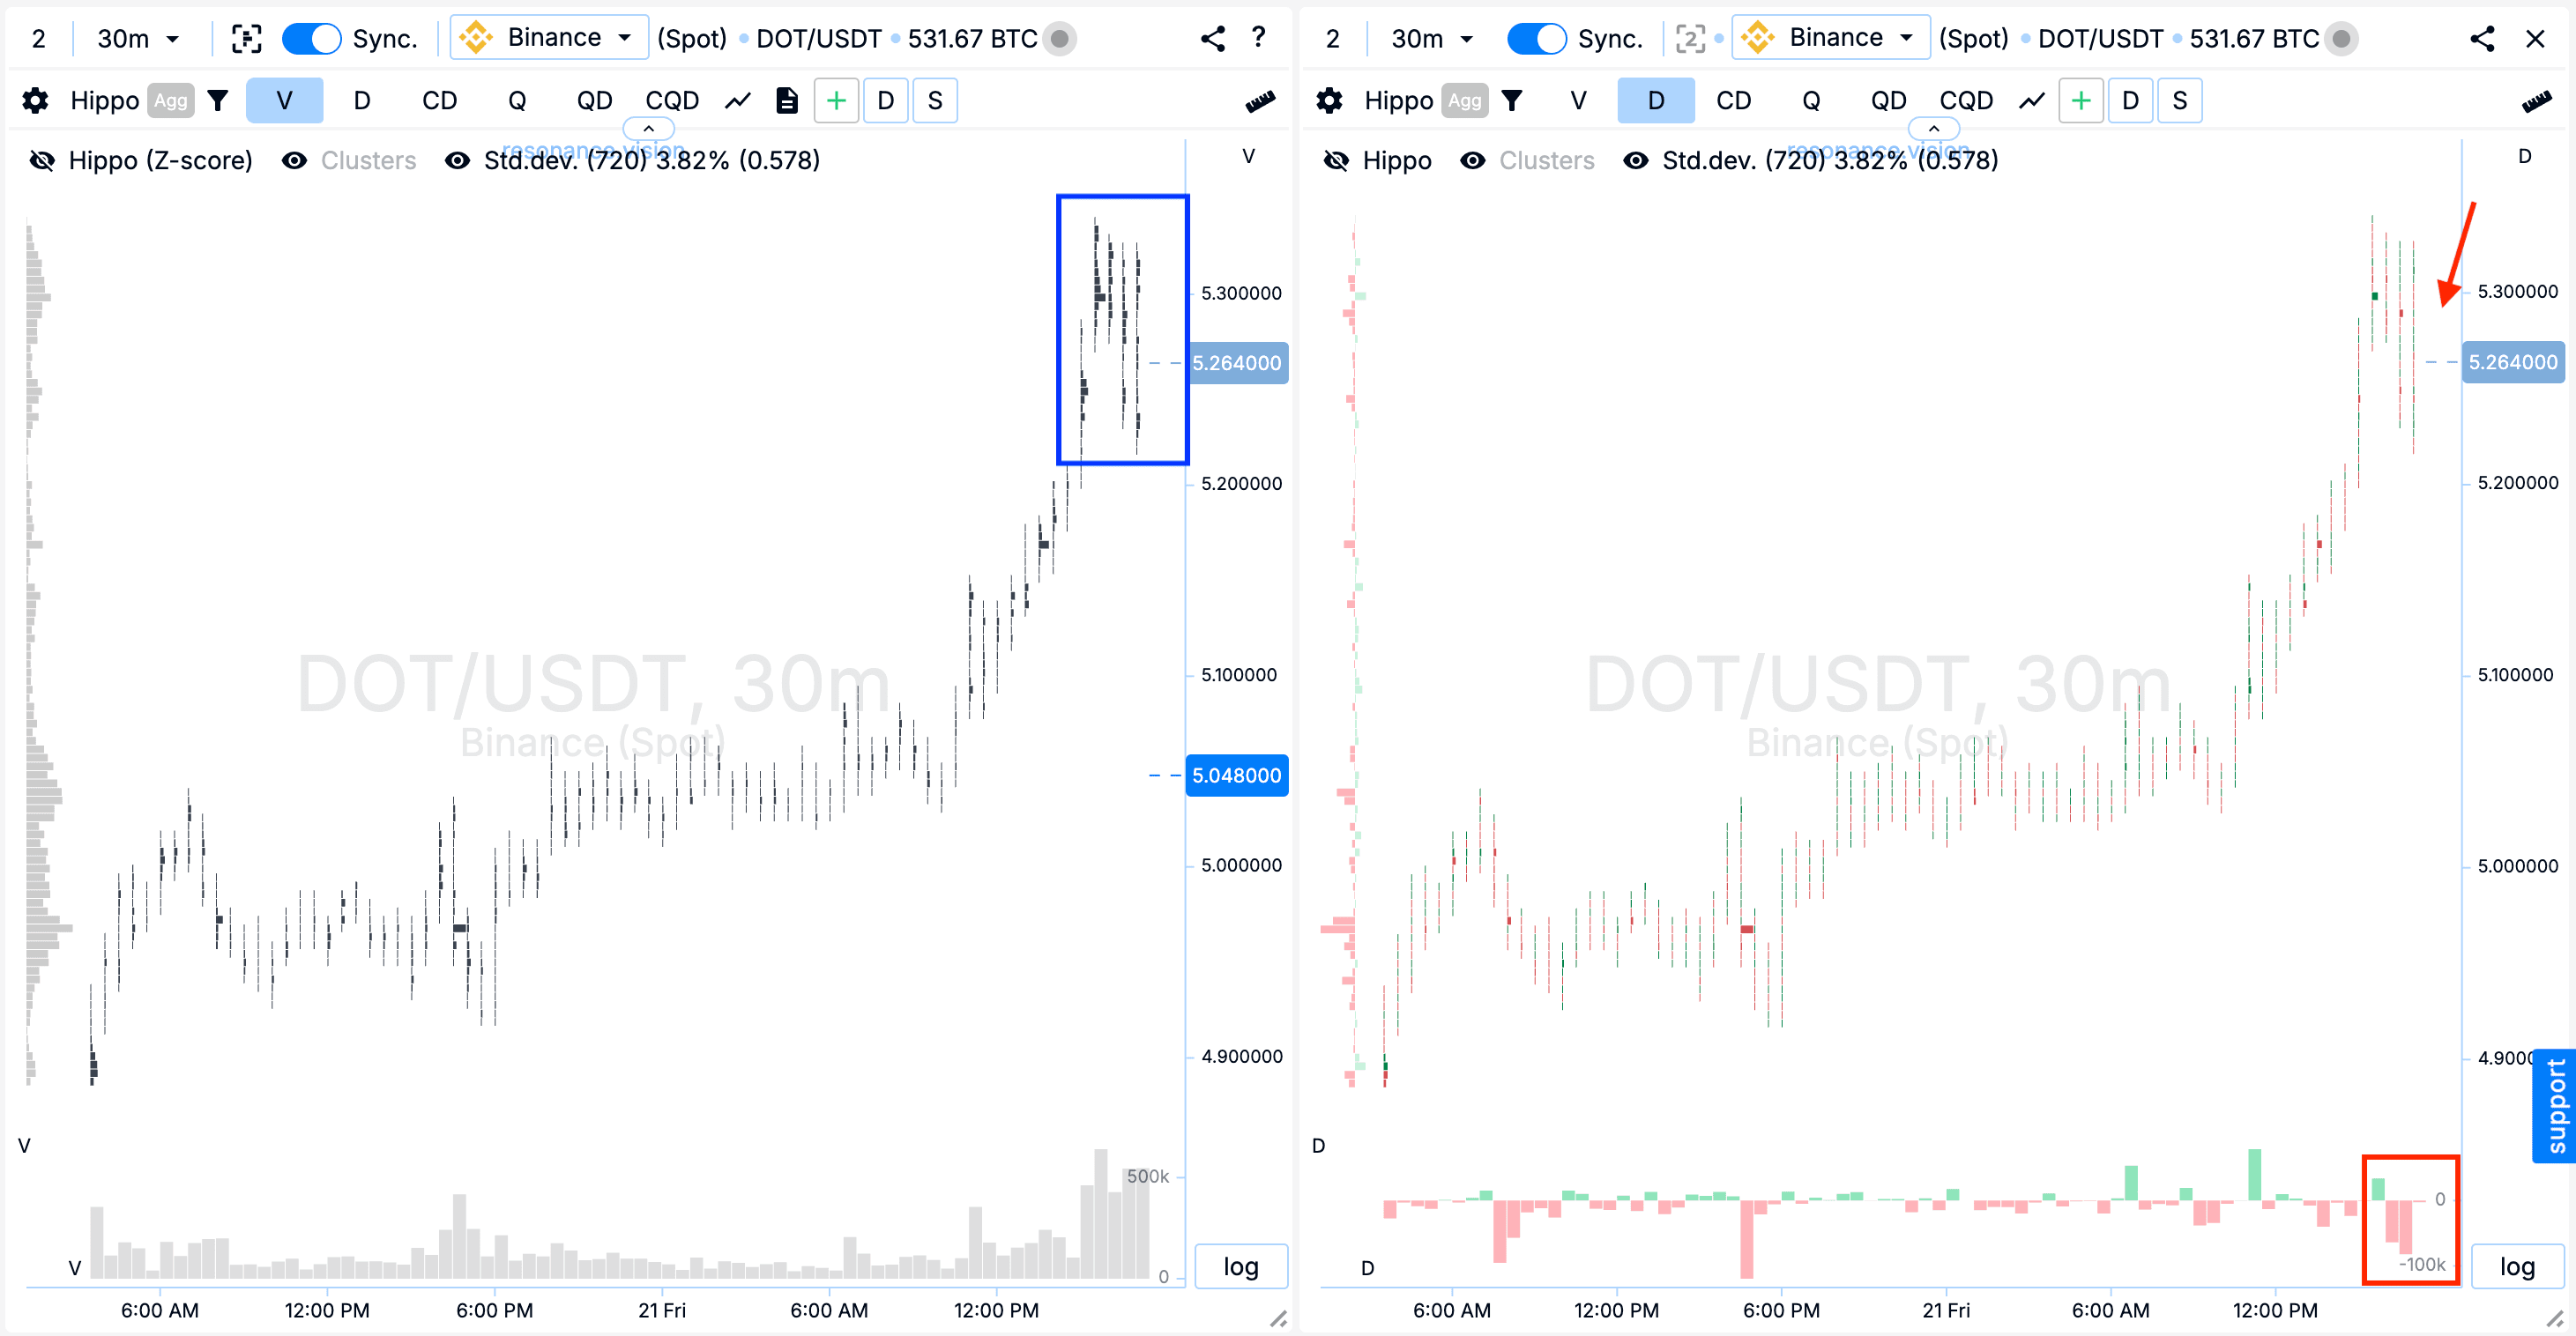
As this movement continued, the traded volume increased significantly (blue rectangle). And extreme volume sales have already started to move the price down (red rectangle with an arrow).
Heat map in Z-Score mode and by volume: On the heat map above we see abnormal limit densities, limits on sale (blue rectangles).
In Dashboard
Delta/Volume Balance: Market order balance started to shift towards sales (red arrow).
Change in price per unit of volume: The pressure of market order volume on price change started to converge - this can be seen visually on the chart (black rectangle).
Z-Score (price): Purchases have deviated the price by more than 3 standard deviations (blue arrow), which is an abnormal value.
Summary
We managed to secure a profit of +470.07%.
Conclusion
The trade demonstrated how a change in the balance of market orders and the appearance of abnormal limit clusters can indicate a potential change in direction.
Initial sales failed to lead to a decline, and the indicators from the Dashboard supplemented the potential hypothesis for a long position. However, as the movement continued, the increased sales volume, the appearance of dense limit clusters above and a price deviation of more than 3 standard deviations became arguments for taking profits.
Such scenarios show the importance of complex analysis, where a combination of volumes, market demand and limit orders helps to make a timely decision to enter and exit a trade.
Follow new articles in our telegram channel.
No need to invent complex schemes and look for the “grail”. Use the tools of the Resonance platform.
Register using the link - get a bonus and start earning:
OKX | BingX | KuCoin.
Promo code TOPBLOG gives you 10% discount on any Resonance tariff plan.
Recommended articles


