OM +2068.86% (Resonance Directional Strategy)

A low-risk OM/USDT trade with a confident entry logic: volume clusters at the local minimum, no reaction to market sales, and growth of limit support.
The analysis is confirmed by the heat map and indicators from the Dashboard.
Exit - against the backdrop of increased volatility, abnormal price deviation, and increased limit sales.
Result: +2068.86% profit. An example of how volume and market participants’ behavior allow you to find strong entry points and fix the result in time.
Table of contents

Coin: OM/USDT
Risk: low
Understanding level: beginner
Reasons to enter
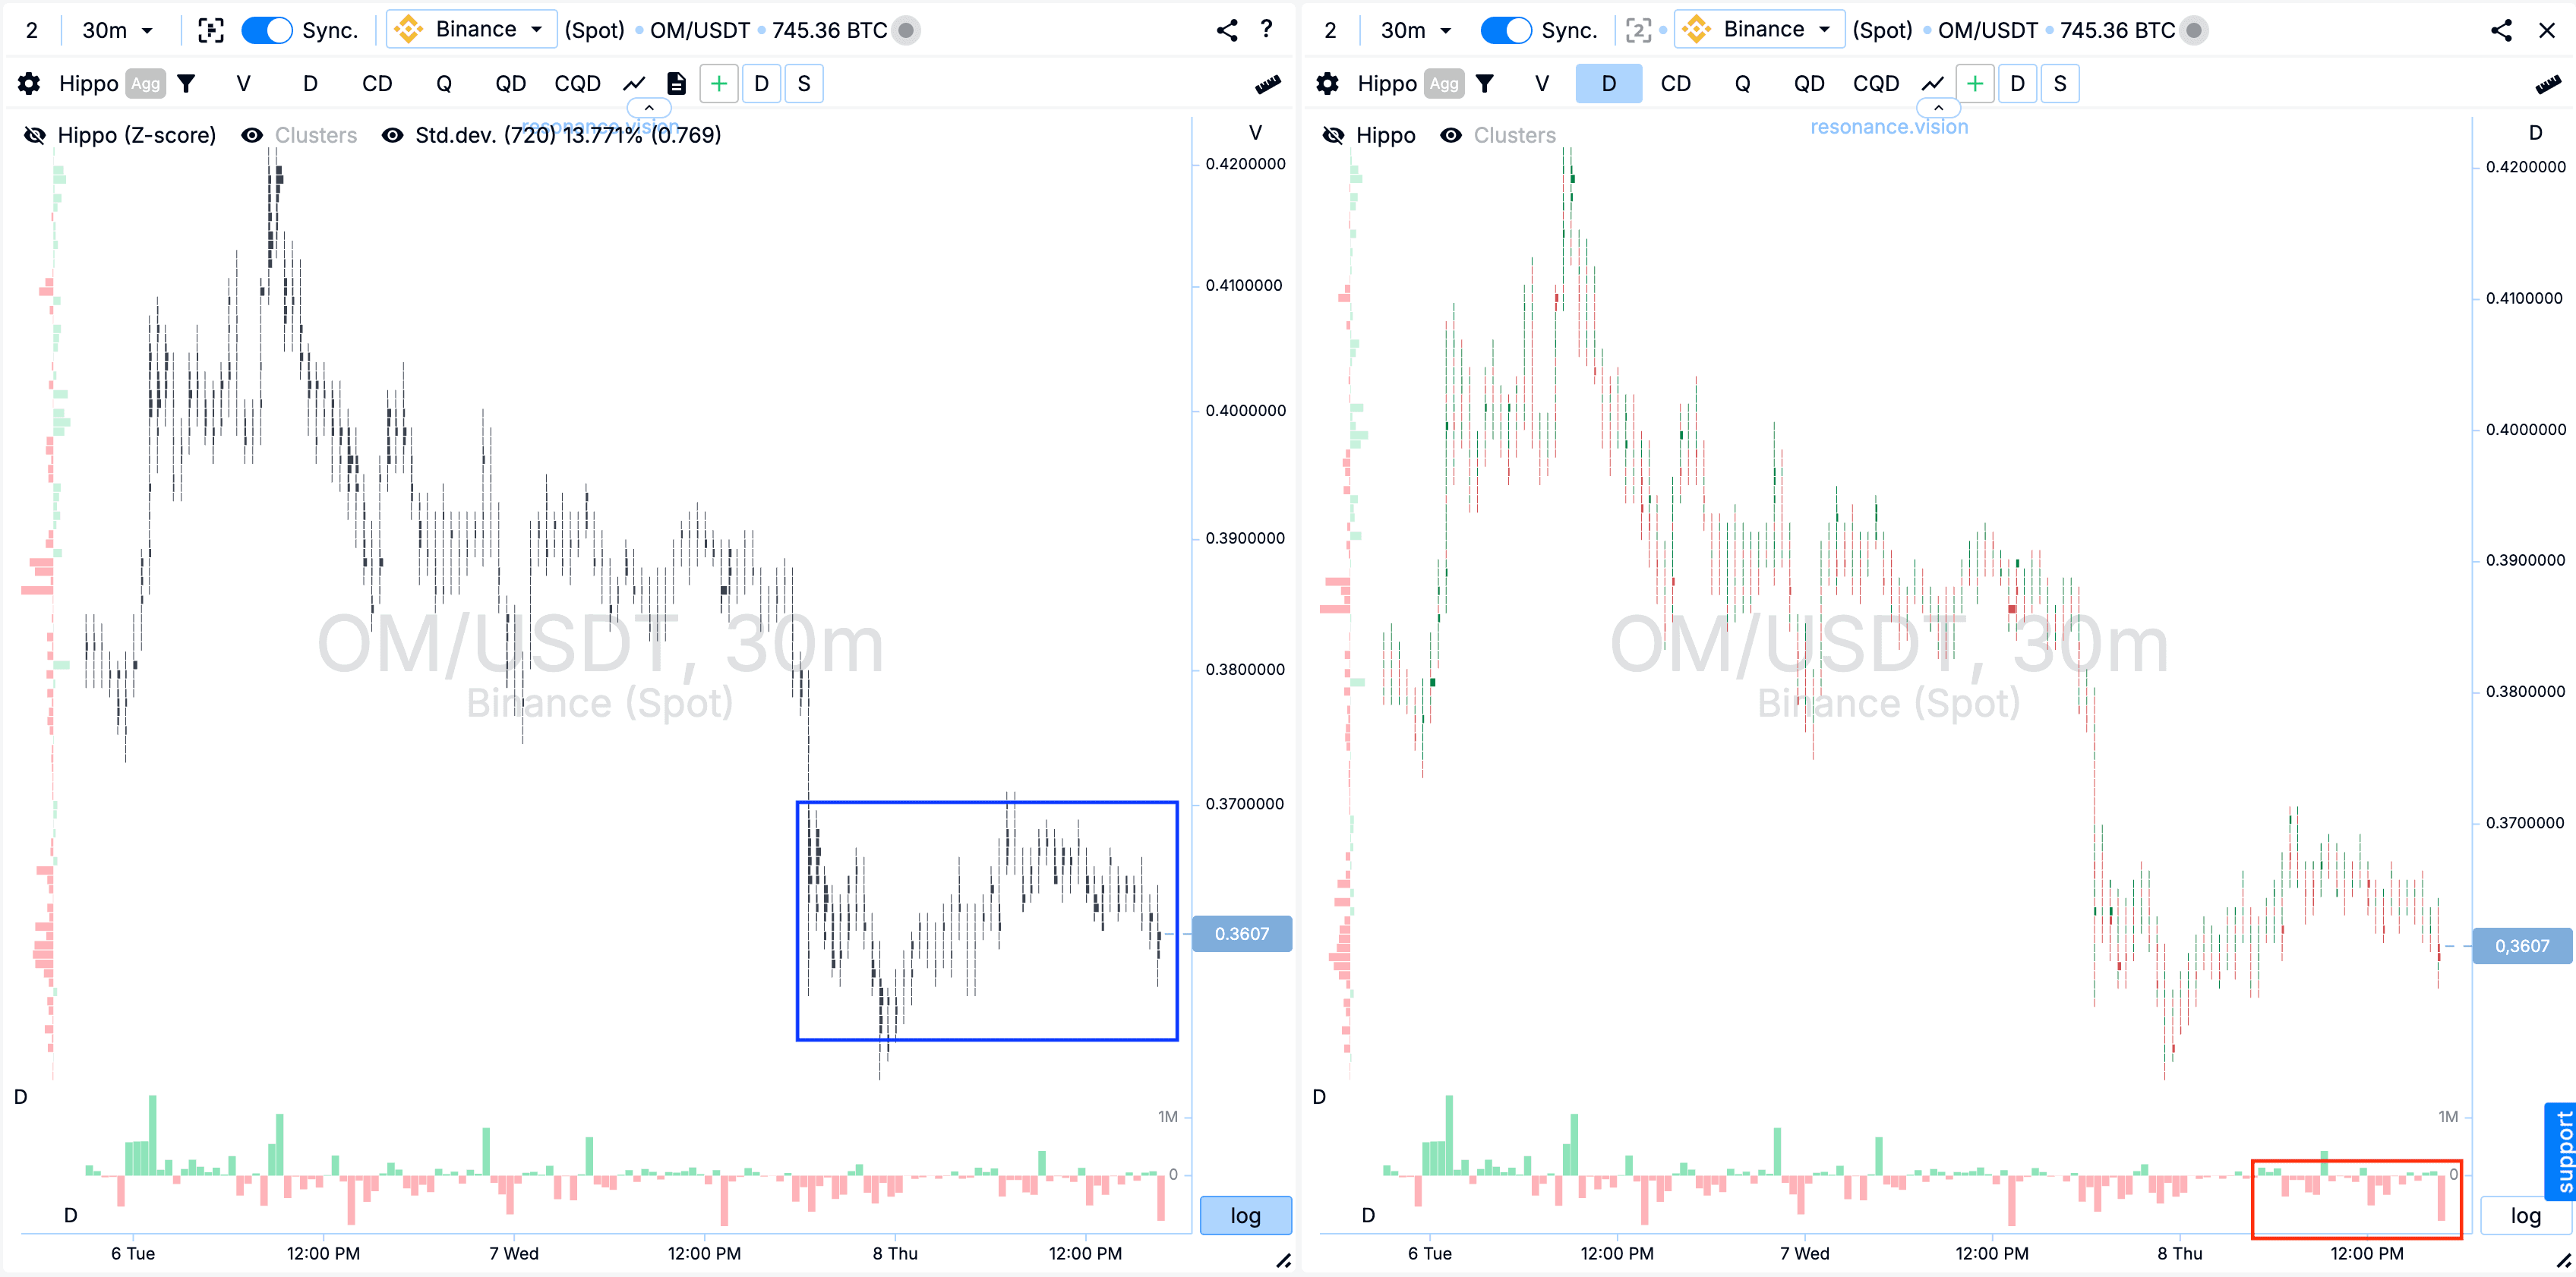
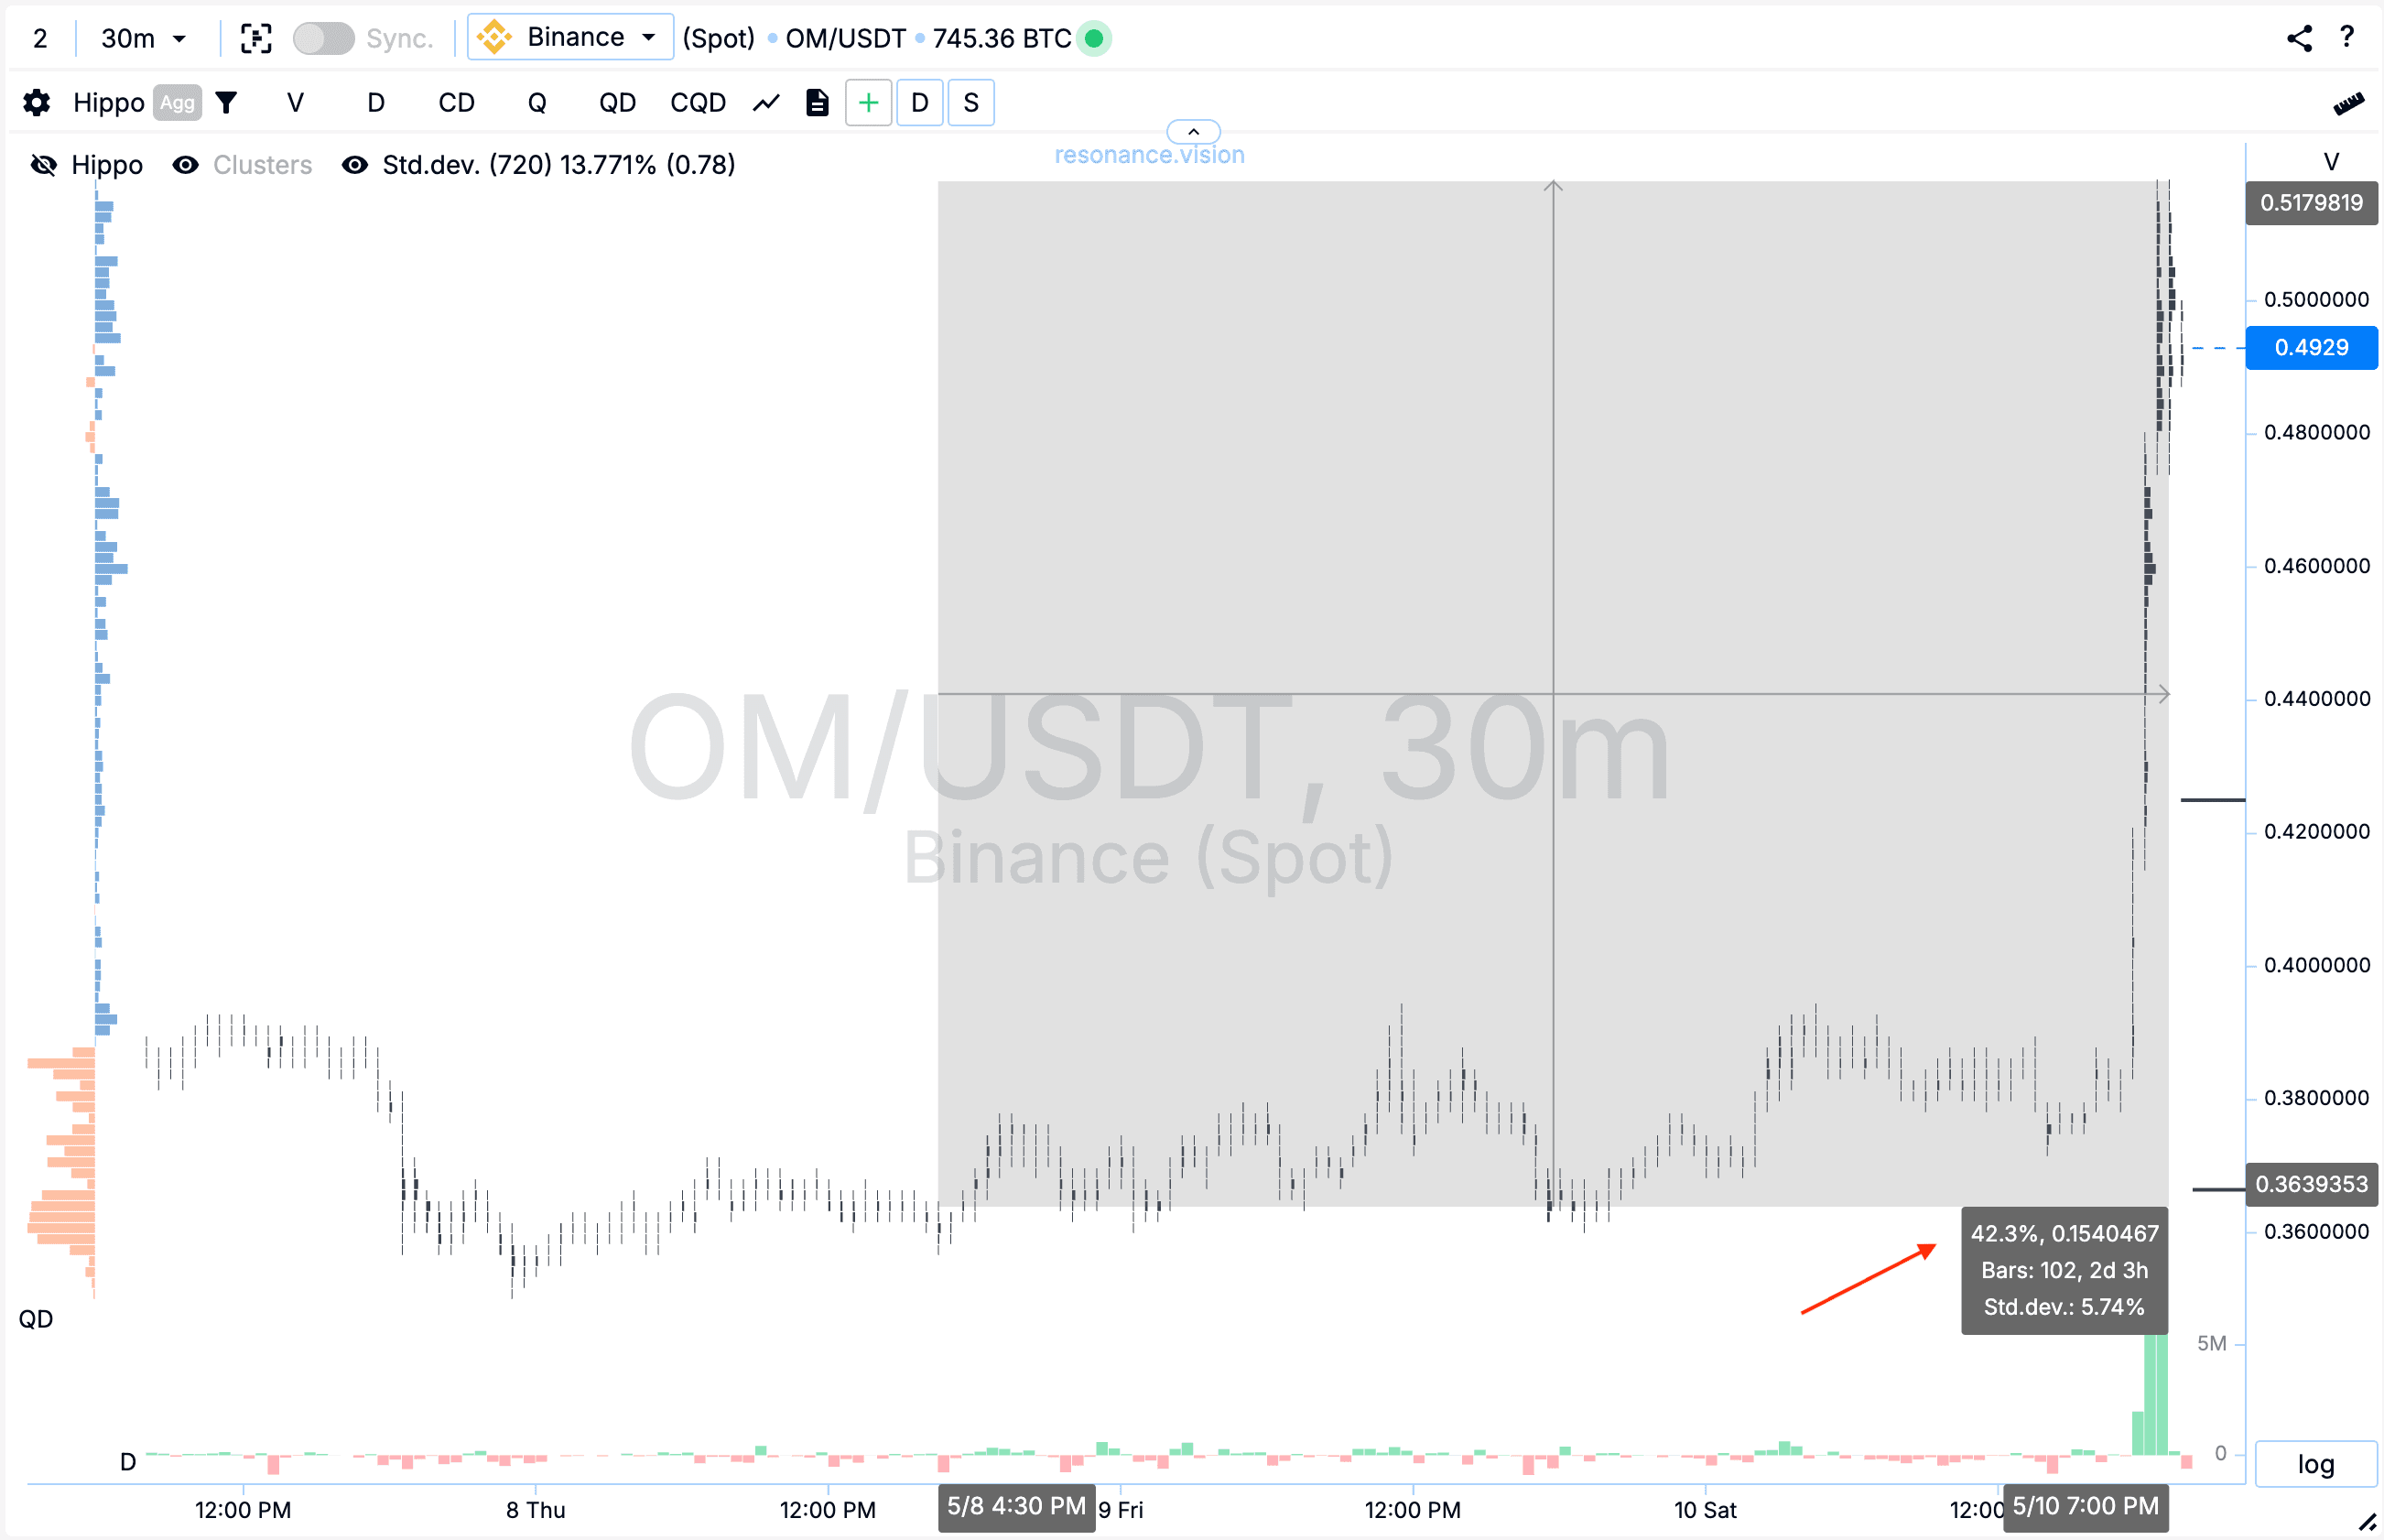
Cluster chart:
Noted that clusters by volume (blue rectangle) formed at the local minimum in the price range.
Noted that long-term market sales stopped showing results (red rectangle), and the local price minimum is not updated.
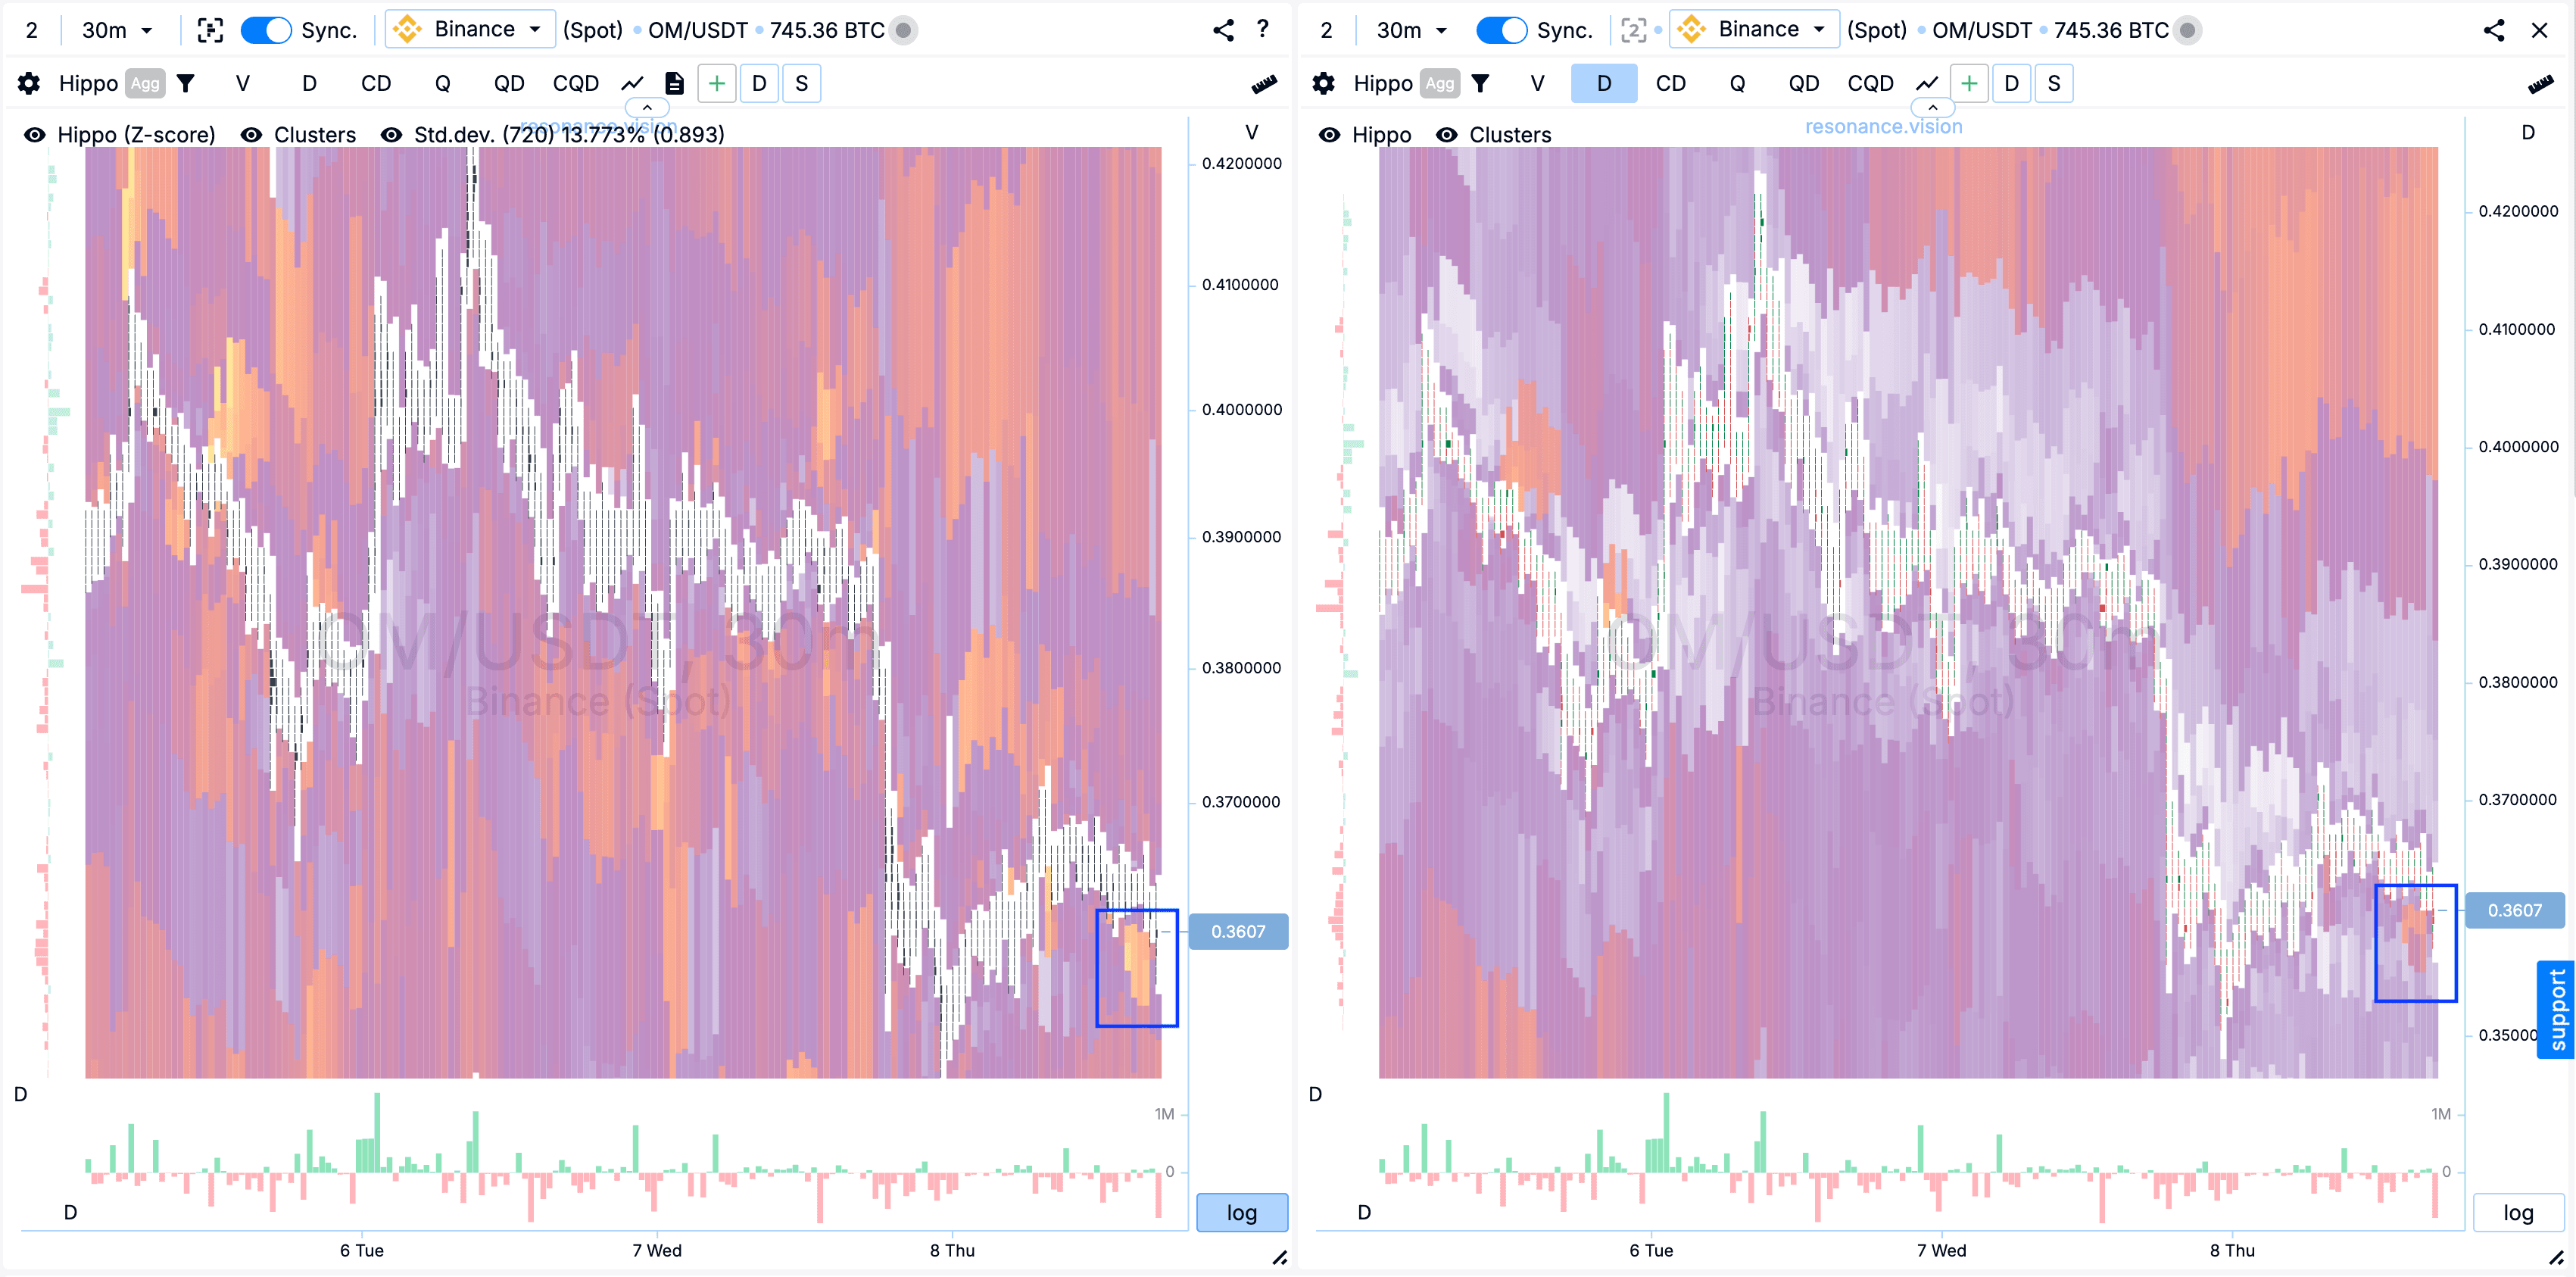
Heat map in Z-Score mode and by volume:
Noted small but abnormal limit clusters in the form of bright spots, in Z-Score mode and by volume (blue rectangles).
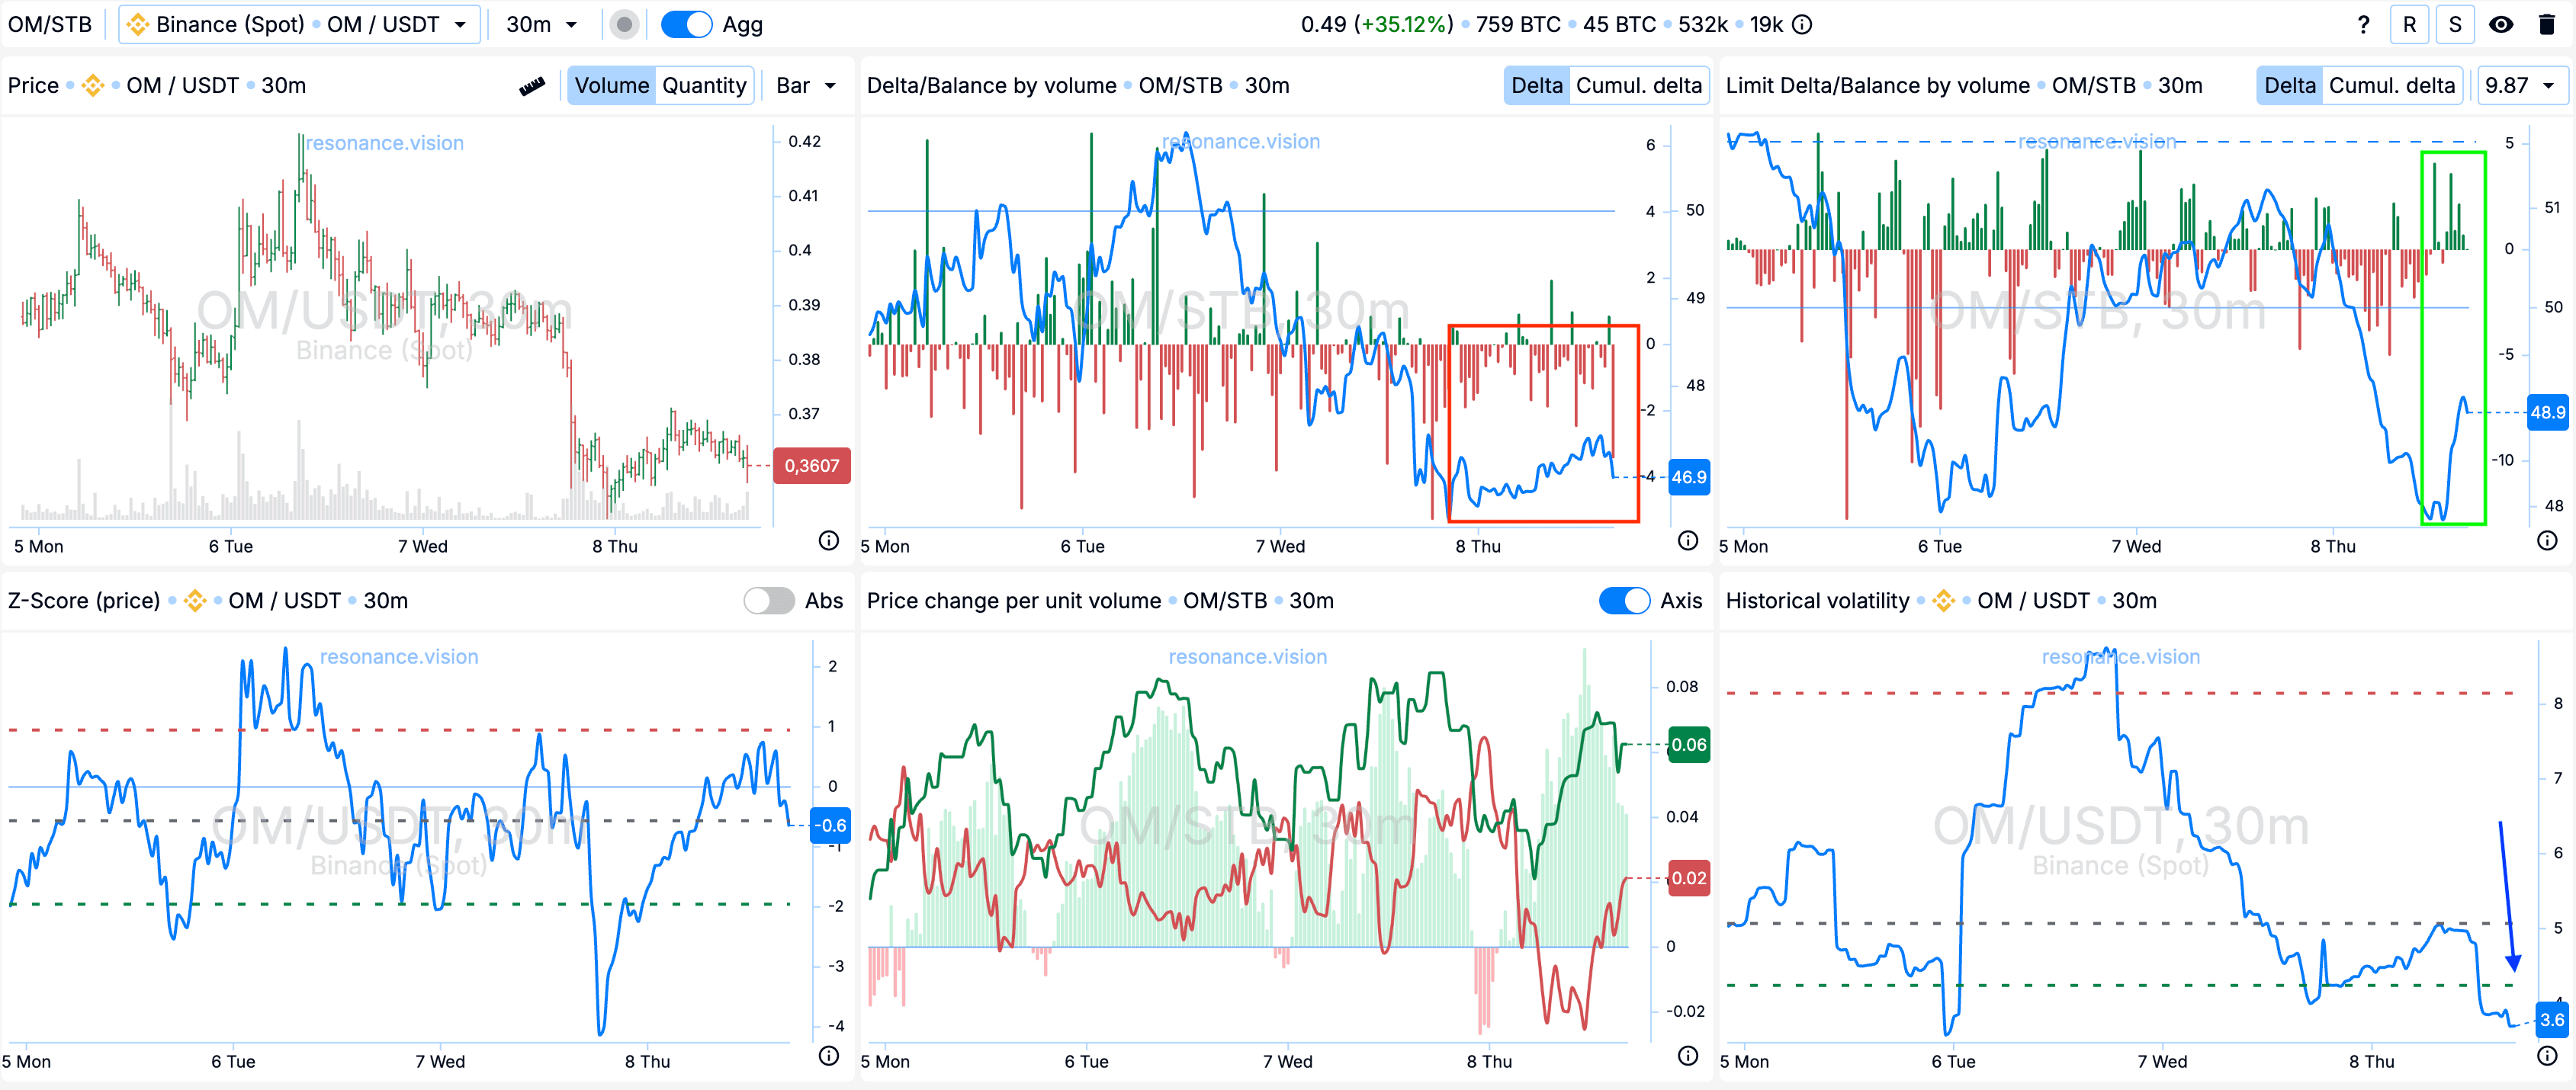
Dashboard:
Delta/Volume Balance: Aggregated, market sales do not show the result significantly (red rectangle).
Limit Delta/Volume Balance: At this point, the extreme bars on limit orders began to substitute more for buying, and the balance began to shift upward (green rectangle).
Historical Volatility: Volatility fell to low values (blue arrow).
Exit reasons
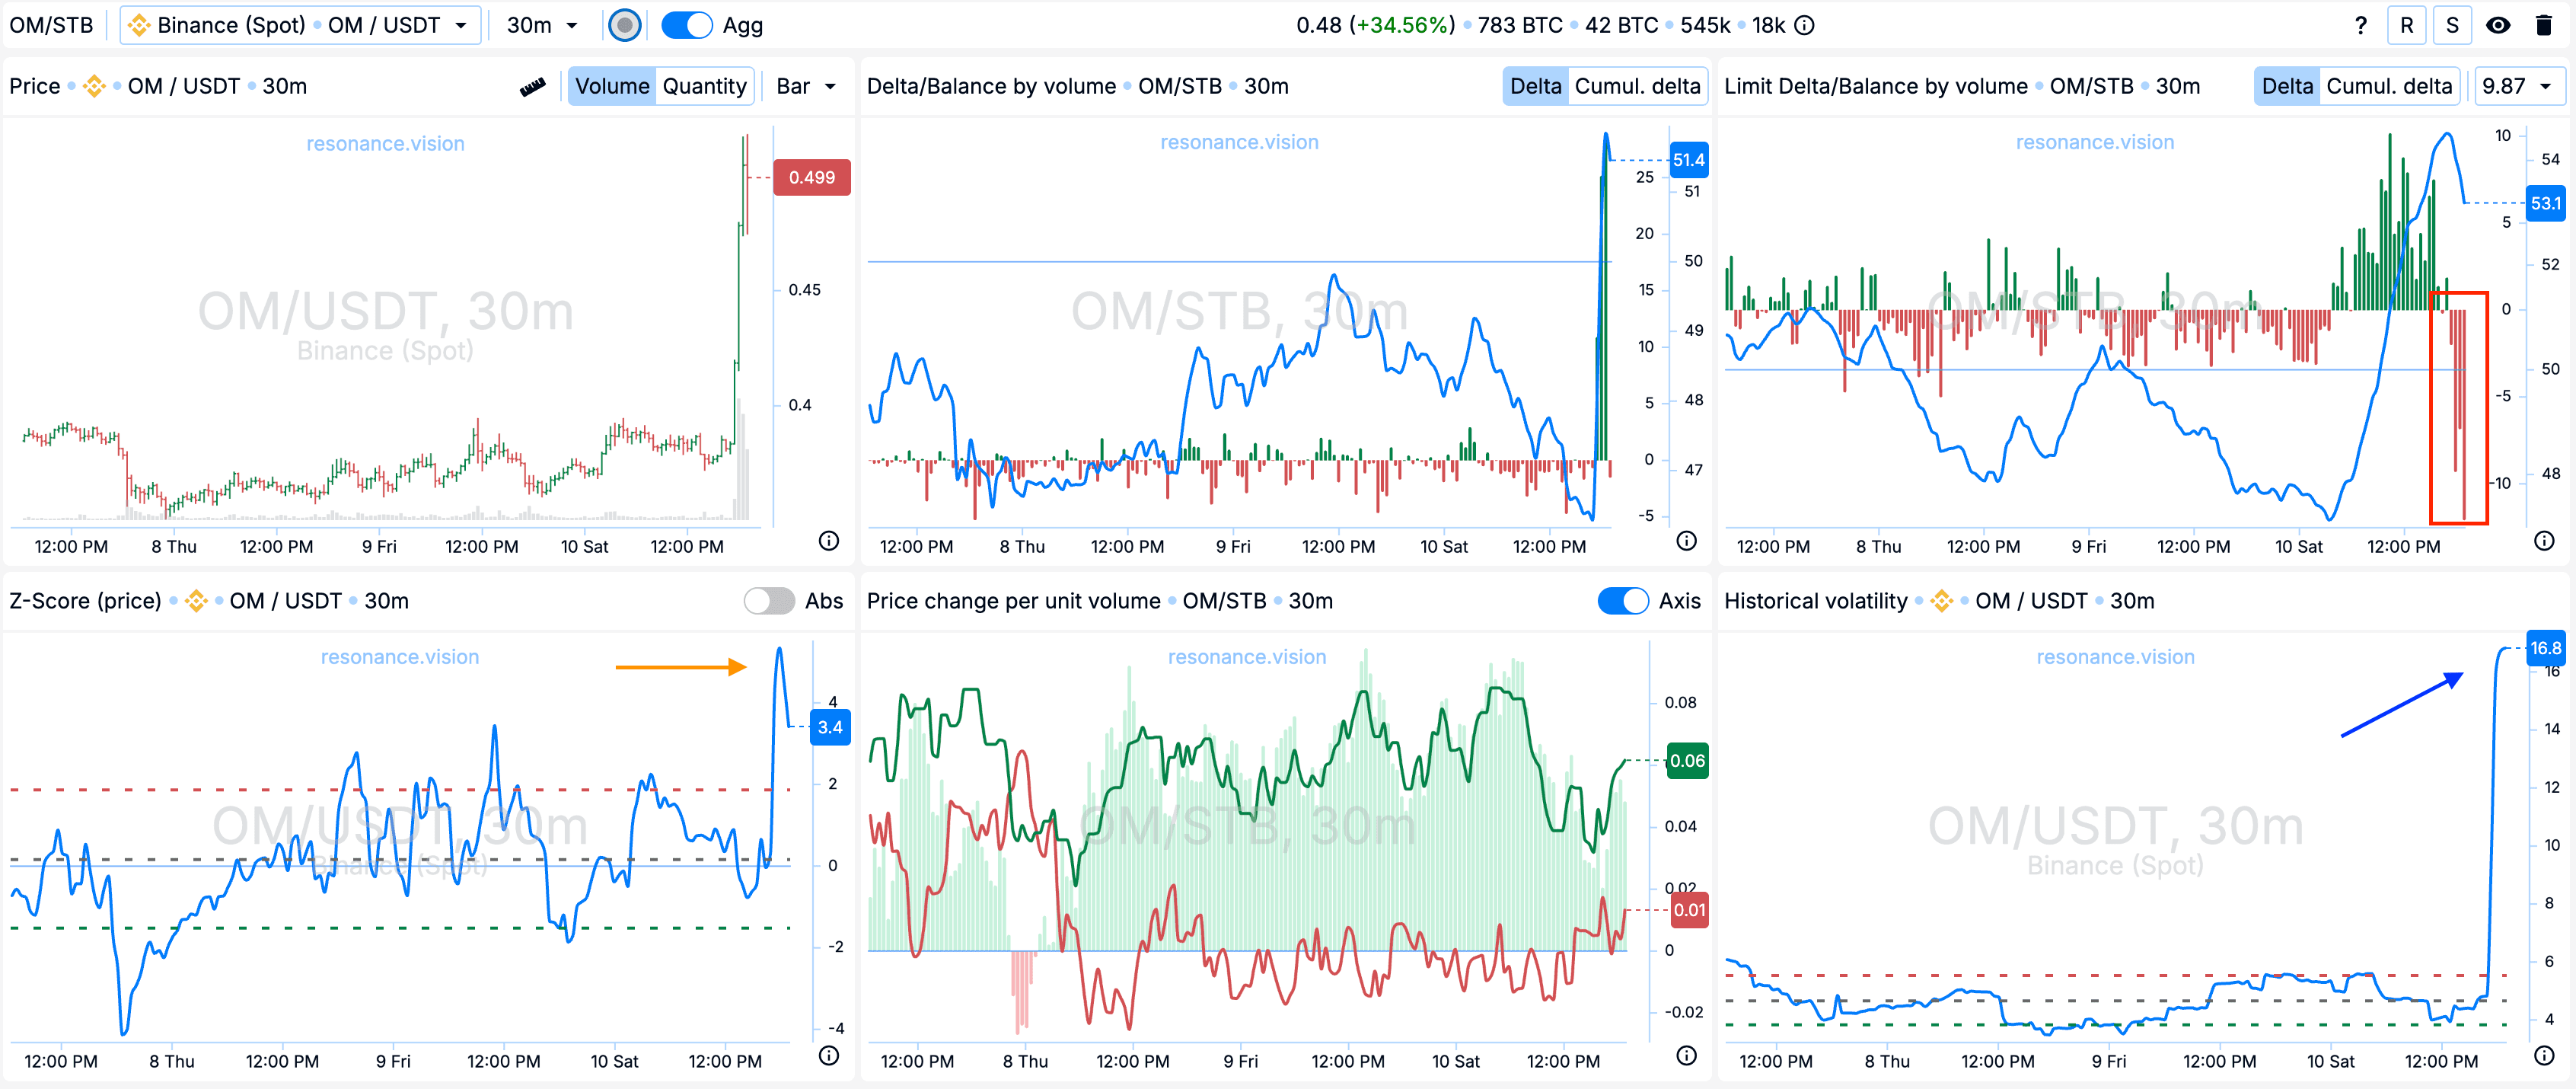
In Dashboard
Limit Delta/Balance by volume: Aggregated by limits, sell orders began to dominate (red rectangle).
Z-Score (price): Additionally, I noted an abnormal upward price deviation, which reached more than 4 standard deviations (orange arrow).
Historical volatility: Volatility, as we can see, has increased significantly (blue arrow).
Cluster chart:
As a result, we see an impulse movement, and from the entry point, the growth was more than 40%.
Result
We managed to secure a profit of +2068.86%.

Conclusion
This trade became an example of how you can find strong entry points based solely on the behavior of market participants and volume analysis. The cluster chart, abnormal limit densities from below and decreased volatility made it clear that sellers were losing the initiative and a reversal was possible.
The further development of the scenario confirmed the hypothesis: market sales did not exert pressure, and buyers began to seize the initiative.
Taking profits at the peak of the movement brought +2068.86% and once again emphasized the importance of timely analysis and reaction to market dynamics. Such transactions not only bring results, but also strengthen confidence in your own trading system.
Follow new articles in our telegram channel.
No need to invent complex schemes and look for the "grail". Use the tools of the Resonance platform.
Register using the link - get a bonus and start earning:
OKX | BingX | KuCoin.
Promo code TOPBLOG gives you 10% discount on any Resonance tariff plan.
Recommended articles


