TWT +22.9% (Направленная стратегия Резонанс)

В этой сделке я опирался на кластерный анализ и показатели с Дешборда: крупные рыночные продажи не смогли продавить цену, что указывало на дефицит и активность лимитных покупателей. Это стало ключом к входу. Финальным акцентом послужил всплеск продажных объёмов и рост волатильности — сигнал вовремя зафиксировать результат и забрать профит.
Содержание

Монета: TWT/USDT
Риск: средний
Уровень понимания: новичок
Причины входа
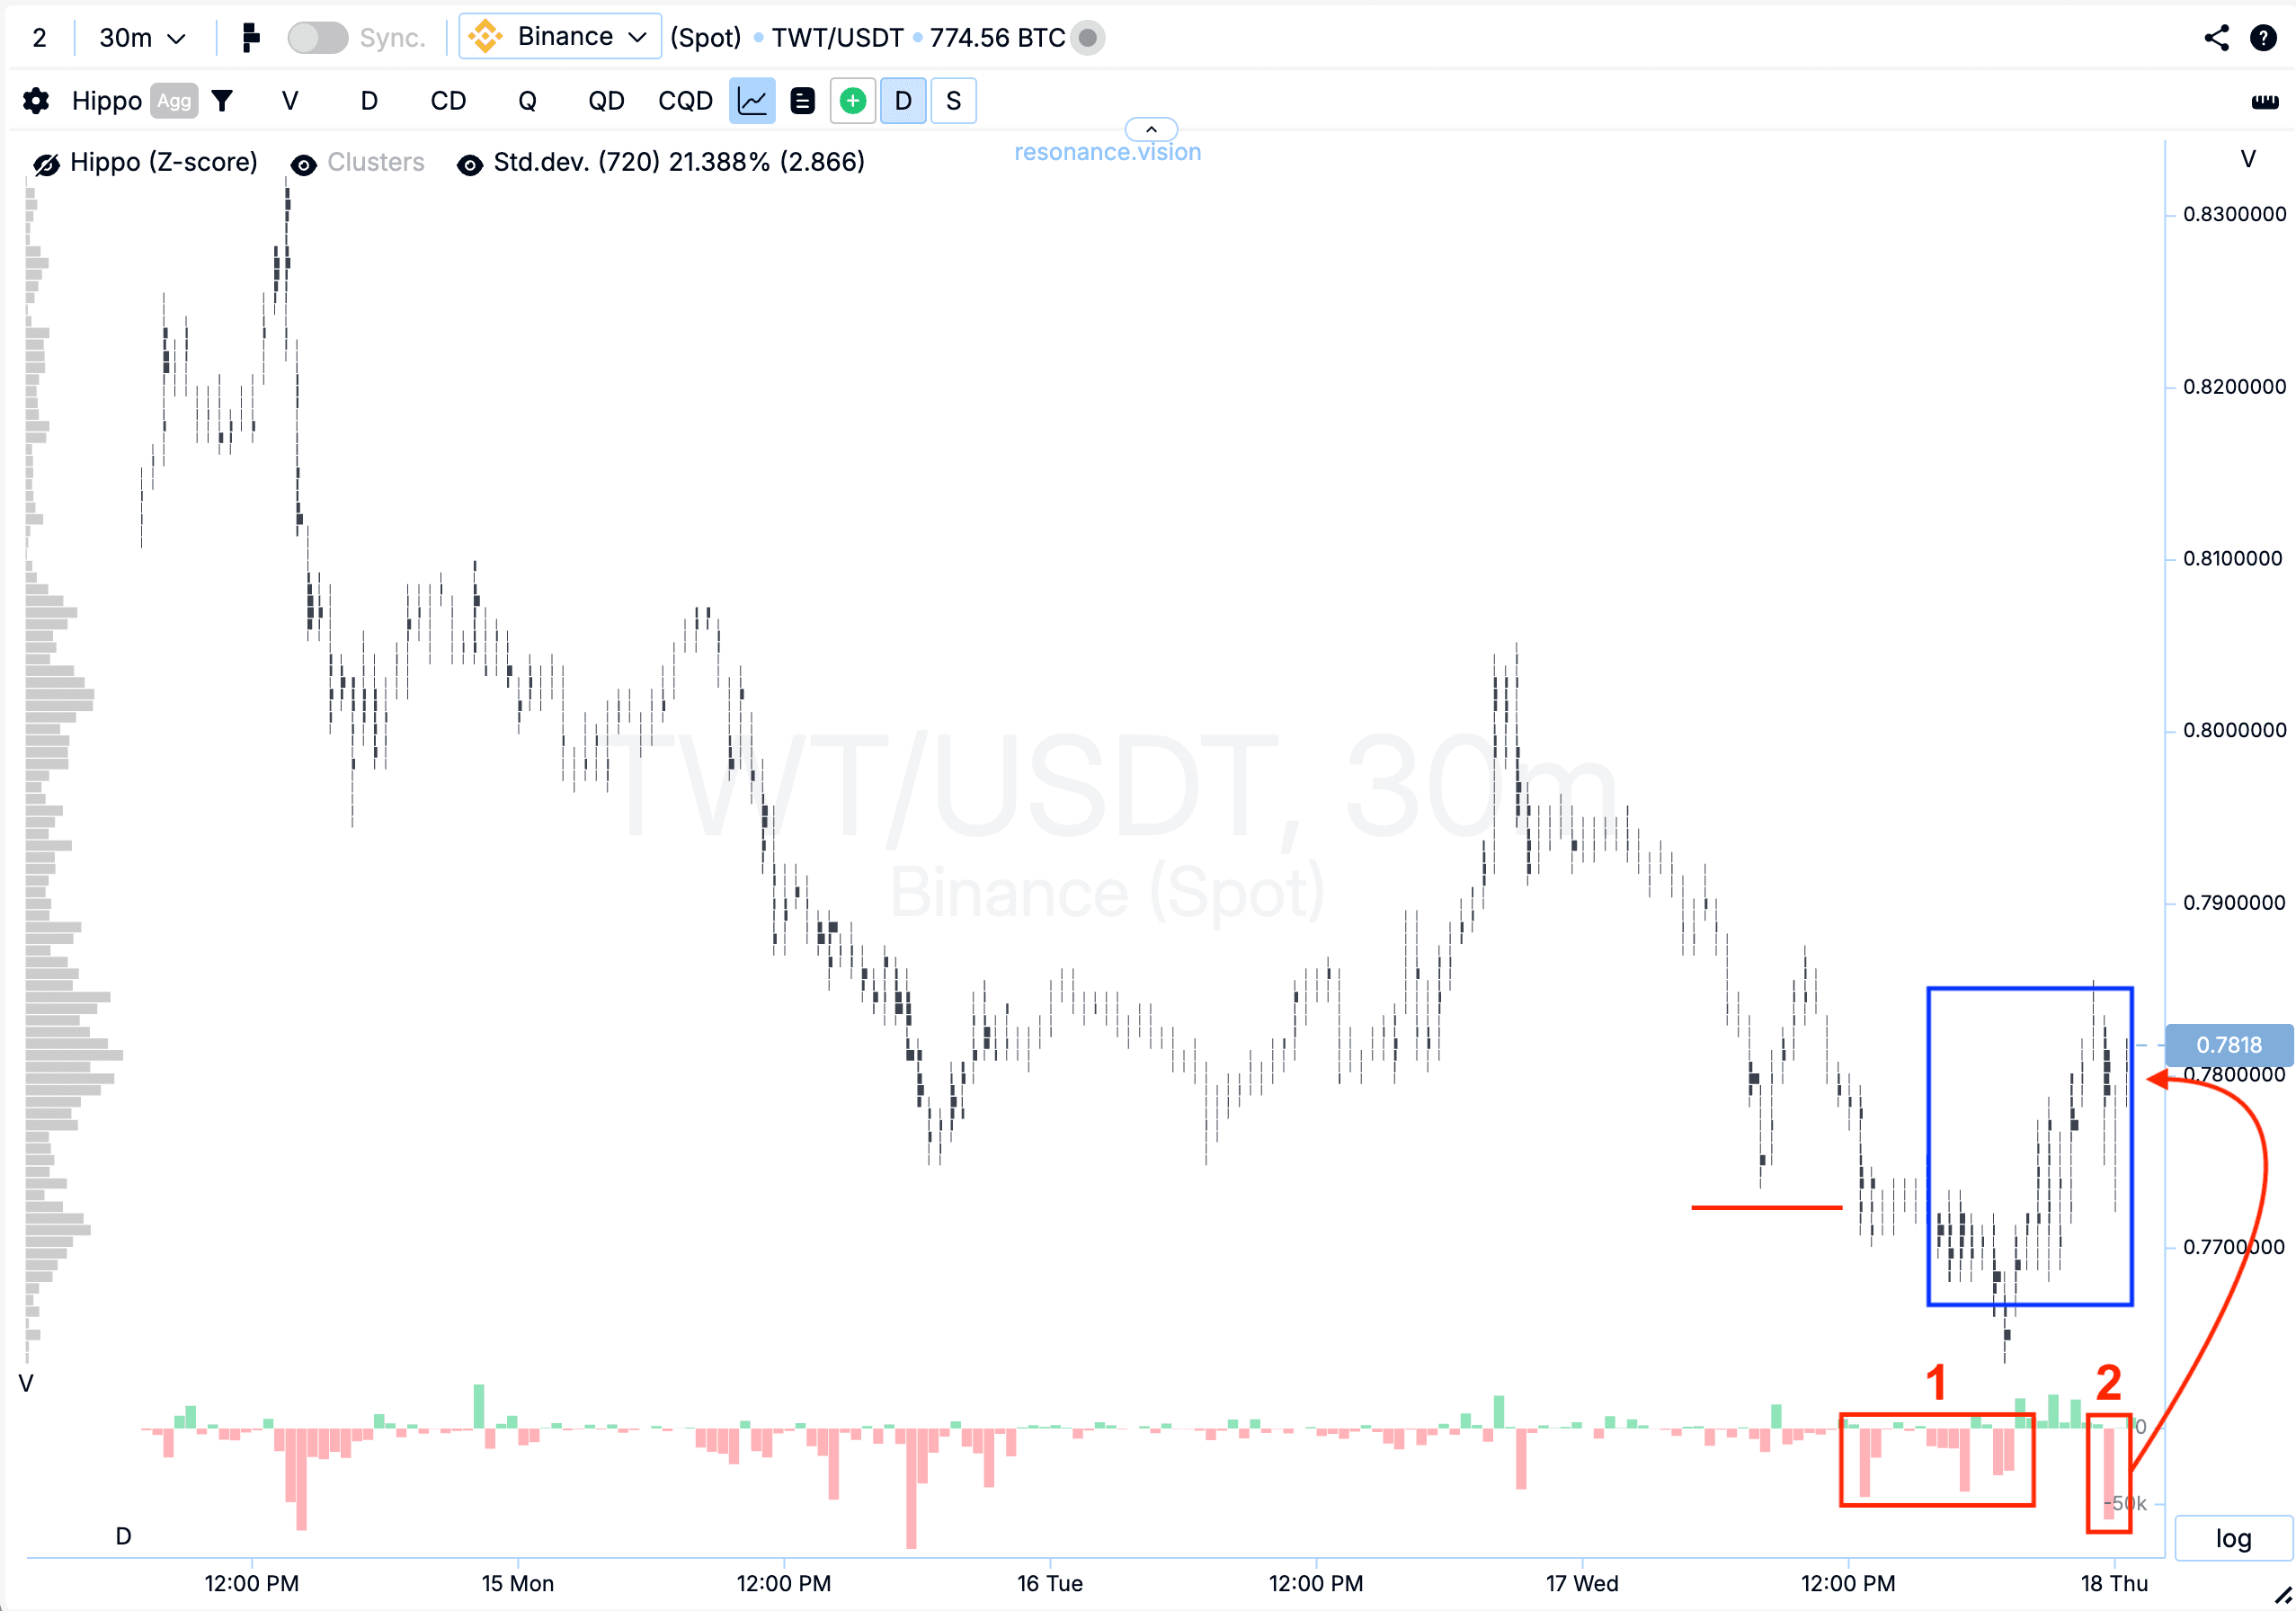
Кластерный график: начали формироваться кластера по объёму (синий прямоугольник). Первые объёмы на продажу (красный прямоугольник №1) не обновили существенно локальный минимум (отмечено линией), что уже указывало на снижение давления продавцов. Повторные продажи (красный прямоугольник №2) также не привели к ожидаемому снижению — напротив, цена начала постепенно расти. Подобная динамика говорит о формировании локального дефицита и наличии интереса со стороны покупателей.
В Дешборде
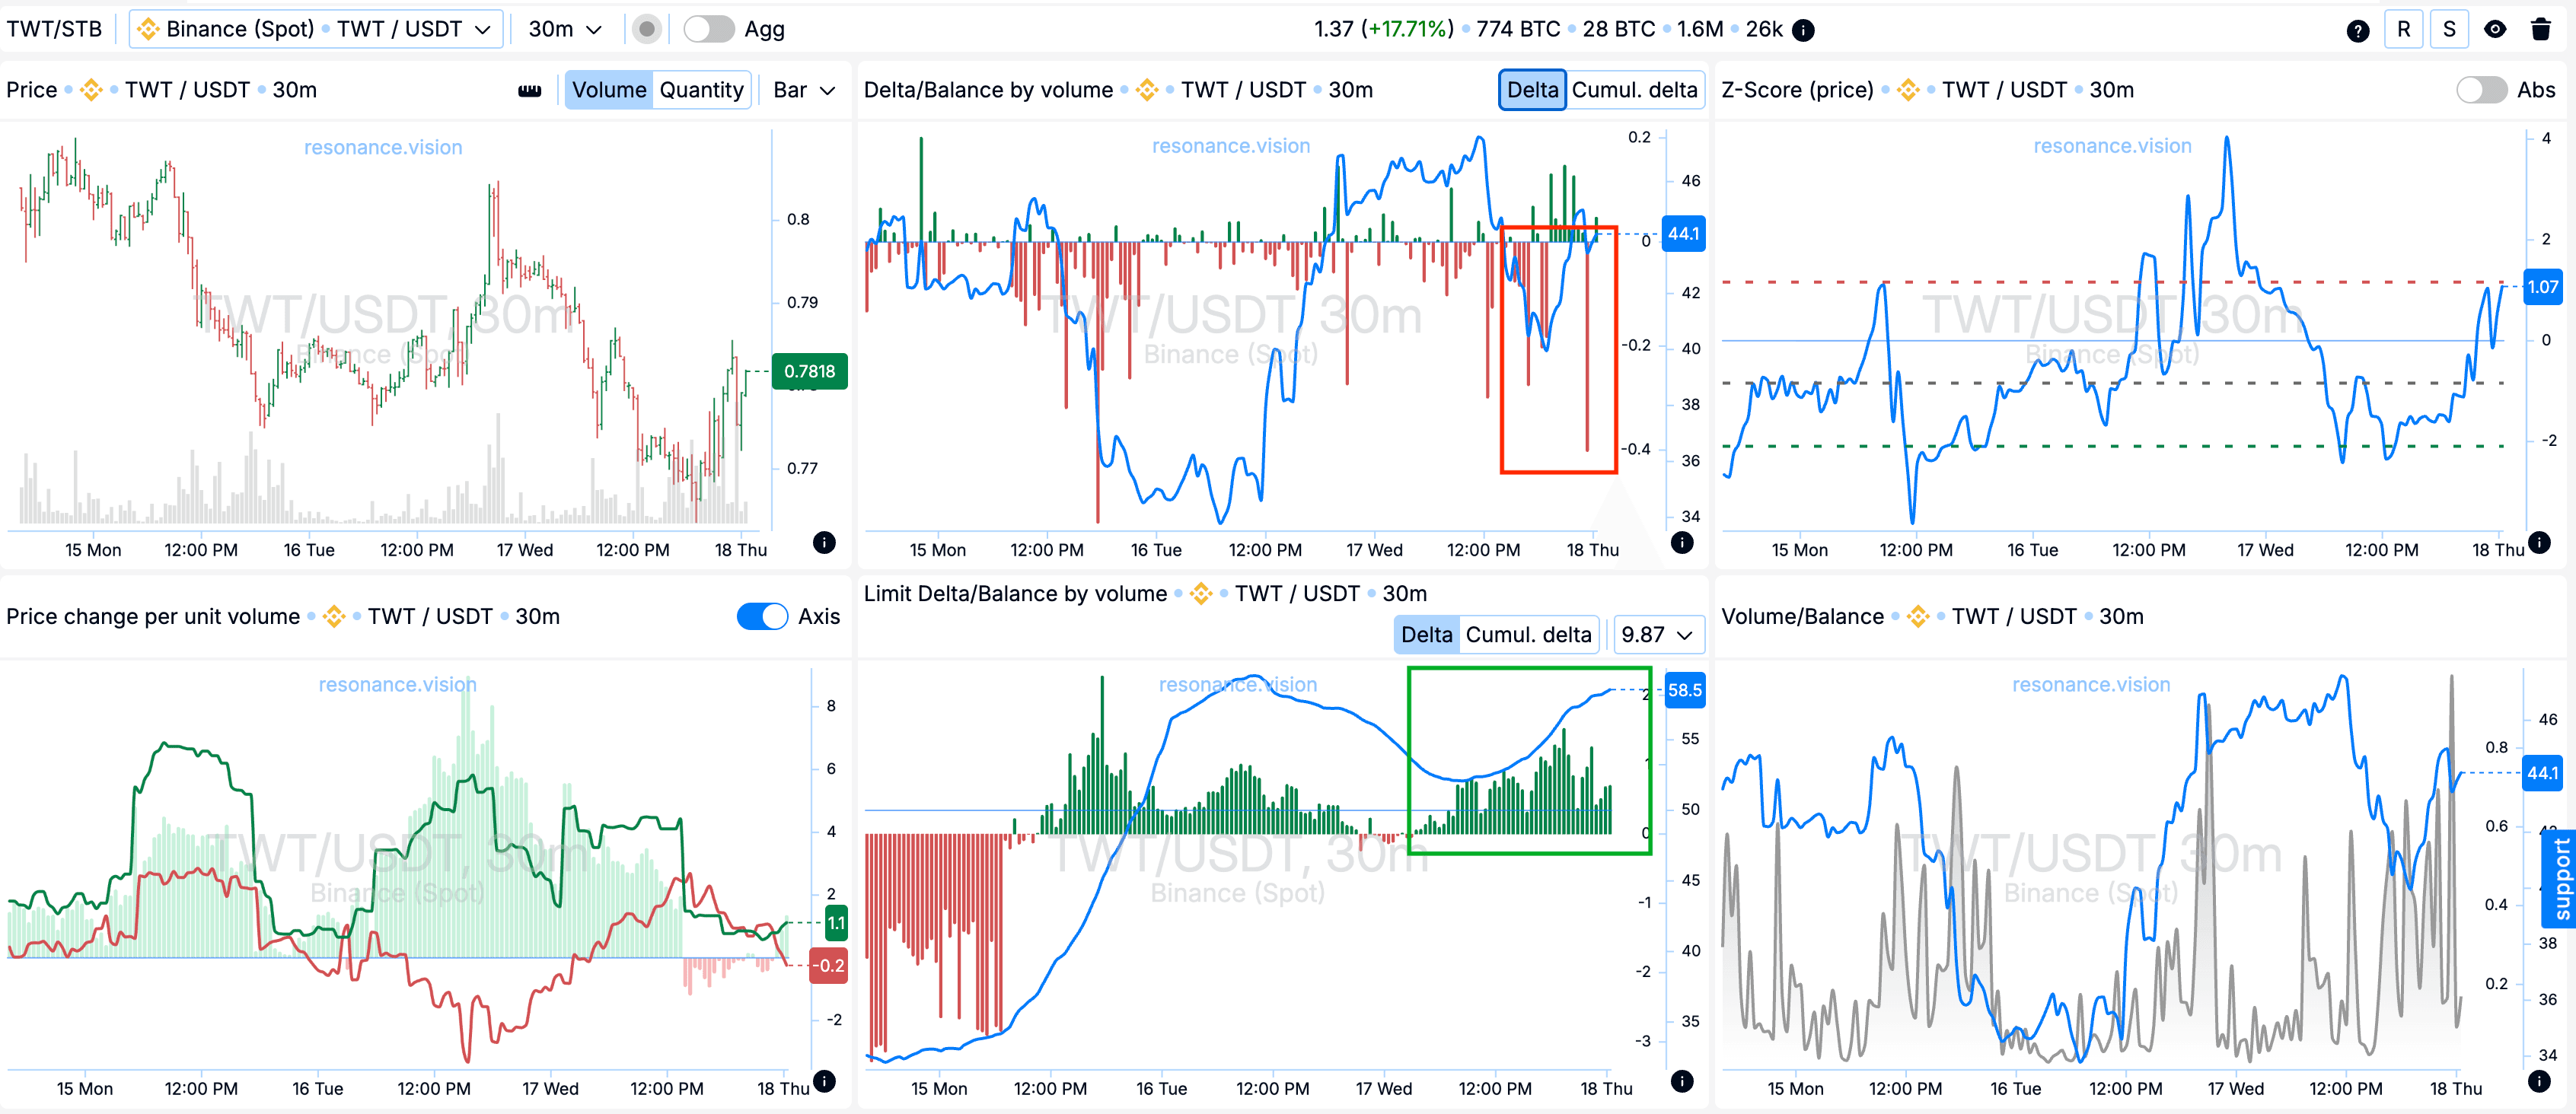
Дельта/Баланс по объёму и лимитная дельта: агрегированные данные показывают явное преобладание рыночных продаж — это отчётливо видно по гистограмме дельты (красный прямоугольник). Тем не менее цена уже не демонстрирует снижения, что указывает на ослабление влияния продавцов.
Дополнительно по лимитным заявкам видно нарастающую активность покупателей: лимитные заявки на покупку постепенно подставляются всё больше (зелёный прямоугольник). Такая картина говорит о доминировании лимитных покупателей и готовности рынка активно поглощать объёмы маркет-продаж.
Причины выхода
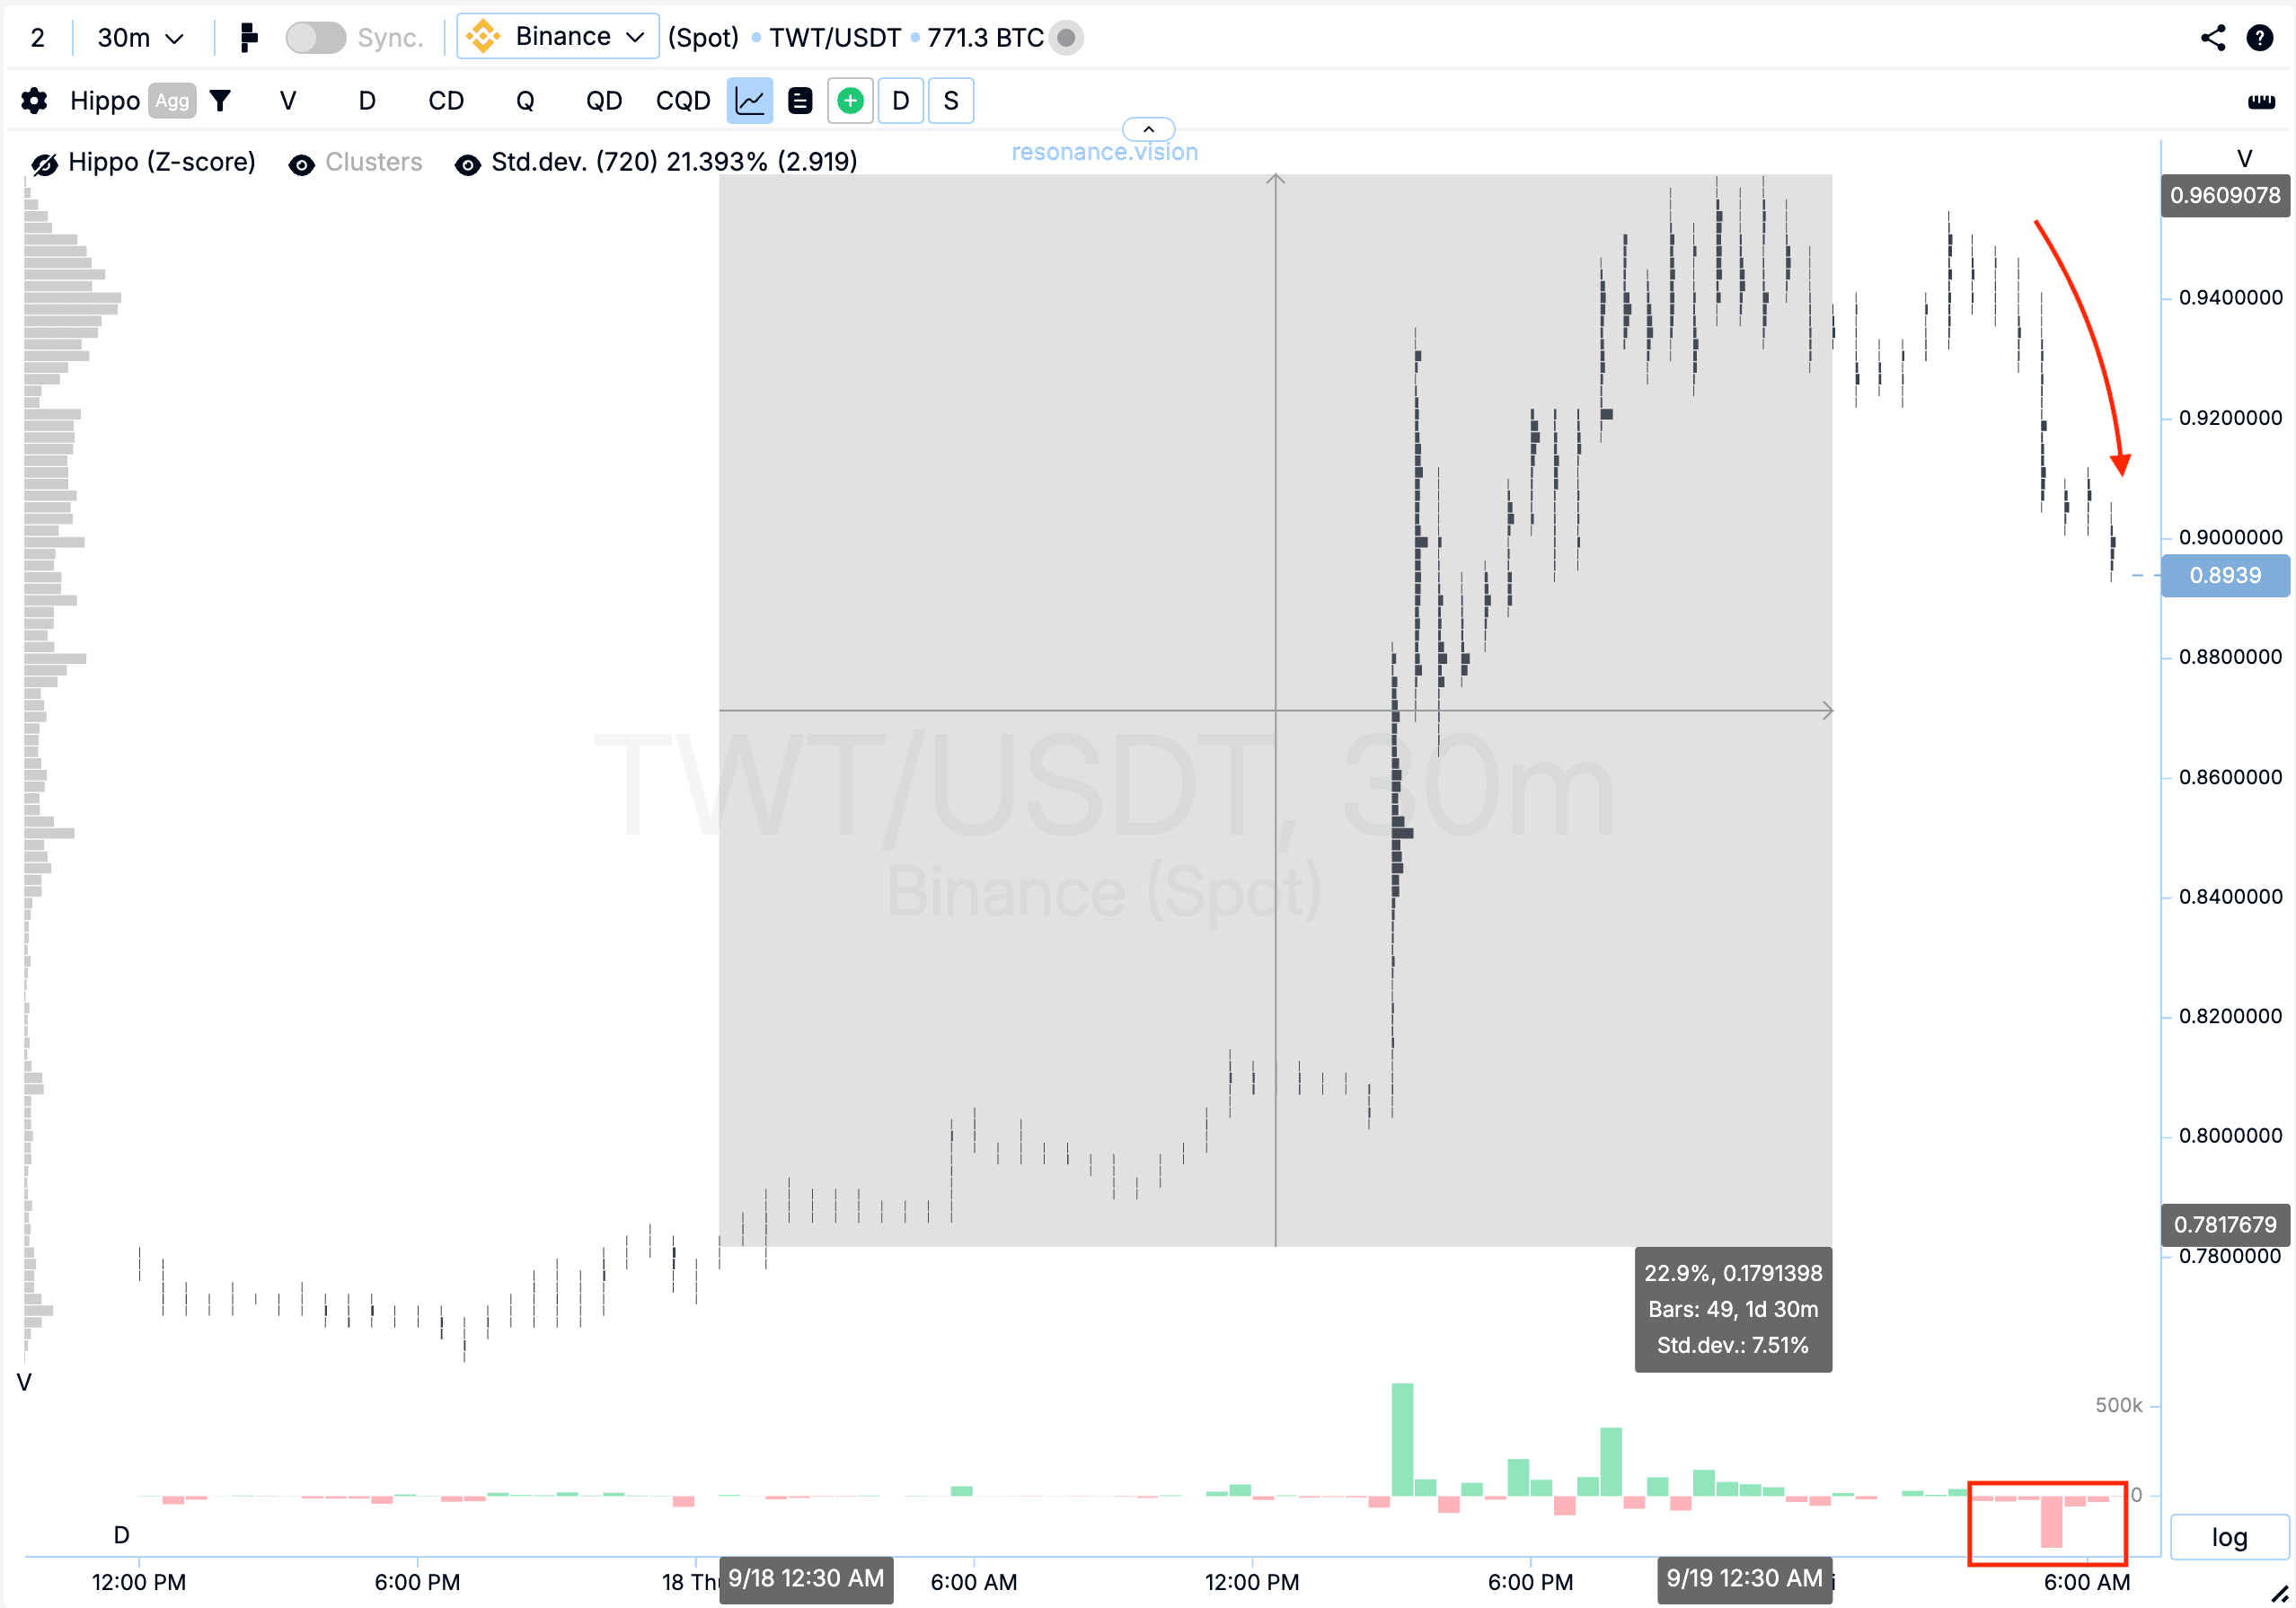
Кластерный график: от точки входа цена показала рост ещё на 23%, что само по себе является отличным результатом. Однако вместе с этим заметно выросла волатильность, а также начали преобладать объёмы на продажу, из-за чего цена постепенно пошла вниз (прямоугольник и стрелка). В таких условиях дальнейшее удержание позиции сопровождалось бы повышенным риском, поэтому фиксация прибыли выглядела наиболее рациональным решением.
Заключение
Эта сделка стала примером того, как совмещение кластерного анализа и данных Дешборда помогает выявлять дисбаланс сил между покупателями и продавцами. Несмотря на преобладание рыночных продаж, цена не реагировала снижением, что указывало на локальный дефицит и готовность участников выкупать предложение. Дополнительным подтверждением стало усиление лимитных покупателей, активно поглощавших объёмы продаж.
На выходе ключевую роль сыграли рост волатильности и усиление продажных объёмов, что дало сигнал к фиксации результата. Такой подход позволяет не только находить сильные точки входа, но и своевременно завершать сделки, снижая риски и сохраняя прибыль.
Следи за новыми статьями в нашем телеграм канале.
Не нужно выдумывать сложных схем и искать “грааль”. Используй инструменты платформы Resonance.
Регистрируйся по ссылке — получай бонус и начинай зарабатывать:
OKX | BingX | KuCoin.
Промокод TOPBLOG дает тебе 10% скидки на любой тарифный план Resonance.
Рекомендуемые статьи


